Note
Access to this page requires authorization. You can try signing in or changing directories.
Access to this page requires authorization. You can try changing directories.
With Visual Studio, you can easily create a Node.js project and use IntelliSense and other built-in features that support Node.js. In this tutorial, you create a Node.js web app project from a Visual Studio template. Then, you create a simple app using React.
In this tutorial, you learn how to:
- Create a Node.js project
- Add npm packages
- Add React code to your app
- Transpile JSX
- Attach the debugger
Important
Starting in Visual Studio 2022, you can alternatively create a React project using the recommended CLI-based project type. Some of the information in this article applies only to the Node.js project type (.njsproj). The template used in this article is no longer available starting in Visual Studio 2022 version 17.8 Preview 2.
Before you begin, here's a quick FAQ to introduce you to some key concepts:
What is Node.js?
Node.js is a server-side JavaScript runtime environment that executes JavaScript code.
What is npm?
The default package manager for Node.js is npm. A package manager makes it easier to publish and share Node.js source code libraries. The npm package manager simplifies library installation, updating, and uninstallation.
What is React?
React is a front-end framework for creating a user interface (UI).
What is JSX?
JSX is a JavaScript syntax extension typically used with React to describe UI elements. You must transpile JSX code to plain JavaScript before it can run in a browser.
What is webpack?
Webpack bundles JavaScript files so they can run in a browser, and can also transform or package other resources and assets. Webpack can specify a compiler, such as Babel or TypeScript, to transpile JSX or TypeScript code to plain JavaScript.
Prerequisites
This tutorial requires the following prerequisites:
Visual Studio with the Node.js development workload installed.
If you haven't yet installed Visual Studio:
Go to the Visual Studio downloads page to install Visual Studio for free.
In the Visual Studio Installer, select the Node.js development workload, and select Install.

If you have Visual Studio installed but need the Node.js workload:
In Visual Studio, go to Tools > Get Tools and Features.
In the Visual Studio Installer, choose the Node.js development workload, and select Modify to download and install the workload.
The Node.js runtime installed:
If you don't have the Node.js runtime installed, install the LTS version from the Node.js website. The LTS version has the best compatibility with other frameworks and libraries.
The Node.js tools in the Visual Studio Node.js workload support both Node.js 32-bit and 64-bit architecture versions. Visual Studio requires only one version, and the Node.js installer only supports one version at a time.
Visual Studio usually detects the installed Node.js runtime automatically. If not, you can configure your project to reference the installed runtime:
After you create a project, right-click the project node and select Properties.
In the Properties pane, set the Node.exe path to reference a global or local installation of Node.js. You can specify the path to a local interpreter in each of your Node.js projects.
This tutorial was tested with Node.js 12.6.2.
Create a project
First, create a Node.js web app project.
Open Visual Studio.
Create a new project.
Press Esc to close the start window. Type Ctrl + Q to open the search box, type Node.js, then choose Blank Node.js Web Application - JavaScript. (Although this tutorial uses the TypeScript compiler, the steps require that you start with the JavaScript template.)
In the dialog box that appears, choose Create.
If you don't see the Blank Node.js Web Application project template, you must add the Node.js development workload. For detailed instructions, see the Prerequisites.
Visual Studio creates the new solution and opens your project.
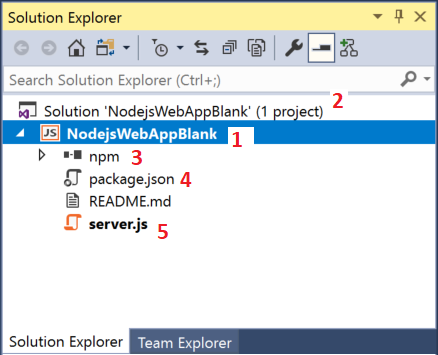
(1) Highlighted in bold is your project, using the name you gave in the New Project dialog box. In the file system, this project is represented by a
.njsprojfile in your project folder. You can set properties and environment variables associated with the project by right-clicking the project and choosing Properties (or press Alt + Enter). You can do round-tripping with other development tools, because the project file does not make custom changes to the Node.js project source.(2) At the top level is a solution, which by default has the same name as your project. A solution, represented by a
.slnfile on disk, is a container for one or more related projects.(3) The npm node shows any installed npm packages. You can right-click the npm node to search for and install npm packages using a dialog box or install and update packages using the settings in
package.jsonand right-click options in the npm node.(4)
package.jsonis a file used by npm to manage package dependencies and package versions for locally installed packages. For more information, see Manage npm packages.(5) Project files such as
server.jsshow up under the project node.server.jsis the project startup file and that is why it shows up in bold. You can set the startup file by right-clicking a file in the project and selecting Set as Node.js startup file.
Add npm packages
This app requires the following npm modules to run correctly:
- react
- react-dom
- express
- path
- ts-loader
- typescript
- webpack
- webpack-cli
To install a package:
In Solution Explorer, right-click the npm node and select Install New npm Packages.
In the Install New npm Packages dialog box, search for the react package, and select Install Package to install it.

In the Install New npm Packages dialog box, you can choose to install the most current package version or to specify a version. If you choose to install the current versions, but run into unexpected errors later, try installing the exact package versions listed in the next step.
The Output window in the Visual Studio lower pane shows package installation progress. Open the Output window by selecting View > Output or pressing Ctrl+Alt+O. In the Show output from field of the Output window, select Npm.
When installed, the react package appears under the npm node in Solution Explorer.
The project's
package.jsonfile updates with the new package information, including the package version.
Instead of using the UI to search for and add the rest of the packages one at a time, you can paste the required package code into package.json.
From Solution Explorer, open package.json in the Visual Studio editor. Add the following
dependenciessection before the end of the file:"dependencies": { "express": "^4.18.2", "path": "^0.12.7", "react": "^18.2.0", "react-dom": "^18.2.0", "ts-loader": "^9.4.2", "typescript": "^5.0.2", "webpack": "^5.76.3", "webpack-cli": "^5.0.1" },If the file already has a
dependenciessection, replace it with the preceding JSON code. For more information on using thepackage.jsonfile, see package.json configuration.Press Ctrl+S or select File > Save package.json to save the changes.
In Solution Explorer, right-click the npm node in your project and select Install npm Packages.
This command runs the npm install command directly to install all the packages listed in packages.json.
Select the Output window in the lower pane to see installation progress. Installation might take a few minutes, and you might not see results immediately. Make sure that you select Npm in the Show output from field in the Output window.
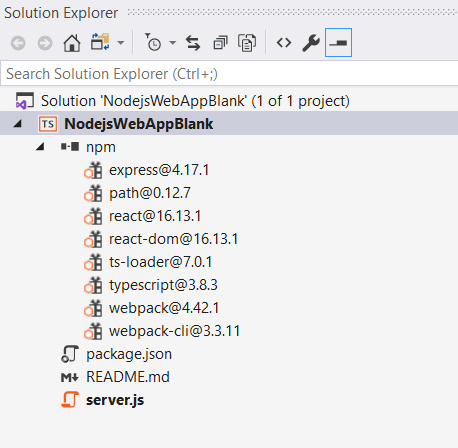
After installation, the npm modules appear in the npm node in Solution Explorer.
Note
You can also install npm packages by using the command line. In Solution Explorer, right-click the project name and select Open Command Prompt Here. Use standard Node.js commands to install packages.
Add project files
Next, add four new files to your project.
- app.tsx
- webpack-config.js
- index.html
- tsconfig.json
For this simple app, you add the new project files in the project root. For most apps, you add the files to subfolders and adjust relative path references accordingly.
In Solution Explorer, select the project name and press Ctrl+Shift+A, or right-click the project name and select Add > New Item.
If you don't see all the item templates, choose Show All Templates, and then choose the item template.
In the Add New Item dialog box, choose TypeScript JSX File, type the name app.tsx, and select Add or OK.
Repeat these steps to add a JavaScript file named webpack-config.js.
Repeat these steps to add an HTML file named index.html.
Repeat these steps to add a TypeScript JSON Configuration File named tsconfig.json.
Add app code
In Solution Explorer, open server.js and replace the existing code with the following code:
'use strict';
var path = require('path');
var express = require('express');

var app = express();

var staticPath = path.join(__dirname, '/');
app.use(express.static(staticPath));

// Allows you to set port in the project properties.
app.set('port', process.env.PORT || 3000);

var server = app.listen(app.get('port'), function() {
    console.log('listening');
});
The preceding code uses Express to start Node.js as your web application server. The code sets the port to the port number configured in the project properties, which by default is 1337. If you need to open the project properties, right-click the project name in Solution Explorer and select Properties.
Open app.tsx and add the following code:
declare var require: any

var React = require('react');
var ReactDOM = require('react-dom');

export class Hello extends React.Component {
    render() {
        return (
            <h1>Welcome to React!!</h1>
        );
    }
}

ReactDOM.render(<Hello />, document.getElementById('root'));
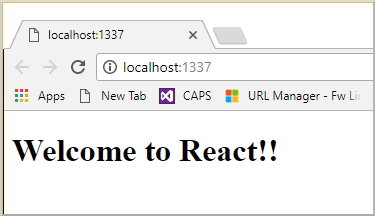
The preceding code uses JSX syntax and React to display a message.
Open index.html and replace the
bodysection with the following code:<body> <div id="root"></div> <!-- scripts --> <script src="./dist/app-bundle.js"></script> </body>This HTML page loads app-bundle.js, which contains the JSX and React code transpiled to plain JavaScript. Currently, app-bundle.js is an empty file. In the next section, you configure options to transpile the code.
Configure webpack and TypeScript compiler options
Next, you add webpack configuration code to webpack-config.js. You add a simple webpack configuration that specifies an input file, app.tsx, and an output file, app-bundle.js, for bundling and transpiling JSX to plain JavaScript. For transpiling, you also configure some TypeScript compiler options. This basic configuration code is an introduction to webpack and the TypeScript compiler.
In Solution Explorer, open webpack-config.js and add the following code.
module.exports = {
    devtool: 'source-map',
    entry: "./app.tsx",
    mode: "development",
    output: {
        filename: "./app-bundle.js"
    },
    resolve: {
        extensions: ['.Webpack.js', '.web.js', '.ts', '.js', '.jsx', '.tsx']
    },
    module: {
        rules: [
            {
                test: /\.tsx$/,
                exclude: /(node_modules|bower_components)/,
                use: {
                    loader: 'ts-loader'
                }
            }
        ]
    }
}
The webpack configuration code instructs webpack to use the TypeScript loader to transpile the JSX.
Open tsconfig.json and replace the contents with the following code, which specifies the TypeScript compiler options:
{
  "compilerOptions": {
    "noImplicitAny": false,
    "module": "commonjs",
    "noEmitOnError": true,
    "removeComments": false,
    "sourceMap": true,
    "target": "es5",
    "jsx": "react"
  },
  "exclude": [
    "node_modules"
  ],
  "files": [
    "app.tsx"
  ]
}
The code specifies
app.tsxas the source file.Press Ctrl+Shift+S or select File > Save All to save all changes.
Transpile the JSX
In Solution Explorer, right-click the project name and select Open Command Prompt Here.
In the command prompt, enter the following webpack command:
node_modules\.bin\webpack --config webpack-config.jsThe command prompt window shows the result.

If you see any errors instead of the preceding output, you must resolve them before your app will work. If your npm package versions are different than the versions this tutorial specifies, that can cause errors. To fix the errors, try the following:
Use the exact versions shown in the earlier step, if you didn't already
Or, if you still see errors:
Install the most recent versions of the npm packages by right-clicking the npm node in Solution Explorer and choosing Install npm packages.
If one or more package versions are deprecated and result in an error, you might need to install a more recent version to fix errors. For information on using
package.jsonto control npm package versions, see package.json configuration.In Solution Explorer, right-click the project node and select Add > Existing Folder.
Select the dist folder, and then select Select Folder.
Visual Studio adds the dist folder, which contains app-bundle.js and app-bundle.js.map, to the project.
Open app-bundle.js to see the transpiled JavaScript code.
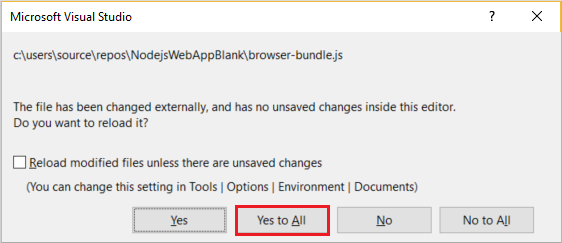
If prompted whether to reload externally modified files, select Yes to All.
Anytime you make changes to app.tsx, you must rerun the webpack command. To automate this step, you can add a build script to transpile the JSX.
Add a build script to transpile the JSX
Visual Studio versions starting with Visual Studio 2019 require a build script. Instead of transpiling JSX at the command line, as shown in the preceding section, you can transpile JSX when building from Visual Studio.
Open
package.jsonand add the following section after thedependenciessection:"scripts": { "build": "webpack-cli --config webpack-config.js" }Save your changes.
Run the app
In the Debug toolbar, select either Web Server (Microsoft Edge) or Web Server (Google Chrome) as the debug target.

If you know your preferred debug target is available on your machine, but it doesn't appear as an option, select Browse With from the debug target dropdown list. Select your default browser target in the list, and select Set as Default.
To run the app, press F5, select the green arrow button, or select Debug > Start Debugging.
A Node.js console window opens that shows the debugger listening port.
Visual Studio starts the app by launching the startup file, server.js.
Close the browser and console windows.
Set a breakpoint and run the app
Breakpoints are the most basic and essential feature of reliable debugging. A breakpoint indicates where Visual Studio should suspend your running code. You can then observe variable values, memory behavior, or whether a branch of code is running.
In server.js, click in the gutter to the left of the
staticPathdeclaration to set a breakpoint:
To run the app, press F5 or select Debug > Start Debugging.
The debugger pauses at the breakpoint you set, with the current statement highlighted. Now, you can inspect your app state by hovering over variables that are currently in scope, using debugger windows like the Locals and Watch windows.
To continue running the app, press F5, select Continue in the Debug toolbar, or select Debug > Continue.
If you want to use the Chrome Developer Tools or F12 Tools for Microsoft Edge, press F12. You can use these tools to examine the DOM and interact with the app by using the JavaScript Console.
Close the browser and console windows.
Set and hit a breakpoint in the client-side React code
In the preceding section, you attached the debugger to server-side Node.js code. To attach to and hit breakpoints in the client-side React code, you have to attach the debugger to the correct process. Here's one way to enable a browser and attach a process for debugging.
Enable the browser for debugging
You can use either Microsoft Edge or Google Chrome. Close all windows for the target browser. For Microsoft Edge, also shut down all instances of Chrome. Because both browsers share the Chromium code base, shutting down both browsers gives the best results.
Other browser instances can prevent the browser from opening with debugging enabled. Browser extensions might prevent full debug mode. You might need to use Task Manager to find and end all running Chrome instances.
To start your browser with debugging enabled:
Select Browse With from the dropdown list in the Debug toolbar.
On the Browse With screen, with your preferred browser highlighted, select Add.
Enter the --remote-debugging-port=9222 flag in the Arguments field.
Give the browser a new friendly name such as Edge with debugging or Chrome with debugging, and then select OK.
On the Browse With screen, select Browse.

Alternatively, you can open the Run command by right-clicking the Windows Start button, and enter:
msedge --remote-debugging-port=9222or
chrome.exe --remote-debugging-port=9222
The browser starts with debugging enabled. The app isn't running yet, so the browser page is empty.
Attach the debugger to client-side script
In the Visual Studio editor, set a breakpoint in either the app-bundle.js or
app.tsxsource code.For app-bundle.js, set the breakpoint in the
render()function. To find therender()function in the app-bundle.js file, press Ctrl+F or select Edit > Find and Replace > Quick Find, and enter render in the search field.
For app.tsx, set the breakpoint inside the
render()function, on thereturnstatement.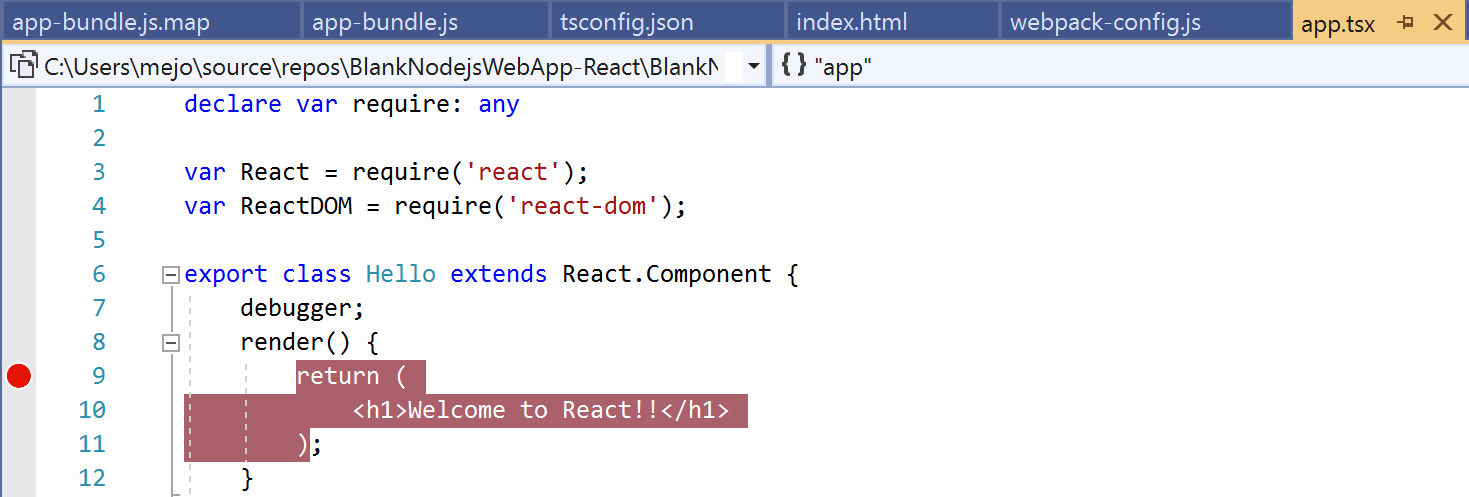
If you set the breakpoint in app.tsx, also update webpack-config.js to replace the following code, and save your changes.
Replace this code:
output: {
    filename: "./app-bundle.js",
},
With this code:
output: {
    filename: "./app-bundle.js",
    devtoolModuleFilenameTemplate: '[resource-path]'  // removes the webpack:/// prefix
},
This development-only setting enables debugging in Visual Studio. By default, webpack references in the source map file include the webpack:/// prefix, which prevents Visual Studio from finding the source file app.tsx. This setting overrides the generated references in the source map file, app-bundle.js.map, when building the app. Specifically, this setting changes the reference to the source file from webpack:///./app.tsx to ./app.tsx, which enables debugging.
Select your target browser as the debug target in Visual Studio, and then press Ctrl+F5, or select Debug > Start Without Debugging, to run the app in the browser.
If you created a debugging-enabled browser configuration with a friendly name, choose that browser as your debug target.
The app opens in a new browser tab.
Select Debug > Attach to Process, or press Ctrl+Alt+P.
Tip
Once you attach to the process the first time, you can quickly reattach to the same process by selecting Debug > Reattach to Process or pressing Shift+Alt+P.
In the Attach to Process dialog box, get a filtered list of browser instances that you can attach to.
Make sure the correct debugger for your target browser, JavaScript (Chrome) or JavaScript (Microsoft Edge - Chromium), appears in the Attach to field. Type chrome or edge in the filter box to filter the results.
Select the browser process with the correct host port,
localhostin this example. The port number 1337 orlocalhostmight also appear in the Title field to help you select the correct process.Select Attach.
The following example shows an Attach to Process window for the Microsoft Edge browser.

Tip
If the debugger doesn't attach and you see the message Unable to attach to the process. An operation is not legal in the current state., use Task Manager to close all instances of the target browser before starting the browser in debugging mode. Browser extensions may be running and preventing full debug mode.
Because the code with the breakpoint already executed, refresh your browser page to hit the breakpoint.
Depending on your environment, browser state, and which steps you followed earlier, you might hit the breakpoint in app-bundle.js or its mapped location in app.tsx. Either way, you can step through code and examine variables.
While the debugger is paused, you can examine your app state by hovering over variables and using debugger windows. To step through code, press F11 or select Debug > Step Into, or press F10 or select Debug > Step Over. To continue running the code, press F5 or select Continue. For more information on basic debugging features, see First look at the debugger.
If you can't break into code in app.tsx, retry using Attach to Process to attach the debugger as described in the previous steps. Make sure that your environment is set up correctly:
Close all browser instances, including Chrome extensions, by using the Task Manager. Make sure you start the browser in debug mode.
Make sure your source map file includes a reference to ./app.tsx and not webpack:///./app.tsx, which prevents the Visual Studio debugger from locating app.tsx.
Or, try using the
debugger;statement in app.tsx, or set breakpoints in the Chrome Developer Tools or F12 Tools for Microsoft Edge instead.If you can't break into code in app-bundle.js, remove the source map file, app-bundle.js.map.