Common patterns for poorly-behaved multithreaded applications
The Concurrency Visualizer helps developers to visualize the behavior of a multithreaded application. This tool includes a gallery of common patterns for multithreaded applications that behave badly. The gallery includes typical and recognizable visual patterns that are exposed through the tool, together with an explanation of the behavior that is represented by each pattern, the likely result of that behavior, and the most common approach to resolve it.
Lock contention and serialized execution

Sometimes a parallelized application stubbornly continues to execute serially even though it has several threads and the computer has a sufficient number of logical cores. The first symptom is poor multithreaded performance, perhaps even a bit slower than a serial implementation. In Threads View, you do not see multiple threads running in parallel; instead, you see that only one thread is executing at any time. At this point, if you click a synchronization segment in a thread, you can see a call stack for the blocked thread (blocking call stack) and the thread that removed the blocking condition (unblocking call stack). In addition, if the unblocking call stack occurs in the process that you are analyzing, a Thread-Ready connector is displayed. From this point, you can navigate to your code from the blocking and unblocking call stacks to investigate the cause of serialization even more.
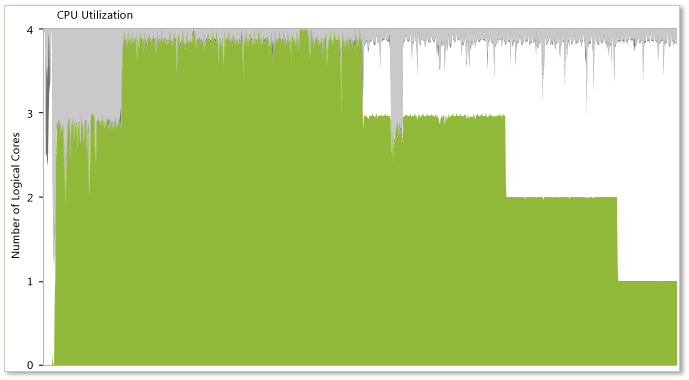
As shown in the following illustration, the Concurrency Visualizer can also expose this symptom in the CPU Utilization View, where, despite the presence of multiple threads, the application consumes only one logical core.
For more information, see the "Start with the problem section" in the MSDN Magazine article Thread Performance - Resource Contention Concurrency Profiling in Visual Studio.

Uneven workload distribution
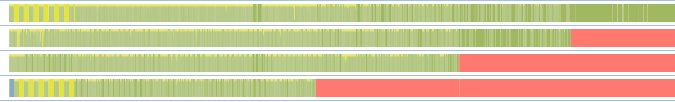
When an irregular distribution of work occurs across several parallel threads in an application, a typical stair-step pattern appears as each thread completes its work, as shown in the previous illustration. The Concurrency Visualizer most often shows very close start times for each concurrent thread. However, these threads typically end in an irregular manner instead of ending simultaneously. This pattern indicates an irregular distribution of work among a group of parallel threads, which could lead to decreased performance. The best approach to such a problem is to reevaluate the algorithm by which work has been divided among the parallel threads.
As shown in the following illustration, the Concurrency Visualizer can also expose this symptom in the CPU Utilization View as a gradual step-down in CPU utilization.
Oversubscription
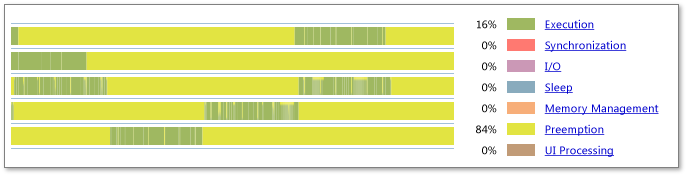
In the case of oversubscription, the number of active threads in a process is larger than the number of available logical cores on the system. The previous illustration shows the results of oversubscription, with significant preemption banding in all active threads. In addition, the legend shows a large percentage of time is spent in Preemption (84 percent in this example). This may indicate that the process is asking the system to execute more concurrent threads than the number of logical cores. However, this may also indicate that other processes on the system are using resources that were assumed to be available to this process.
You should consider the following when you evaluate this problem:
The overall system may be oversubscribed. Consider that other processes on the system may be preempting your threads. When you pause over a preemption segment in the threads view, a tooltip will identify the thread and the process that preempted the thread. This process is not necessarily the one that executed during the whole time that your process was preempted, but it provides a hint about what created the preemption pressure against your process.
Evaluate how your process determines the appropriate number of threads for execution during this phase of work. If your process directly calculates the number of active parallel threads, consider modifying that algorithm to better account for the number of available logical cores on the system. If you use the Concurrency Runtime, the Task Parallel Library, or PLINQ, these libraries perform the work of calculating the number of threads.
Inefficient I/O

Overuse or misuse of I/O is a common cause of inefficiencies in applications. Consider the previous illustration. The Visible Timeline Profile shows that 44 percent of the visible thread time is consumed by I/O. The timeline shows large amounts of I/O, which indicates that the profiled application is frequently blocked by I/O. To see details about the kinds of I/O and where your program is blocked, zoom into problematic regions, examine the Visible Timeline Profile, and then click a specific I/O block to see current call stacks.
Lock convoys

Lock convoys occur when the application acquires locks in a first-come, first-served order, and when the arrival rate at the lock is higher than the acquisition rate. The combination of these two conditions causes requests for the lock to start backing up. One way to combat this problem is to use "unfair" locks, or locks that give access to the first thread to find them in unlocked states. The previous illustration shows this convoy behavior. To solve the problem, try reducing contention for the synchronization objects and try using unfair locks.