Note
Access to this page requires authorization. You can try signing in or changing directories.
Access to this page requires authorization. You can try changing directories.
The .NET Counters tool allows you to visualize dotnet counters over time right from within the Visual Studio profiler.
Note
The .NET Counters tool requires Visual Studio 2019 version 16.7 or later and targets .NET Core 3.0+ and .NET 5+.
For additional information on learning to use the .NET Counters tool effectively, see Case study: Isolate a performance issue.
Setup
In the Visual Studio project, set the solution configuration to Release and select the deployment target.
The deployment target typically matches the project name, indicating a local deployment.
Open the Performance Profiler (Alt + F2 or Debug -> Performance Profiler) in Visual Studio.
Select the .NET Counters check box.


Click the Start button to run the tool.
For more information on how to optimize tool performance, see Optimizing Profiler settings.
Understand your data
While the tool is initially collecting data, you can see the live values of dotnet counters.


You can also view graphs of the counters by selecting the checkbox next to the counter names. You can display the graphs of multiple counters at a time.
Once you are done exercising your app and collecting data, you can stop collection for an even more detailed report. To do this, press the Stop Collection button.
Once the report loads, you should see a finalized report similar to the one shown below.


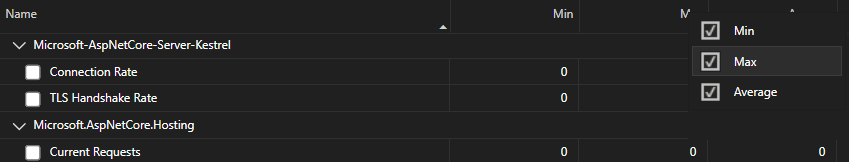
The report shows you the following values:
- Min - The minimum value for that counter in the selected time range.
- Max - The maximum value for that counter in the selected time range.
- Average - The average value for that counter in the selected time range.
You can filter or add columns in the table by right clicking the column headings and selecting a heading.

You can also view graphs in the detailed report by selecting the checkboxes next to counters. The data in the tables represents the values of the entire duration of your collected trace by default. To filter down the data to a specific time range, click and drag on the graphs.


The table updates to relevant values for the time selected in the graphs. Use the Clear Selection button to reset the selected time range to the entire trace.
View .NET Meter counter data
Starting in Visual Studio 2022 version 17.8, .NET Counters tool supports integration with the .NET Meter API, adding support for instrument options such as Counter and ObservableCounter.
The Counter keeps track of a value changing over time, with the caller reporting updates using Counter.Add. In contrast, ObservableCounter is similar to Counter, but the caller takes care of keeping track of the total value. The .NET Counters tool reports the rate of change in the total.
For more information, see Creating Metrics.
View .NET Meter histogram data
Starting in Visual Studio 2022 version 17.12 Preview 2, .NET Counters tool supports .NET Meter Histogram integration.
The .NET Meter Histogram allows you to identify and analyze histogram data generated by .NET histogram instruments, recorded using CreateHistogram. When recording data using the histogram instrument, results are visualized, providing a clear representation of data distribution.
Live histogram data is shown with the rest of the counters, under the name of the Meter instance.
To open the histogram graph, select the instrument name for the Meter instance, as shown here.

In the preceding example, the tool shows data for the 50th, 90th, and 95th percentiles of the recorded measurements.