Beginner's guide to optimizing code and reducing compute costs (C#, Visual Basic, C++, F#)
Reducing your compute time means reducing costs, so optimizing your code can save money. This case study uses a sample application with performance issues to demonstrate how to use profiling tools to improve efficiency.
This case study covers these topics:
- The importance of code optimization and its impact on reducing compute costs.
- How to use Visual Studio profiling tools to analyze application performance.
- How to interpret the data provided by these tools to identify performance bottlenecks.
- How to apply practical strategies to optimize code, focusing on CPU usage, memory allocation, and database interactions.
Follow along and then apply these techniques to your own applications to make them more efficient and cost-effective.
Optimization case study
The sample application examined in this case study is a .NET application that runs queries against a database of blogs and blog posts. It utilizes the Entity Framework, a popular ORM (Object-Relational Mapping) for .NET, to interact with a SQLite local database. The application is structured to execute a large number of queries, simulating a real-world scenario where a .NET application might be required to handle extensive data retrieval tasks. The sample application is a modified version of the Entity Framework getting started sample.
The primary performance issue with the sample application lies in how it manages compute resources and interacts with the database. The application has a performance bottleneck that significantly impacts its efficiency and, consequently, the compute costs associated with running it. The problem includes the following symptoms:
High CPU Usage: Applications may perform inefficient computations or processing tasks in a way that unnecessarily consumes a large amount of CPU resources. This can lead to slow response times and increased operational costs.
Inefficient Memory Allocation: Applications can sometimes face issues related to memory usage and allocation. In .NET apps, inefficient memory management can lead to increased garbage collection, which in turn can affect application performance.
Database Interaction Overheads: Applications that execute a large number of queries against a database can experience bottlenecks related to database interactions. This includes inefficient queries, excessive database calls, and poor use of Entity Framework capabilities, all of which can degrade performance.
The case study aims to address these issues by employing Visual Studio's profiling tools to analyze the application's performance. By understanding where and how the application's performance can be improved, developers can implement optimizations to reduce CPU usage, improve memory allocation efficiency, streamline database interactions, and optimize resource utilization. The ultimate goal is to enhance the application's overall performance, making it more efficient and cost-effective to run.
Challenge
Addressing the performance issues in the sample .NET application presents several challenges. These challenges stem from the complexity of diagnosing performance bottlenecks. The key challenges in fixing the problems described are as follows:
Diagnosing Performance Bottlenecks: One of the primary challenges is accurately identifying the root causes of the performance issues. High CPU usage, inefficient memory allocation, and database interaction overheads can have multiple contributing factors. Developers must use profiling tools effectively to diagnose these issues, which requires some understanding of how these tools work and how to interpret their output.
Knowledge and Resource Constraints: Finally, teams may face constraints related to knowledge, expertise, and resources. Profiling and optimizing an application requires specific skills and experience, and not all teams may have immediate access to these resources.
Addressing these challenges requires a strategic approach that combines effective use of profiling tools, technical knowledge, and careful planning and testing. The case study aims to guide developers through this process, providing strategies and insights to overcome these challenges and improve the application's performance.
Strategy
Here is a high-level view of the approach in this case study:
- We start the investigation by taking a CPU usage trace. Visual Studio's CPU Usage tool is often helpful to begin performance investigations and to optimize code to reduce cost.
- Next, to get additional insights to help isolate issues or improve the performance, we collect a trace using one of the other profiling tools. For example:
- We take a look at the memory usage. For .NET, we try the .NET Object Allocation tool first. (For either .NET or C++, you can look at the Memory Usage tool instead.)
- For ADO.NET or Entity Framework, we can use the Database tool to examine SQL queries, precise query time, and more.
Data collection requires the following tasks:
- Setting the app to a Release build.
- Selecting the CPU Usage tool from the Performance Profiler (Alt+F2). (Later steps involve a few of the other tools.)
- From the Performance Profiler, start the app and collect a trace.
Inspect areas of high CPU usage
After collecting a trace with the CPU Usage tool and loading it into Visual Studio, we first check the initial .diagsession report page that shows summarized data. Use the Open details link in the report.
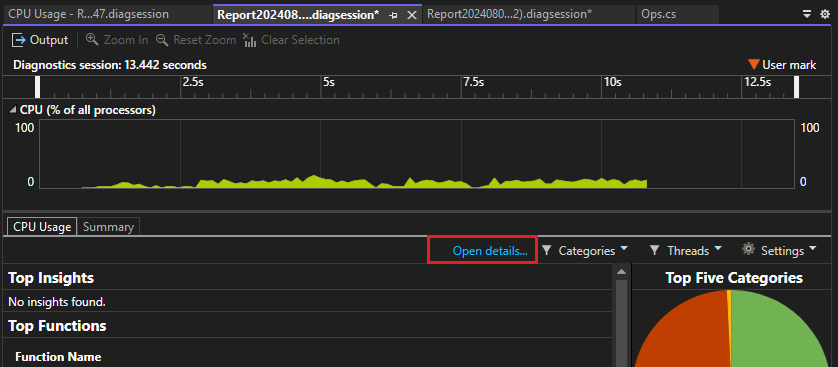
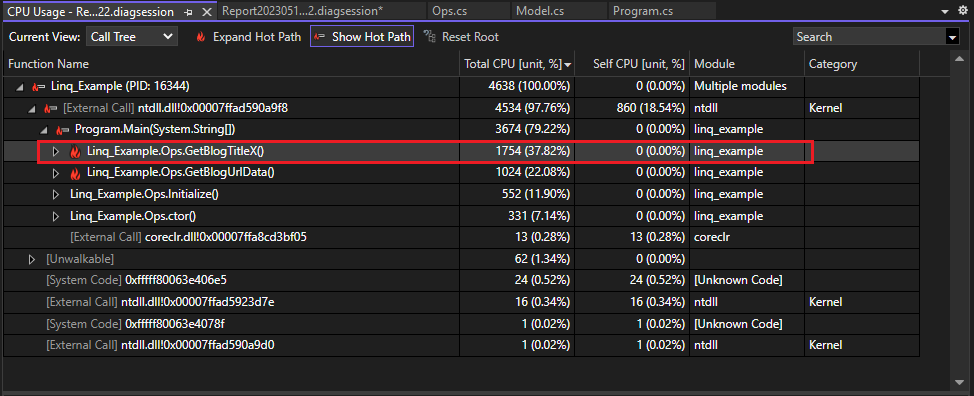
In the report details view, open the Call Tree view. The code path with highest CPU usage in the app is called the hot path. The hot path flame icon (![]() ) can help to quickly identify performance issues that might be improved.
) can help to quickly identify performance issues that might be improved.
In the Call Tree view, you can see high CPU usage for the GetBlogTitleX method in the app, using about a 60% share of the app's CPU usage. However, the Self CPU value for GetBlogTitleX is low, only about .10%. Unlike Total CPU, the Self CPU value excludes time spent in other functions, so we know to look farther down the call tree for the real bottleneck.
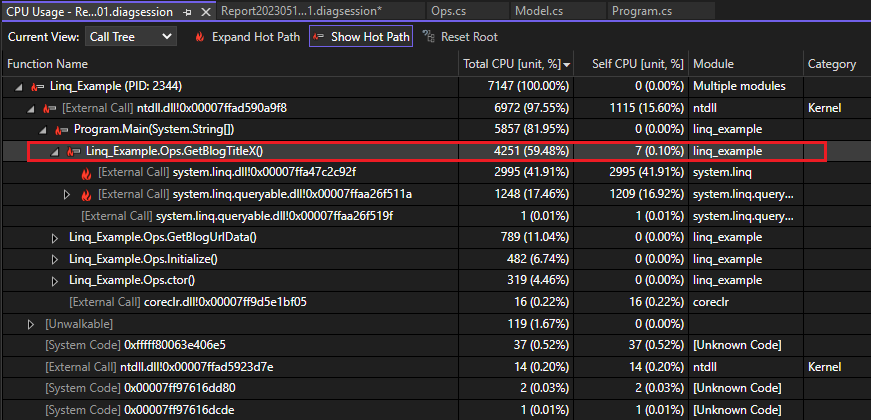
GetBlogTitleX makes external calls to two LINQ DLLs, which are using most of the CPU time, as evidenced by the very high Self CPU values. This is the first clue that a LINQ query might be an area to optimize.

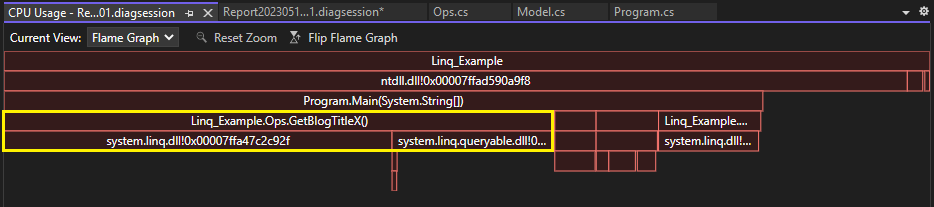
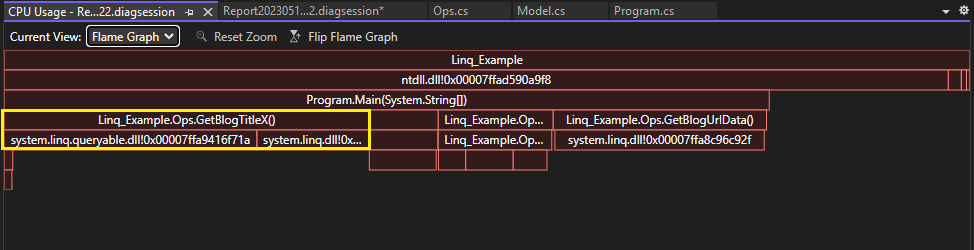
To get a visualized call tree and a different view of the data, open the Flame Graph view. (Or, right-click GetBlogTitleX and choose View in Flame Graph.) Here again, it looks like the GetBlogTitleX method is responsible for a lot of the app's CPU usage (shown in yellow). External calls to the LINQ DLLs show up beneath the GetBlogTitleX box, and they're using all of the CPU time for the method.
Gather additional data
Often, other tools can provide additional information to help the analysis and isolate the problem. In this case study, we take the following approach:
- First, look at memory usage. There might be a correlation between high CPU usage and high memory usage, so it can be helpful to look at both to isolate the issue.
- Because we identified the LINQ DLLs, we'll also look at the Database tool.
Check the memory usage
To see what's going on with the app in terms of memory usage, we collect a trace using the .NET Object Allocation tool (For C++, you can use the Memory Usage tool instead). The Call Tree view in the memory trace shows the hot path and helps us identify an area of high memory usage. No surprise at this point, the GetBlogTitleX method appears to be generating a lot of objects! Over 900,000 object allocations, in fact.
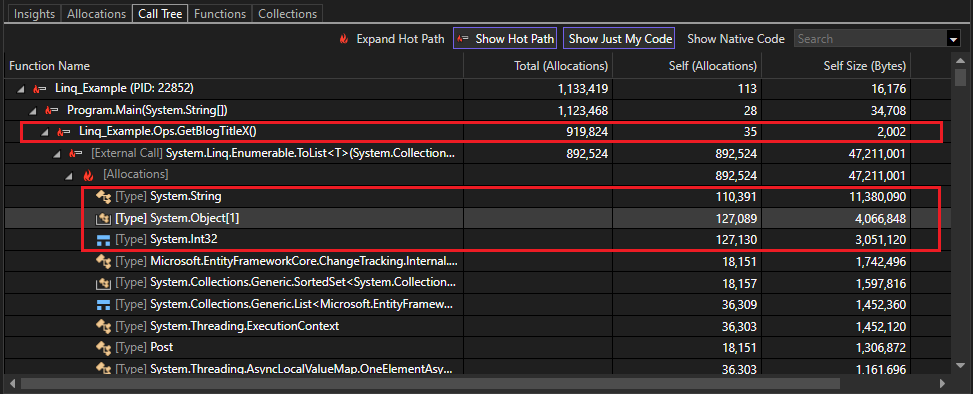
Most of the objects created are strings, object arrays, and Int32s. We may be able to see how these types are generated by examining the source code.
Check the query in the Database tool
In the Performance Profiler, we select the Database tool instead of CPU Usage (or, select both). When we've collected a trace, open the Queries tab in the diagnostics page. In the Queries tab for the Database trace, you can see the first row shows the longest query, 2446 ms. The Records column shows how many records the query reads. You can use this information for later comparison.
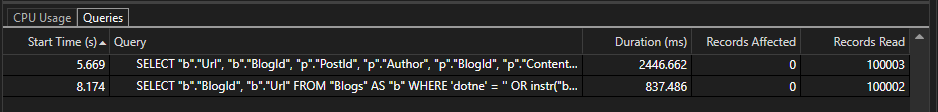
By examining the SELECT statement generated by LINQ in the Query column, we identify the first row as the query associated with the GetBlogTitleX method. To view the full query string, expand the column width. The full query string is:
SELECT "b"."Url", "b"."BlogId", "p"."PostId", "p"."Author", "p"."BlogId", "p"."Content", "p"."Date", "p"."MetaData", "p"."Title"
FROM "Blogs" AS "b" LEFT JOIN "Posts" AS "p" ON "b"."BlogId" = "p"."BlogId" ORDER BY "b"."BlogId"
Notice that the app is retrieving a lot of column values here, perhaps more than we need. Let's look at the source code.
Optimize code
It's time to take a look at the GetBlogTitleX source code. In the Database tool, right-click the query and choose Go to Source File. In the source code for GetBlogTitleX, we find the following code that uses LINQ to read the database.
foreach (var blog in db.Blogs.Select(b => new { b.Url, b.Posts }).ToList())
  {
    foreach (var post in blog.Posts)
    {
      if (post.Author == "Fred Smith")
      {
        Console.WriteLine($"Post: {post.Title}");
      }
  }
}
This code uses foreach loops to search the database for any blogs with "Fred Smith" as the author. Looking at it, you can see that a lot of objects are getting generated in memory: a new object array for each blog in the database, associated strings for each URL, and values for properties contained in the posts, such as blog ID.
We do a little research and find some common recommendations for how to optimize LINQ queries and come up with this code.
foreach (var x in db.Posts.Where(p => p.Author.Contains("Fred Smith")).Select(b => b.Title).ToList())
{
  Console.WriteLine("Post: " + x);
}
In this code, we made several changes to help optimize the query:
- Added the
Whereclause and eliminate one of theforeachloops. - Projected only the Title property in the
Selectstatement, which is all we need in this example.
Next, we retest using the profiling tools.
Results
After updating the code, we re-run the CPU Usage tool to collect a trace. The Call Tree view shows that GetBlogTitleX is running only 1754 ms, using 37% of the app's CPU total, a significant improvement from 59%.
Switch to the Flame Graph view to see another visualization showing the improvement. In this view, GetBlogTitleX also uses a smaller portion of the CPU.
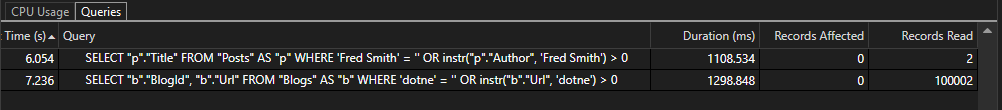
Check the results in the Database tool trace, and only two records are read using this query, instead of 100,000! Also, the query is much simplified and eliminates the unnecessary LEFT JOIN that was generated previously.
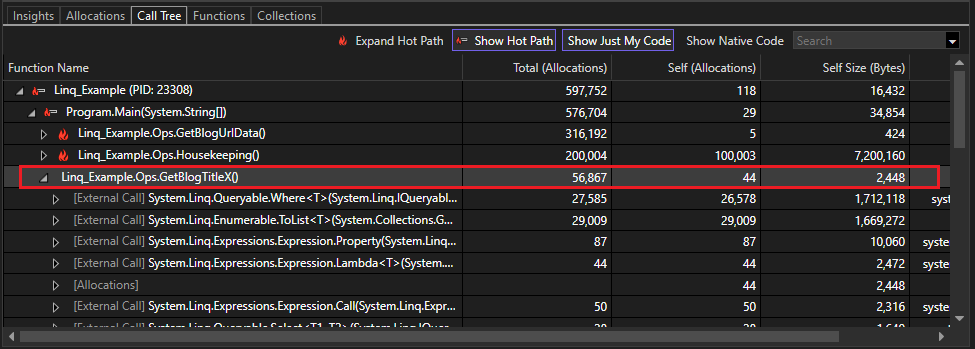
Next, we recheck the results in the .NET Object Allocation tool, and see that GetBlogTitleX is only responsible for 56,000 object allocations, nearly a 95% reduction from 900,000!
Iterate
Multiple optimizations may be necessary and we can continue to iterate with code changes to see which changes improve performance and help reduce the compute cost.
Next steps
The following articles and blog posts provide more information to help you learn to use the Visual Studio performance tools effectively.
- Isolate a performance issue
- Case Study: Double performance in under 30 minutes
- Improving Visual Studio performance with the new Instrumentation Tool