Note
Access to this page requires authorization. You can try signing in or changing directories.
Access to this page requires authorization. You can try changing directories.
In this article, you explore how to configure your Visual Studio installation to support debugging Python code on remote Linux computers. This walkthrough is based on Visual Studio 2019 version 16.6.
Visual Studio can launch and debug Python applications locally and remotely on a Windows computer. Visual Studio also supports debugging remotely on a different operating system, device, or Python implementation other than CPython by using the debugpy library.
Visual Studio 2019 version 16.4 and earlier uses the ptvsd library. In Visual Studio 2019 version 16.5 and later, the debugpy library replaces ptvsd. When you use debugpy, the Python code being debugged hosts the debug server to which Visual Studio can attach. This hosting requires a small modification to your code to import and enable the server. You might also need to adjust the network or firewall configurations on the remote computer to allow TCP connections.
Prerequisites
Visual Studio installed with support for Python workloads. For more information, see Install Python support in Visual Studio.
A remote computer running Python on an operating system like macOS or Linux.
Port 5678 (inbound) open on the remote computer's firewall, which is the default for remote debugging.
Set up a Linux computer
You can easily create a Linux virtual machine on Azure and access it by using Remote Desktop from Windows. Ubuntu for the virtual machine is convenient because Python is installed by default. If you have a different configuration, see Install Python interpreters for other Python download locations.
Configure the firewall
The inbound port 5678 must be open on the remote computer's firewall to support remote debugging.
For details on how create a firewall rule for an Azure virtual machine, see the following articles:
- Filter network traffic with a network security group by using the Azure portal
- Route network traffic with a route table using the Azure portal
- Deploy and configure Azure Firewall using the Azure portal
Prepare the script for debugging
Follow these steps to prepare a script for debugging your Python code on Linux.
On the remote computer, create a Python file named guessing-game.py with the following code:
import random

guesses_made = 0
name = input('Hello! What is your name?\n')
number = random.randint(1, 20)
print('Well, {0}, I am thinking of a number between 1 and 20.'.format(name))

while guesses_made < 6:
    guess = int(input('Take a guess: '))
    guesses_made += 1
    if guess < number:
        print('Your guess is too low.')
    if guess > number:
        print('Your guess is too high.')
    if guess == number:
        break
if guess == number:
    print('Good job, {0}! You guessed my number in {1} guesses!'.format(name, guesses_made))
else:
    print('Nope. The number I was thinking of was {0}'.format(number))
Install the
debugpypackage into your environment by using thepip3 install debugpycommand.Note
It's a good idea to record the version of debugpy that's installed in case you need it for troubleshooting. The debugpy listing also shows available versions.
Enable remote debugging by adding the following code at the top of the guessing-game.py file before other code. (Though not a strict requirement, it's impossible to debug any background threads spawned before the
listenfunction is called.)import debugpy debugpy.listen(('0.0.0.0', 5678))Save the file and run the program:
python3 guessing-game.pyThe call to the
listenfunction runs in the background and waits for incoming connections as you interact with the program. If desired, you can call thewait_for_clientfunction after you call thelistenfunction to block the program until the debugger attaches.
Tip
In addition to the listen and wait_for_client functions, debugpy also provides a helper function breakpoint. This function serves as a programmatic breakpoint if the debugger is attached. Another function, is_client_connected1, returns True if the debugger is attached. You don't need to check this result before you call any other debugpy functions.
Attach remotely from Python Tools
The following steps show how to set a breakpoint to stop the remote process.
Create a copy of the remote file on the local computer and open it in Visual Studio. It doesn't matter where the file is located, but its name should match the name of the script on the remote computer.
(Optional) To have IntelliSense for debugpy on your local computer, install the debugpy package into your Python environment.
Select Debug > Attach to Process.
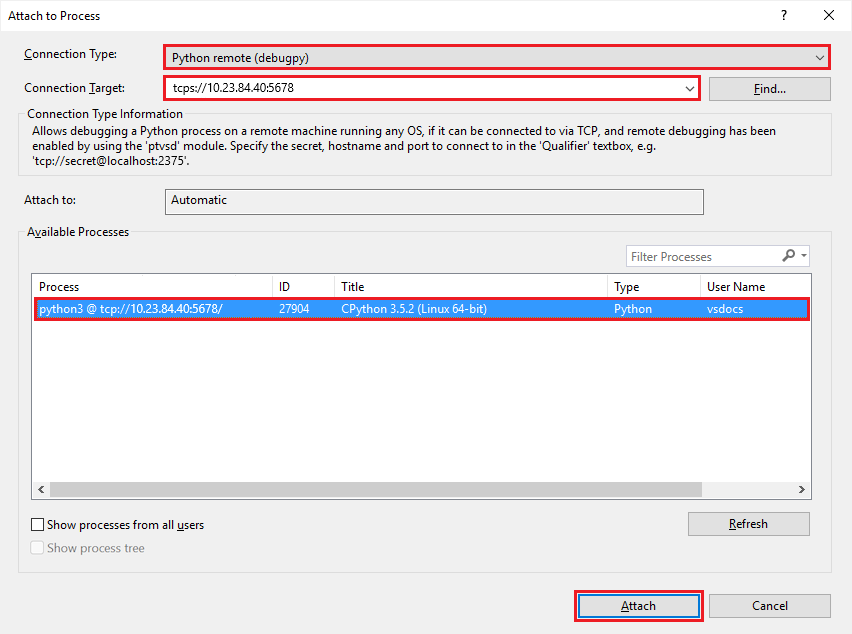
In the Attach to Process dialog, set Connection Type to Python remote (debugpy).
In the Connection Target field, enter the command
tcp://<ip_address>:5678.tcp://specifies the connection type as Transmission Control Protocol (TCP).<ip_address>is the IP address of the remote computer, which can be an explicit address or a name like myvm.cloudapp.net.:5678is the remote debugging port number.
Select Enter to populate the list of available debugpy processes on that computer:
If you happen to start another program on the remote computer after populating this list, select the Refresh button.
Select the process to debug and select Attach, or double-click the process.
Visual Studio switches into debugging mode while the script continues to run on the remote computer, providing all the usual debugging capabilities.
You can set a breakpoint on the
if guess < number:line, then switch over to the remote computer and enter another guess. Visual Studio on your local computer stops at the breakpoint, shows local variables, and so on: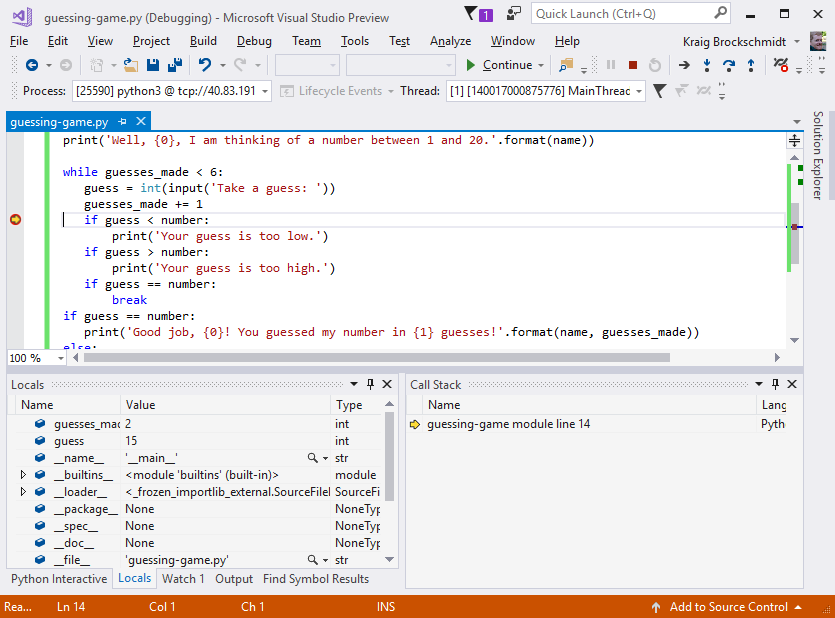
When you stop debugging, Visual Studio detaches from the program. The program continues to run on the remote computer. debugpy also continues listening for attaching debuggers, so you can reattach to the process again at any time.


Troubleshoot the connection
Review the following points to help troubleshoot issues with the connection.
Make sure you select Python remote (debugpy) for the Connection Type.
Confirm the secret in the Connection Target exactly matches the secret in the remote code.
Confirm the IP address in the Connection Target matches that of the remote computer.
Verify the remote debugging port on the remote computer is open, and the connection target includes the port suffix, such as
:5678.To use a different port, specify the port number in the call to the
listenfunction, as indebugpy.listen((host, port)). In this case, be sure to open the specific port in the firewall.Confirm the debugpy version installed on the remote computer (as returned by the
pip3 listcommand) matches the Visual Studio Python Tools (PTVS) version.The following table lists the valid version pairs. As necessary, update the version of debugpy on the remote computer.
Visual Studio Python Tools debugpy 2019 16.6 1.0.0b5 1.0.0b5 2019 16.5 1.0.0b1 1.0.0b1
Note
Visual Studio 2019 version 16.0-16.4 utilized ptvsd, not debugpy. The process in this walkthrough for those versions is similar, but the function names are different. Visual Studio 2019 version 16.5 uses debugpy, but the function names were the same as those in ptvsd. Instead of listen, you would use enable_attach. Instead of wait_for_client, you would use wait_for_attach. Instead of breakpoint, you would use break_into_debugger.
Use ptvsd 3.x for legacy debugging
The ptvsd 3.x legacy debugger is the default in Visual Studio 2017 version 15.7 and earlier.
Depending on your Visual Studio configuration, you might need to use ptvsd 3.x for remote debugging:
- Visual Studio 2017 version 15.7 and earlier with Python 2.6, 3.1 to 3.4, or IronPython
- Visual Studio 2019 version 16.5 and later with Python 2.6, 3.1 to 3.4, or IronPython
- Early 4.x versions
If your configuration implements an older version scenario, Visual Studio shows the error, Debugger does not support this Python environment.
Setup remote debugging
To prepare for remote debugging with ptvsd 3.x, complete the following steps:
Set up your secret, which is used to restrict access to the running script.
In ptvsd 3.x, the
enable_attachfunction requires you to pass a "secret" as the first argument.- When you attach the remote debugger, enter the secret with the
enable_attach(secret="<secret>")command.
Although you can allow anyone to connect by using the
enable_attach(secret=None)command, this option isn't recommended.- When you attach the remote debugger, enter the secret with the
Create your connection target URL in the form
tcp://<secret>@<ip_address>:5678.tcp://specifies the connection type as TCP.<secret>is the string passed with theenable_attachfunction in the Python code.<ip_address>is the IP address of the remote computer, which can be an explicit address or a name like myvm.cloudapp.net.:5678is the remote debugging port number.
Secure connection with TCPS protocol
By default, the connection to the ptvsd 3.x remote debug server is secured by the secret only, and all data is passed in plain text. For a more secure connection, ptvsd 3.x supports SSL by using the secure form of the TCP protocol, or TCPS.
Use the following steps to configure ptvsd 3.x to work with the TCPS protocol:
On the remote computer, use the
opensslcommand to generate separate files for the key and the self-signed certificate:openssl req -new -x509 -days 365 -nodes -out cert.cer -keyout cert.key- At the
opensslprompt, enter the hostname or IP address that you use to connect for the Common Name.
For more information, see Self-signed certificates in the Python
sslmodule documentation. Note that the command described in the Python documentation generates only a single combined file.- At the
In the code, modify the call to the
enable_attachfunction to includecertfileandkeyfilearguments by using the filenames as the values. These arguments have the same meaning as for the standardssl.wrap_socketPython function.ptvsd.enable_attach(secret='my_secret', certfile='cert.cer', keyfile='cert.key')You can also make the same change in the code file on the local computer. Because this code isn't actually run, it isn't strictly necessary.
Restart the Python program on the remote computer so it's ready for debugging.
Secure the channel by adding the certificate to Trusted Root CA on the Windows computer with Visual Studio:
Copy the certificate file from the remote computer to the local computer.
Open Control Panel and go to Windows Tools > Manage computer certificates.
In the certlm [Certificates - local computer] dialog, expand the Trusted Root Certification Authorities node, right-click Certificates, and select All Tasks > Import.
Browse to and select the .cer file copied from the remote computer.
Continue through the dialog prompts to complete the import process.
Repeat the attach process in Visual Studio, as described earlier in Attach remotely from Python Tools.
For this instance, define
tcps://as the protocol for the Connection Target (or Qualifier).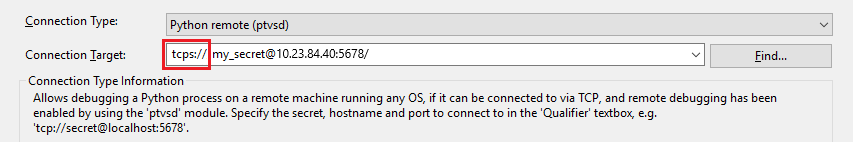

Address connection issues
During the connection attempt, Visual Studio might encounter issues. Review the following scenarios and take the appropriate action, as needed.
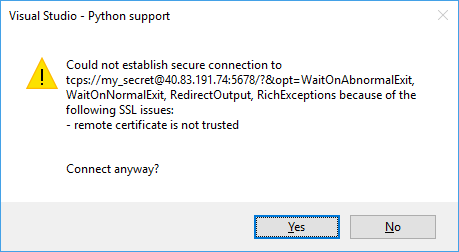
Visual Studio warns about potential certificate issues when connecting over SSL.
Action: You can ignore the message and proceed.
Caution
Keep in mind that although the channel is still encrypted against eavesdropping, it can be open to man-in-the-middle attacks.
Visual Studio displays the remote certificate is not trusted warning.
Issue: The certificate isn't properly added to the Trusted Root CA.
Action: Recheck the steps to add the certificate to Trusted Root CA on the Windows computer, and try the connection again.
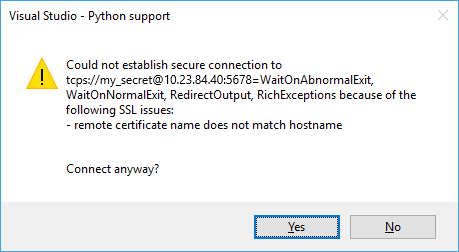
Visual Studio displays the remote certificate name does not match hostname warning.
Issue: The proper hostname or IP address isn't specified for the Common Name for the certificate.
Action: Recheck the steps in Secure the connection with TCPS. Be sure to use the correct Common Name when you create the certificate, and try the connection again.