Note
Access to this page requires authorization. You can try signing in or changing directories.
Access to this page requires authorization. You can try changing directories.
To determine what proportion of your project's code is being tested by coded tests such as unit tests, you can use the code coverage feature of Visual Studio. To effectively guard against bugs, your tests should exercise or 'cover' a large proportion of your code.
Code coverage analysis is possible for both managed (CLR) and unmanaged (native) code. Both static and dynamic instrumentation are supported. To use code coverage in command-line scenarios, use either vstest.console.exe or Microsoft.CodeCoverage.Console tool, which is an extension for dotnet-coverage that also supports native code.
Code coverage option is available under the Test menu when you run test methods using Test Explorer. The results table shows the percentage of the code executed in each assembly, class, and procedure. The source editor highlights the tested code. You can export the results in popular formats such as Cobertura.
Requirements
Note
Code coverage is available in Visual Studio Enterprise, Community, and Professional editions. In Visual Studio 2022 and previous versions, the code coverage feature was limited to Visual Studio Enterprise edition.
Note
Code coverage is available only with Visual Studio Enterprise. For .NET code coverage, you can alternatively use the command-line tool, dotnet-coverage.
Analyze code coverage
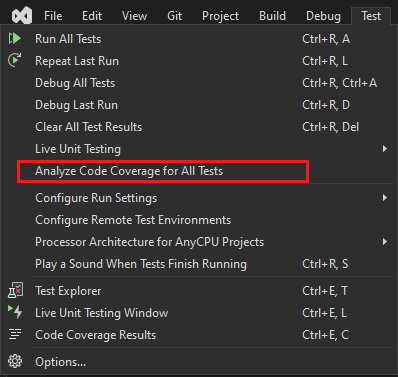
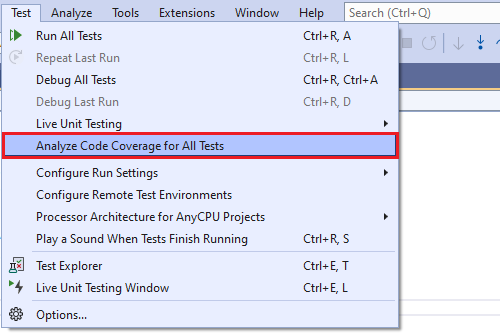
On the Test menu, select Analyze Code Coverage for All Tests.
Tip
You can also run code coverage from the Test Explorer tool window.
After the tests have run, to see which lines have been run, choose
 Show Code Coverage Coloring in the Code Coverage Results window. By default, code that is covered by tests is highlighted in light blue.
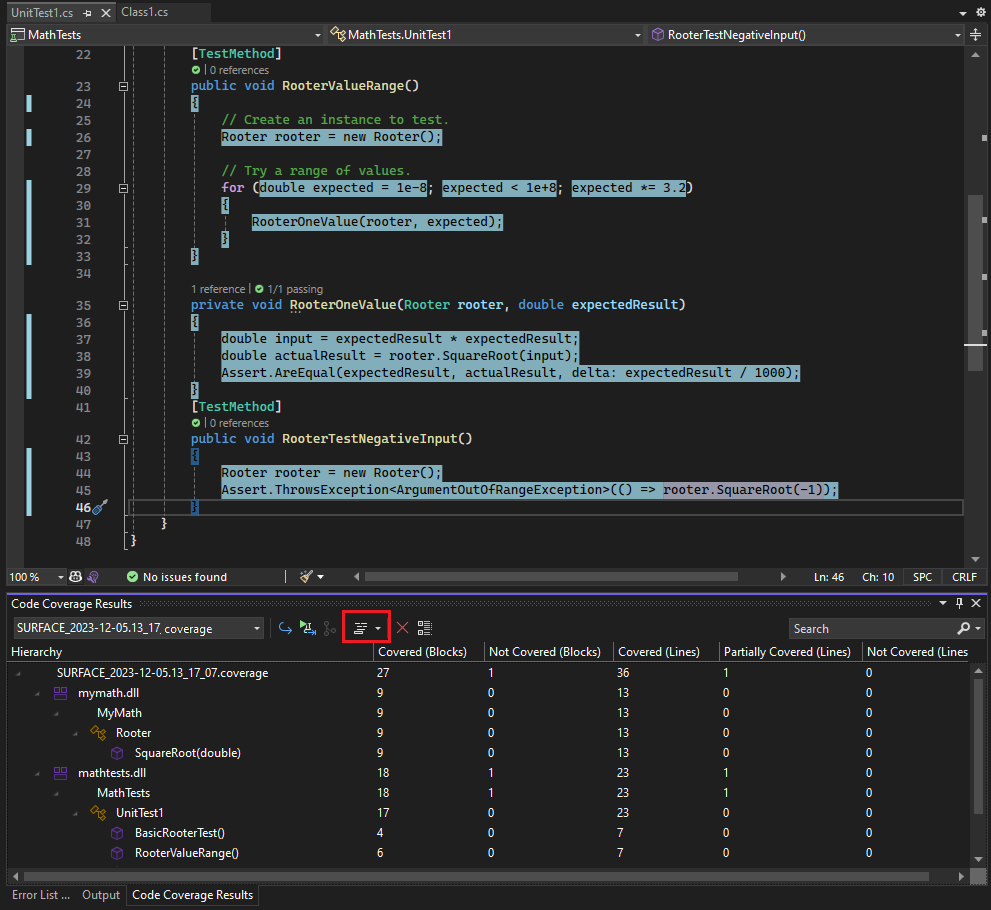
In the drop-down list for the Show Code Coverage Coloring option, you can select whether the coloring applies to lines of code, glyphs in the left margin, or both.
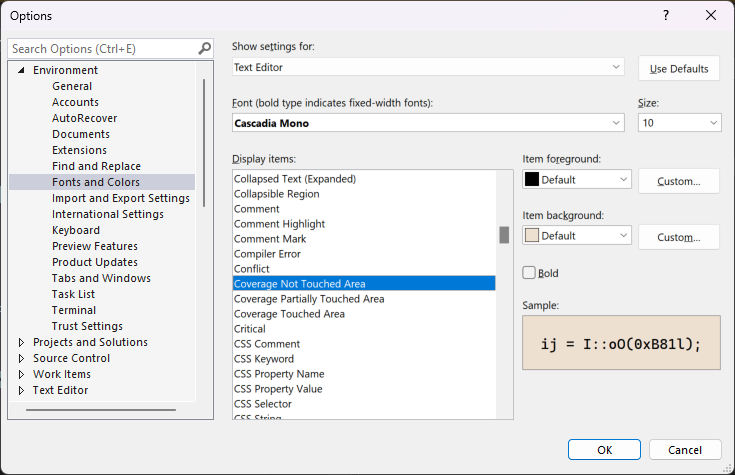
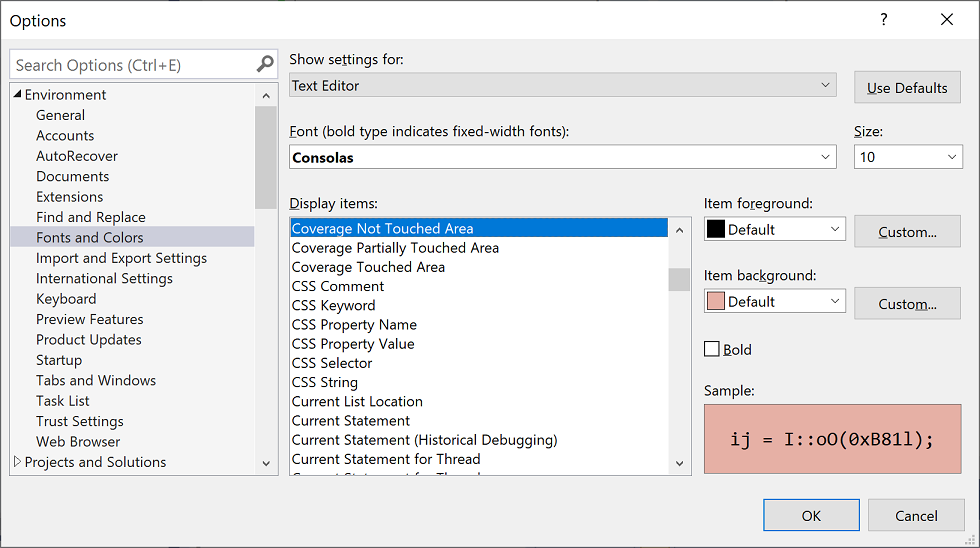
To change the colors or to use bold face, choose Tools > Options > Environment > Fonts and Colors > Show settings for: Text Editor. Under Display items, adjust settings for the "Coverage" items, for example, Coverage Not Touched Area.
If the results show low coverage, investigate which parts of the code aren't being exercised, and write more tests to cover them. Development teams typically aim for about 80% code coverage. In some situations, lower coverage is acceptable. For example, lower coverage is acceptable where some code is generated from a standard template.
Tip
To optimize code coverage:
- Turn compiler optimization off.
- If you're working with unmanaged (native) code, use a debug build.
- Generate .pdb (symbol) files for each assembly.
If you don't get the results you expect, see Troubleshoot code coverage.
Don't forget to run code coverage again after updating your code. Coverage results and code coloring aren't automatically updated after you modify your code or when you run tests.
Tip
Starting in Visual Studio 2022 version 17.2, you can enable latest code coverage features by selecting Tools > Options > Environment > Preview Features, then selecting Code coverage experience improvements, and then restarting Visual Studio.
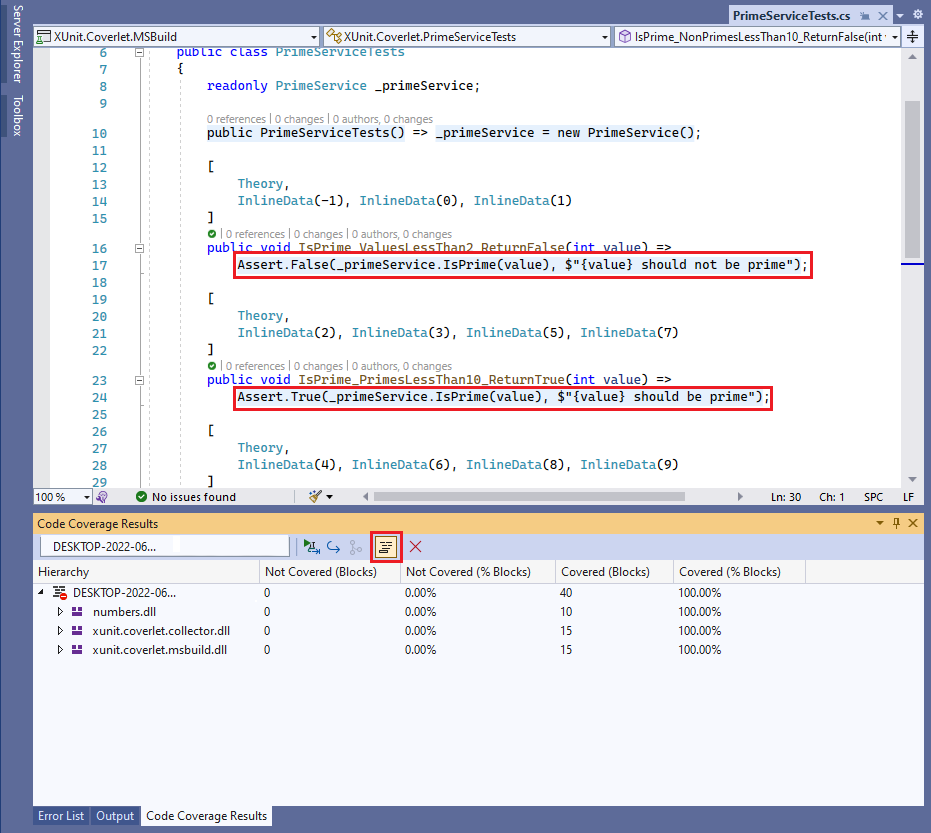
Report in blocks or lines
Code coverage is counted in blocks. Block is a part of code with exactly one entry and exit point. If the program's control flow passes through a block during a test run, that block is counted as covered. The number of times the block is used doesn't affect the result.
You can also have the results displayed for lines by choosing Add/Remove Columns in the table header. Some users prefer a count of lines because the percentages correspond more closely to the size of the fragments that you see in the source code. A long block of calculation would count as a single block even if it occupies many lines.
Tip
A line of code can contain more than one code block. If this is the case, and the test run exercises all the code blocks in the line, it is counted as one line. If some but not all code blocks in the line are exercised, it is counted as a partial line.
Code coverage results views
The Code Coverage Results window usually structures the report in the project/class/method hierarchy. You can change this to show the coverage on directory/file/method level.
- To view the source Report, select the Configure Code Coverage Views icon in the Code Coverage Results window. Then select Source View from the Report Style drop-down.
The Code Coverage Results window usually shows the result for the entire solution. The results can be filtered to show the results for only the files that have been updated in the current branch.
- To view the changeset Report, select the Configure Code Coverage Views icon in the Code Coverage Results window. Then select Changeset Report from the Report Content drop-down. Update the Active Repository and Base Branch to compare against for it to provide the comparison report.
From the search box in the Code Coverage Results window, there are several ways the report can be filtered.
- To Search by name (Show only those which matches search string in the window), enter the search string in the search box.
- To Filter by type enter the name of the type in the search box.
- To Show all clear the search box.
- To Show 100% fully covered, enter "Covered (%Lines)":"100" in the search box.
- To Show (>0% && < 100%) partially covered, enter "Partially Covered (%Lines)":"<##" replacing the ## with the percentage covered.
- To Show 0% covered, enter "Not Covered (%Lines)":"0" in the search box.
Manage code coverage results
The Code Coverage Results window usually shows the result of the most recent run. The results will vary if you change your test data, or if you run only some of your tests each time.
The Code Coverage Results window can also be used to view previous results, or results obtained on other computers.
You can merge the results of several runs, for example from runs that use different test data.
To view a previous set of results, select it from the drop-down menu. The menu shows a temporary list that is cleared when you open a new solution.
To view results from a previous session, choose Import Results, navigate to the TestResults folder in your solution, and import a .coverage file.
The coverage coloring might be incorrect if the source code has changed since the .coverage file was generated.
To make results readable as text, choose Export Results, select .xml as Save as type. This generates a readable .xml file, which you could process with other tools or send easily in mail. You can also select export formats such as Cobertura.
To send results to someone else, send either a .coverage file or an exported .xml file. They can then import the file. If they have the same version of the source code, they can see coverage coloring.
Merge results from different runs
In some situations, different blocks in your code will be used depending on the test data. Therefore, you might want to combine the results from different test runs.
For example, suppose that when you run a test with input "2", you find that 50% of a particular function is covered. When you run the test a second time with the input "-2", you see in the coverage coloring view that the other 50% of the function is covered. Now you merge the results from the two test runs, and the report and coverage coloring view shows that 100% of the function was covered.
Use  Merge Results to do this. You can choose any combination of recent runs or imported results. If you want to combine exported results, you must import them first.
Use Export Results to save the results of a merge operation.
Limitations in merging
If you merge coverage data from different versions of the code, the results are shown separately, but they aren't combined. To get fully combined results, use the same build of the code, changing only the test data.
If you merge a results file that has been exported and then imported, you can only view the results by lines, not by blocks. Use the Add/Remove Columns command to show the line data.
If you merge results from tests of an ASP.NET project, the results for the separate tests are displayed, but not combined. This behavior applies only to the ASP.NET artifacts themselves: results for any other assemblies will be combined.
Exclude elements from the code coverage results
You might want to exclude specific elements in your code from the coverage scores, for example if the code is generated from a text template. Add the System.Diagnostics.CodeAnalysis.ExcludeFromCodeCoverageAttribute attribute to any of the following code elements: class, struct, method, property, property setter or getter, event.
Tip
Excluding a class does not exclude its derived classes.
For example:
using System.Diagnostics.CodeAnalysis;
...
public class ExampleClass1
{
    [ExcludeFromCodeCoverage]
    void ExampleMethod() {...}

    [ExcludeFromCodeCoverage] // exclude property
    int ExampleProperty1
    { get {...} set{...}}

    int ExampleProperty2
    {
        get
        {
            ...
        }
        [ExcludeFromCodeCoverage] // exclude setter
        set
        {
            ...
        }
    }

}
[ExcludeFromCodeCoverage]
class ExampleClass2 { ... }
Use the following macros:
ExcludeFromCodeCoverage( ExclusionName , L" FunctionName ");
ExcludeSourceFromCodeCoverage( ExclusionName , L" SourceFilePath ");
ExclusionName is any unique name.
FunctionName is a fully qualified function name. It may contain wildcards. For example, to exclude all the functions of a class, write
MyNamespace::MyClass::*SourceFilePath is the local or UNC path of a .cpp file. It may contain wildcards. The following example excludes all files in a particular directory:
\\MyComputer\Source\UnitTests\*.cpp#include <CodeCoverage\CodeCoverage.h>Place calls to the exclusion macros in the global namespace, not within any namespace or class.
You can place the exclusions either in the unit test code file or the application code file.
The exclusions must be compiled as unmanaged (native) code, either by setting the compiler option or by using
#pragma managed(off).
Note
To exclude functions in C++/CLI code, apply the attribute [System::Diagnostics::CodeAnalysis::ExcludeFromCodeCoverage] to the function. This is the same as for C#.
Include or exclude additional elements
Code coverage analysis is performed only on assemblies that are loaded and for which a .pdb file is available in the same directory as the .dll or .exe file. Therefore in some circumstances, you can extend the set of assemblies that is included by getting copies of the appropriate .pdb files.
You can exercise more control over which assemblies and elements are selected for code coverage analysis by writing a .runsettings file. For example, you can exclude assemblies of particular kinds without having to add attributes to their classes. For more information, see Customize code coverage analysis.
Analyze code coverage in Azure Pipelines
When you check in your code, your tests run on the build server along with tests from other team members. It's useful to analyze code coverage in Azure Pipelines to get the most up-to-date and comprehensive picture of coverage in the whole project. Code coverage in Azure Pipelines also includes automated system tests and other coded tests that you don't usually run on the development machines.
Analyze code coverage from the command line
To run tests from the command line, use vstest.console.exe utility. Code coverage is an option of the vstest.console.exe utility invoked by /EnableCodeCoverage option.
Launch the Developer Command Prompt for Visual Studio:
In the Windows Start menu, search
Developer Command Prompt for VSand select the App result that's associated with your search text.At the command prompt, run the following command:
vstest.console.exe MyTestAssembly.dll /EnableCodeCoverageTip
For Developer PowerShell, the starting directory of the shell is the Visual Studio Project Location. Replace MyTestAssembly.dll with path and test file name. For more information, see VSTest.Console.exe command-line options.
Troubleshoot
If you don't see code coverage results, the Troubleshoot code coverage article might help you.