Note
Access to this page requires authorization. You can try signing in or changing directories.
Access to this page requires authorization. You can try changing directories.
Use these definitions to get the most useful information from your Microsoft Viva Glint reports.
| Features | Definition |
|---|---|
| Key Outcome | The main result of the survey. It can be the score from a single item or an aggregate index. This number is the most prominently displayed score in most reports. |
| Engagement score | The key outcome for an Engagement survey. The Engagement Score is calculated by computing the average score, typically for eSat (Employee Satisfaction) - or eSat and Recommend. The Engagement Score has the highest correlation with engagement drivers, along with outcomes like productivity and retention. The overall Engagement score helps managers understand how happy their team is at work. |
| Item, also referred to as Question or Driver |
Any question or statement posed to a survey participant. An item that typically impacts sentiment connected to the Key Outcome. For example, Recognition is a Driver that commonly impacts how employees feel about eSat (Key Outcome). Drivers provide more data related to other motivators. |
| Mean score | The average for all items provided in a survey, converted into a 100-point scale. |
| Favorability | Provides the distribution of responses. It’s useful to know if there's a strong consistency in responses or if the score is a result of a wide and divided range of opinions. |
| Filter | A fixed panel across all reports in the Glint Reports section. Reports can be filtered for further deeper interpretation. |
| Impact | The correlation between a survey item and the Key Outcome. |
The Mean scores and Favorability scores in survey results
As the primary metric, the Mean score is transformed to a 100-point scale. This metric is a more accurate, reliable, and robust measure compared to the percent favorable, especially for smaller teams. Microsoft People Science recommends using the Average or Mean score over the Favorability score.
Viva Glint reports the Average score (transformed to a 100-point scale) and Favorability scores (favorable, neutral, and unfavorable) for four metrics for each rating-type item. Leaders and managers can drill down to see all metrics for each group or subpopulation that meets the permissions and confidentiality thresholds set by your company.
When leaders review results for smaller populations, or look at trends between surveys, the Mean score metric doesn't have measurement challenges posed by the Percent Favorable metric. For smaller groups, the Percent Favorable metric can vary significantly without any real difference in sentiment and can be misleading. Percent Favorable scores don't capture differences in scores from neutral to unfavorable, an important detection.
Use the Mean score over the Favorability score
Mean - or Average - scores are:
- Robust and meaningful to track over time, even for small teams.
- Correlated with behavioral and business outcomes.
- Consistent with other analysis performed.
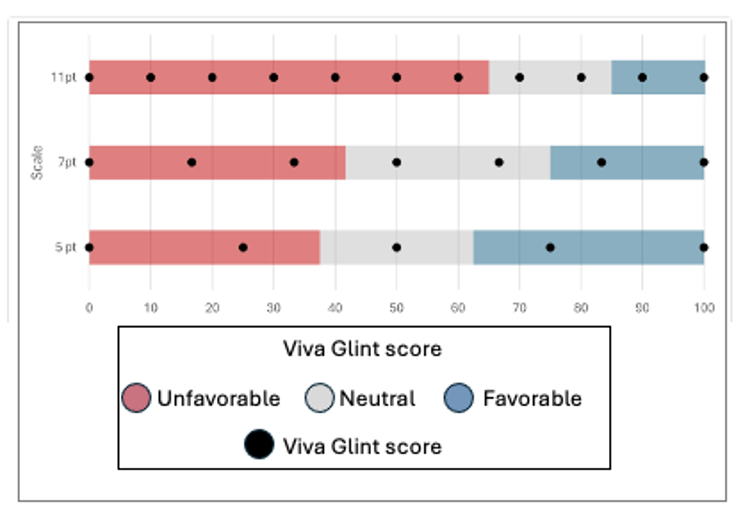
Visual comparison of 5-, 7-, and 11-point rating scales
Why the Favorability score is useful
Leaders can identify where to take targeted action by knowing the distribution of favorable, neutral, and unfavorable scores. For example, a manager may decide to make efforts to convert unfavorable scores to neutral or favorable. Or they might focus on getting the neutrals over the fence to favorable.
When a score increases or decreases, it’s useful to know where the increase or decrease came from. Reviewing how the Favorability distribution changed lets managers know where movement occurred. Is there a pattern to the responses? Are the respondents polarized with equal number of responses in the Favorable and Unfavorable buckets?
Favorability scoring helps to understand the spread and variability of responses, but there are drawbacks:
- The mean score isn't shown.
- External benchmarks aren't available.
- Calculations to measure engagement and other areas of sentiment are based on the mean score, not favorability.
- Percent favorability is prone to error and instability in smaller teams.
- The mean score is the better statistical predictor for behavioral and business outcomes.
- Percent favorability isn't consistent with other analyses.
- Percent favorability only shows respondents who agree with the statement. Neutral or unfavorable scores aren’t provided.
- Percent favorability doesn't reflect changes in scores over time.
Switch to percent favorable calculation
Go to Configuration and select General settings in Service configuration.
In Reporting, go to Calculation method for rating question scores.
Select Percent favorable in the dropdown menu.
When External benchmarks are enabled, a confirmation dialog appears:
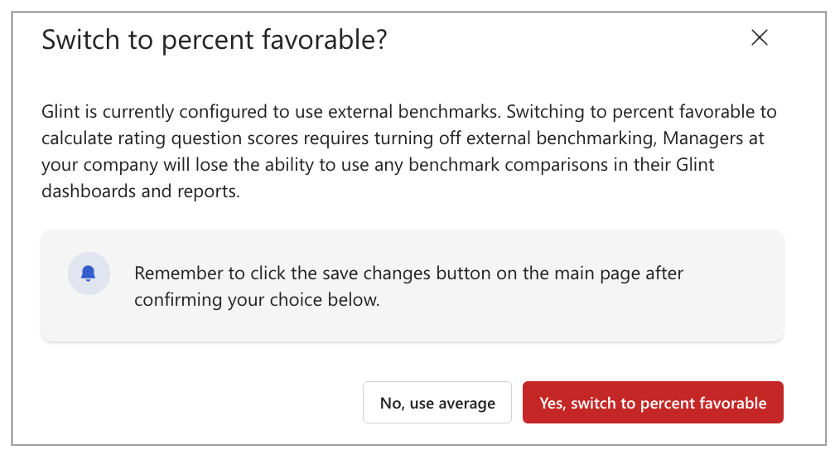
Caution
Switching to percent favorable as a calculation method disables external benchmarks, which use average score calculation. Users lose external benchmark comparisons in dashboards and reports.
Select Yes, switch to percent favorable.
Select Save changes at the top of the General settings page.
Favorability rating scale point interpretation guide
| Rating scale points | Favorable | Neutral | Unfavorable |
|---|---|---|---|
| 2 | 2 | 1 | |
| 3 | 3 | 2 | 1 |
| 4 | 4 | 2, 3 | 1 |
| 5 | 4, 5 | 3 | 1, 2 |
| 6 | 4, 5, 6 | 1, 2, 3 | |
| 7 | 6, 7 | 4, 5 | 1, 2, 3 |
| 8 | 6, 7, 8 | 4, 5 | 1, 2, 3 |
| 9 | 7, 8, 9 | 4, 5, 6 | 1, 2, 3 |
| 10 | 8, 9, 10 | 4, 5, 6, 7 | 1, 2, 3 |
| 11 | 10, 11 | 8, 9 | 1, 2, 3, 4, 5, 6, 7 |