Note
Access to this page requires authorization. You can try signing in or changing directories.
Access to this page requires authorization. You can try changing directories.
Successful employees and teams use collaboration networks to get work done effectively. Measuring descriptive information about these networks tells you how well employees can access their network’s resources. When you select Collaboration between individuals to run a person-to-person query, you’ll analyze how strongly and diversely employees collaborate with others in your organization.
About strong and diverse ties
Some network connections represent significantly closer collaboration than a reciprocal interaction. When a network connection represents more frequent collaboration time compared to other reciprocal interactions, Viva Insights classifies it as either a strong tie or as a diverse tie.
The difference between strong ties and diverse ties is determined by how many other network connections the two individuals have in common.
If two people have had a reciprocal interaction in the last four weeks, and also have many network connections in common, Viva Insights considers their connection a strong tie. Strong ties typically indicate that people work in the same group or team. Groups of employees with many strong ties are usually highly cohesive units.
If two people have had a reciprocal interaction in the last four weeks, and also have few network connections in common, Viva Insights considers their connection a diverse tie. Although these two people work closely with each other, they don’t typically operate in the same circles. Groups of employees with many diverse ties often have high innovative potential, because they’re exposed to lots of information outside of their shared context.
How to run a person-to-person query
Set up your query
- In the Viva Insights web app's Create analysis page, go to the Create custom query section, find Cross-collaboration query, and select Set up analysis.
- Name your query (optional). Queries are assigned a default name, which follows this format: "CrossCollaborationQuery," user ID, date, and time. Make sure the name is unique.
- Select a Time period (optional). This field defaults to Last 3 months, but you can select another. Pick from Last 1 year, Last 6 months, Last 1 month, or a Custom date range. If you choose a Custom date range, use the date picker to select the range.
- Optional: Set the query to automatically update by selecting the auto-refresh box. When you turn on the auto-refresh option, your query automatically runs and computes a new result every month. This option is turned off by default, but you can use it on any query where the Time period isn’t customized.
- Optional: Type a Description.
- Optional: To change which metric rule your query uses, select More Settings beneath the Description box. To find out more about each rule, select View rule.
Add metrics, filters, and employee attributes
- Under Add metrics, select the Add metrics button, then pick metrics from the Select metrics pane. For person-to-person queries, you’ll choose from network person-to-person metrics, which are:
- Diverse tie score
- Diverse tie type
- Strong tie score
- Strong tie type
Learn the metric definitions. When you're done picking metrics, select Add to query.
Under Select filters, select which employees you want your query to apply to. You’ll need to set two filters here: one for your primary collaborators—that is, those whose collaboration patterns are at the center of your analysis—and the other your secondary collaborators—that is, those who work with your primary collaborators.
Tip
Need more information about collaborators? Learn about primary and secondary collaborators, and how to choose them, here.
Under Organizational data, select the attributes—or descriptive pieces of information about employees—that you want to appear in the results along with the metrics you picked in step 1. You can use these attributes to further summarize your results—for example, create analyses that compare and contrast the collaboration of different groups in your organization.
Run your query
After you’ve set up your query, you’re ready to run it. In the screen’s upper right, select Run.
About query results
How to access your results
After you run your query, go to the Analysis results page to check your query’s status. When your query is ready, a green checkmark appears under the Status column.
To download your results as a .csv file, select the CSV icon under the Downloads column.
What your results show
Your query results show the quality of the relationship between two specific, but de-identified, people. Each row shows information for a pair of people who had a strong or diverse tie during query’s time period.
Here’s how columns will appear in your results file:
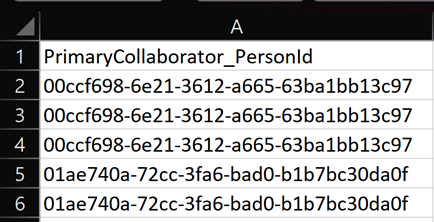
The first column identifies the primary collaborator in the pair by providing a de-identified ID number. This column appears automatically and is titled PrimaryCollaborator_PersonId.
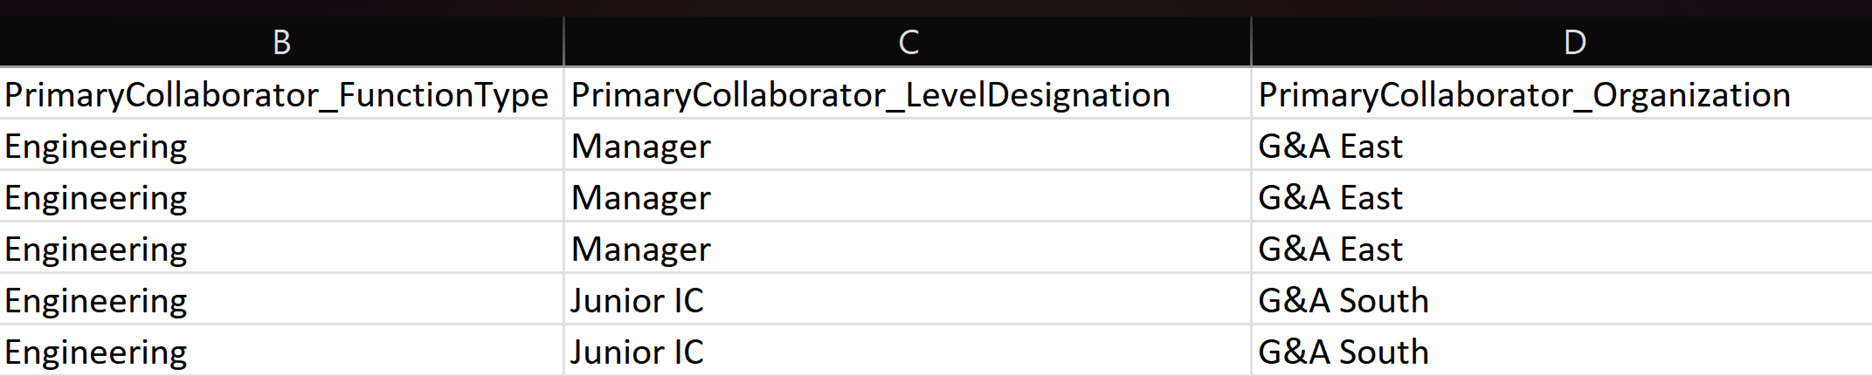
The next columns describe the primary collaborator. The column names for these attributes are the organizational attributes you selected while you built the query, with the prefix PrimaryCollaborator_. In the graphic below, the analyst selected FunctionType, LevelDesignation, and Organization as their attributes:
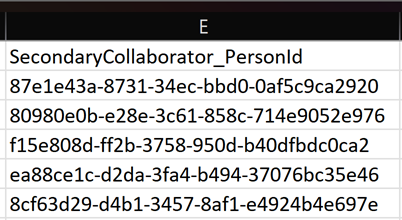
The following column identifies the secondary collaborator in the pair. Like the first column in the file, this column appears automatically, is titled SecondaryCollaborator_PersonId, and provides a de-identified ID number to represent the secondary collaborator.
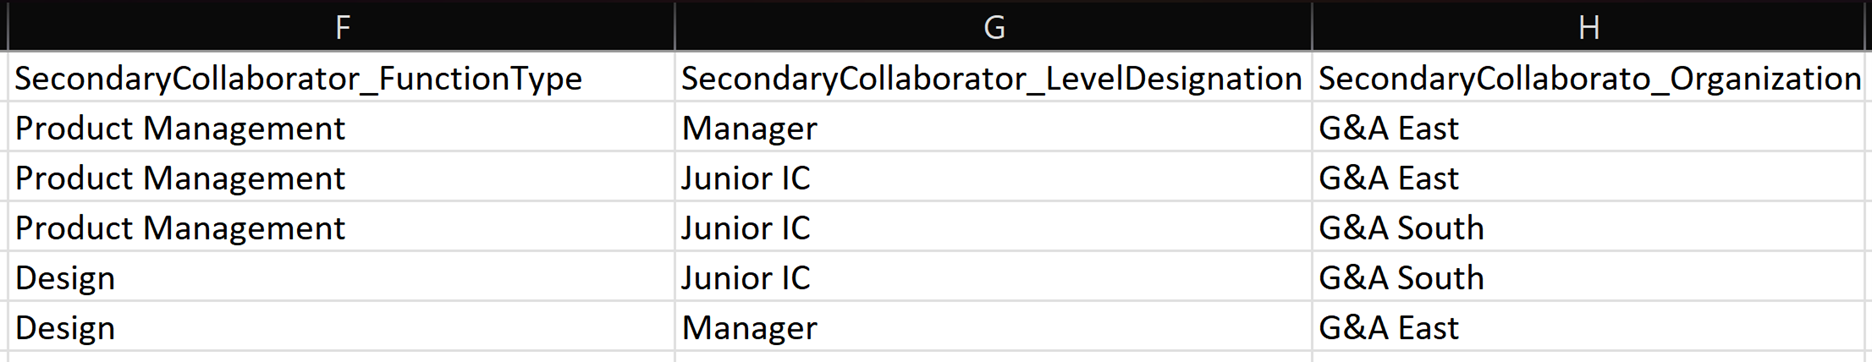
Like for primary collaborators, the next columns describe the secondary collaborator by providing the attributes you picked earlier. The columns include the attribute names, with the prefix SecondaryCollaborator_. Here’s how these columns would appear if the analyst selected FunctionType, LevelDesignation, and Organization as their attributes:
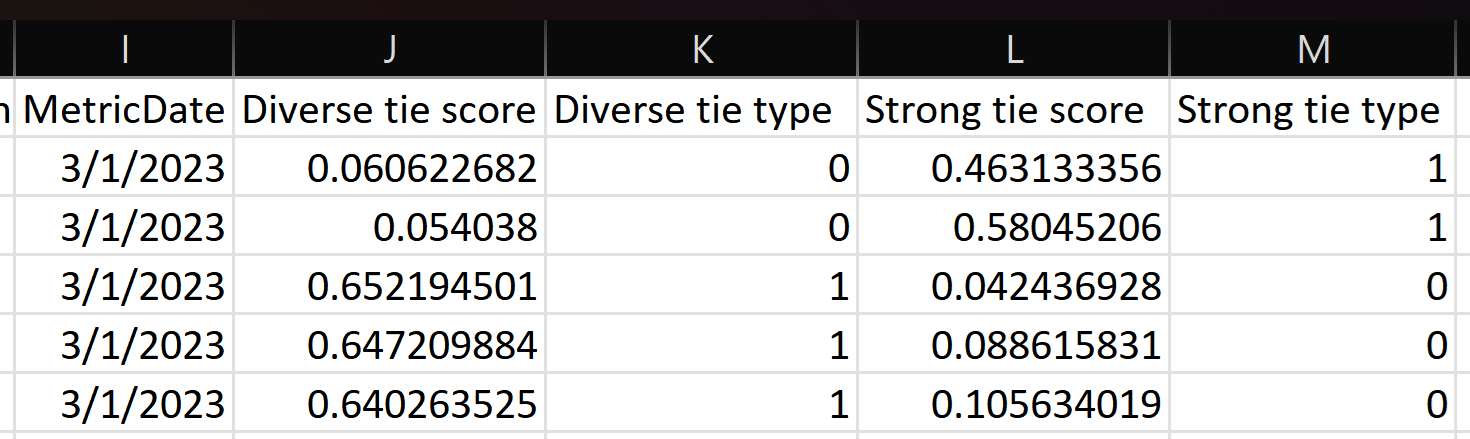
The last columns in the file give you the metric date and results—that is, scores and types—for the metrics you selected. The MetricDate column shows the start date of the aggregated output. This date will be the first day of the month that your data covers. The following columns show values for the metrics you added when you built the query.