Note
Access to this page requires authorization. You can try signing in or changing directories.
Access to this page requires authorization. You can try changing directories.
Important
This feature is for public preview customers only. Features in preview might not be complete and could undergo changes before becoming available in the broader release. This preview feature allows personal data processing. See the "Previews" section of the Microsoft Products and Services Data Protection Addendum for more information.
The Microsoft Copilot latest usage snapshot report provides a broad analysis of how Microsoft Copilot is being adopted throughout your organization, as shown on the Adoption overview page. Unlike the Microsoft Copilot adoption report, this report's insights let you track more recent Copilot usage with the freshest data that's up to two to three days prior to the current date, and identify short-term patterns around how employees are using Copilot at a daily level.
At the top of each reporting page, you can use filters to narrow down information or organize data by any organizational attribute. The interactive charts let you filter or cross-highlight details across different visuals for deeper insights.
Prerequisites
Before you can run the queries and populate the report in Power BI, you'll need to:
- Be assigned the role of Insights Analyst in Viva Insights.
- Have Power BI Desktop installed. Use a current version of Power BI Desktop. If you have an earlier version installed, uninstall it before installing the newer version. Then go to Get Power BI Desktop to download and install the latest version.
- Have licenses assigned to the employees you would like to include as part of your measured population: Microsoft Copilot licenses or Microsoft Viva Insights licenses.
Report setup
For detailed scenario-based guidance on how to set up an analysis tailored to your organization, refer to our analyst toolkit playbook.
Run query
In the Viva Insights analyst experience, select Create analysis.
Under Templates, navigate to Microsoft Copilot latest usage snapshot and select Set up analysis. The template can also be found underneath the Copilot section.
Under Query setup:
Type a Query name.
Select a Time period. This field defaults to Last 3 months, but you can select another time period you want your query to analyze. Pick from Last 1 month, Last 3 months, or a Custom date range. If you choose a Custom date range, use the date picker to select the range. You can't select a range that captures data for a period that's longer than three months.
Data availability and freshness
Copilot metrics are available for up to three months of historical data.
The data freshness for Copilot metrics is shown on the card for this report in the Viva Insights web app. The date provided, such as in the example below, identifies the most recent date for which Copilot metrics are available in the report.
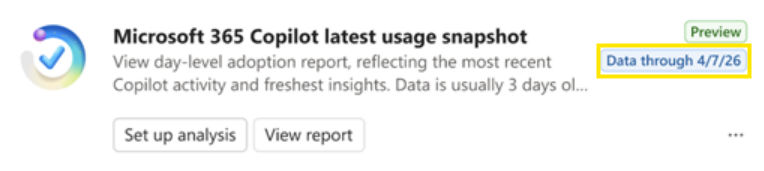
The most recent Copilot data is available up to two to three days before the current date.
Set Auto-refresh (optional). You can set the query to automatically update by checking the Auto-refresh box. When you select the Auto-refresh option, your query automatically runs and computes a new result every time Viva Insights gets updated Copilot data for licensed people.
Note
If organizational data used in an auto-refreshing query changes (for example, an attribute name is altered or an attribute is removed), the query might stop auto-refreshing.
Type a Description (optional).
Change the metric rule (optional). To set a new metric rule, select More settings. Then, pick a new rule from the list. Learn more about metric rules.
Note
The More settings pane also contains Group by settings. Power BI queries are set to Group by Week, and you're not able to edit this field.
Under Predefined template metrics, view a list of preselected metrics, which appear as gray tags. These metrics are required to set up the Power BI report and you can’t remove them. However, you can add other metrics by selecting Add metrics. Learn about the availability of data for Copilot metrics.
The following metrics can't be used for this report:
- Meeting hours recapped by Copilot
- Meeting hours summarized by Copilot in Teams
- Meeting hours recapped by Copilot
- Total meeting hours summarized or recapped by Copilot
- Total meetings summarized or recapped by Copilot
- Copilot assisted hours
- All Copilot for Sales metrics
- Any metrics related to power users
- Any collaboration metrics
Important
Low-quality or missing organizational data might affect your metrics and result in warnings or errors. Learn more about data quality notifications.
In Select which employees you want to include in the query, add filters to narrow down the employees in scope for your report. Learn more about filter and metric options. If you notice a warning or error here, it's because one of your attributes is missing from your organizational data or it's of low quality. You can't use the "Is Active" filter when analyzing Copilot metrics.
Under Select which employee attributes you want to include in the query, add up to 20 organizational attributes. Once the query runs, you can use these attributes to group and filter the reports.
Important
This Power BI query needs some specific attributes to run, and we've preselected them for you. These attributes appear in gray and you can't remove them. We might also include some attributes that help your template, but aren't required for your query to run. These attributes appear in blue and you can remove them.
If you notice attributes marked with yellow warnings, that attribute's quality is low. If you notice attributes marked in red and the query's Run button disabled, then your organizational data is missing that attribute.
Select Run on the upper right. The query might take a few minutes to run.
Link report to query
Open the downloaded template.
If you're prompted to select a program, select Power BI.
When you're prompted by Power BI:
- Paste in the partition and query identifiers.
- Set the Minimum group size for data aggregation within this report's visualizations in accordance with your company's policy for viewing Viva Insights data.
- Select Load to import the query results into Power BI.
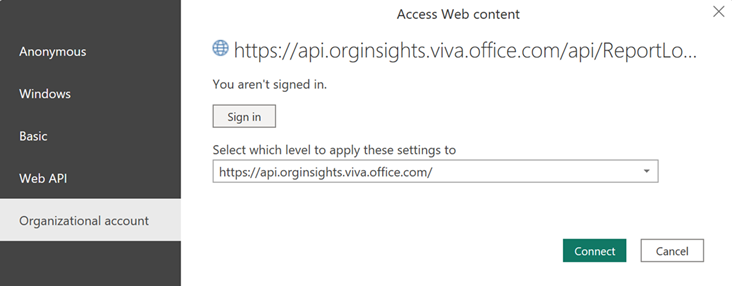
If prompted by Power BI, sign in using your organizational account. Power BI then loads and prepares the data. For large files, this process might take a few minutes.
Important
You need to sign in to Power BI with the same account you use to access Viva Insights. If available, select Organizational account from the left. You might have to sign in more than once.
Report settings
Settings page
View and set the following parameters on the Settings page. You can find Settings on the right panel of the introduction page. You can also adjust the report settings as you go through the report pages through the Settings icon.
Time period for the report – Select the time period for which you want to view data in the report.
Activity interval - Select the time period by which you'd like to aggregate the data: Daily, weekly, or monthly. Daily is the default, which means the metrics represent daily measures, such as average daily user.
Group by – Select the primary group-by attribute shown in all the report pages. You can change this attribute at any time and all report pages will show group values by the new attribute.
Apply filters (optional) – Select the organizational attribute and values you want to use to filter the employees shown in this report.
Customize active Copilot user definition – Customize the usage frequency for active Copilot users. You can choose between:
- At least one active day in the selected time period
- At least one active day per four weeks
- At least one active day per week
A day is marked as active if the user took at least one action with Copilot on that respective day.
Report language – Change the language for your report.
About this report
The Microsoft Copilot latest usage snapshot report helps leaders understand daily Copilot usage across their organization. The insights can help accelerate Copilot adoption and help employees transform their work with Copilot.
The report is organized into the following sections (pages):
- Adoption overview
- Glossary
1. Adoption overview
Use the Adoption overview page to get a quick, org-wide snapshot of Copilot adoption across the organization. This page helps you understand:
- Adoption level and trends
- Adoption by group
- Adoption by app and feature
From here, you can use slicers and filters (such as organizational attributes and time) to narrow the view, and then go to the deeper-dive pages to understand where adoption is strongest and identify opportunities to boost Copilot adoption and impact.
Copilot adoption trend across groups
Use this section to track adoption trends over time and identify inflection points. It helps you answer questions such as:
- How are active Copilot users trending day by day within the selected time period?
- Is growth broad-based across the organization or driven by specific groups?
- Are there sustained increases after enablement efforts (training, campaigns, champion programs)?
- How does growth in usage vary by Microsoft 365 app?
Use the benchmark selector to compare your organization to the top 25 percent of similar companies by size, industry, and region. Benchmarks for the percentage of active Copilot users are only available when the Activity interval filter is set to Weekly. Some metrics might not be available when viewing data by individual Microsoft 365 apps. Learn more about benchmarks.
Copilot adoption by group
Use this page to compare usage across groups, and quickly identify where adoption is ahead (or lagging). It helps you answer questions such as:
- Which groups have the highest (or lowest) percentage of active Copilot users?
- Which groups are generating the most Copilot actions per active user?
- Where should we focus change management efforts to increase adoption?
Copilot adoption by app and feature
Use this page to understand how Copilot usage varies across Microsoft 365 apps and experiences. It helps you answer questions such as:
- Which apps see the most Copilot usage in the organization?
- What are the most frequently used Copilot features in each app?
- Are employees using Copilot for quick wins (for example, summarization) or more advanced workflows?
- Where can we provide targeted guidance to increase usage intensity?
This view helps leaders tailor training and communications based on where people are already using Copilot, such as focusing enablement on apps and features with high potential but low usage.
2. Glossary
View this report's metric definitions.
Power BI tips, FAQs, and troubleshooting
Learn more about how to share the report and other Power BI tips, troubleshoot any issues, or review the FAQ.