Note
Access to this page requires authorization. You can try signing in or changing directories.
Access to this page requires authorization. You can try changing directories.
The Recurring meeting audit Power BI report uses a template populated by Viva Insights data to help you understand whether expensive large and long recurring meetings in your organization are worth their cost.
Use this report to:
- Examine the quality of your most expensive recurring meetings.
- Learn about actions you can take to improve or remove these costly meetings.
The report includes recommended actions and metric definitions.
To populate the report in Power BI, you’ll need to set up and successfully run the predefined Recurring meeting audit query in Viva Insights.
Demonstration
The following demonstration uses sample data that’s only representative of this report and might not be exactly what you see in a live report specific to your organization's unique data.
Prerequisites
Before you can run the queries and populate the report in Power BI, you’ll need to:
- Be assigned the role of Insights Analyst in Viva Insights.
- Have the December 2022 (or newer) version of Power BI Desktop installed. If you have an earlier version of Power BI installed, uninstall it before installing the new version. Then go to Get Power BI Desktop to download and install the latest version.
Report setup
Run query
- In the Viva Insights analyst experience, select Create analysis.
- Under Power BI templates, navigate to Recurring meeting audit and select Set up analysis.
Under Query setup:
- Type a Query name.
- Select a Time period. Time period defaults to Last 3 months.
- Set Auto-refresh (optional). You can set the query to automatically update by checking the Auto-refresh box. When you select the Auto-refresh option, your query automatically runs and computes a new result every time Viva Insights gets updated collaboration data for licensed people.
Note
If organizational data used in an auto-refreshing query changes (for example, an attribute name is altered or an attribute is removed), the query might stop auto-refreshing.
- Type a Description (optional).
- Change the metric rule (optional). To set a new metric rule, select More settings. Then, pick a new rule from the list. For more information about metric rules, refer to Metric rules.
Note
The More settings pane also contains Group by settings. Power BI queries are set to Group by Week, and you're not able to edit this field.
Under Predefined template metrics, view the list of preselected metrics, which appear as gray tags. These metrics are required to set up the Power BI report and you can’t remove them. You can add other metrics by selecting Add metrics. Including the preselected ones, you can have up to seven metrics in your query.
Important
Low-quality or missing organizational data might affect your metrics and result in warnings or errors. Learn more about data-quality notifications in Data quality in the analyst experience.
In Select which employees you want to include in the query, add filters to narrow down the employees in scope for your report. Don’t remove any predefined filters we've added here. For more details about filter and metric options, refer to Filters. If you notice attributes marked with yellow warnings, that attribute's quality is low. If you notice attributes marked in red and the query's Run button disabled, then your organizational data is missing that attribute. Learn more about attributes and data quality in Data quality in the analyst experience.
Under Select which employee attributes you want to include in the query, add up to seven organizational attributes. Once the query runs, you can use these attributes to group and filter the reports.
Important
Some employee attributes are required to set up this Power BI template, and we've preselected them for you in the query. You can't remove these preselected attributes.
If you notice attributes marked in red and the query’s Run button disabled, it means that these attributes are required and they're missing from your organizational data. Contact your admin to upload them.
The Subject attribute might show a warning if your organization is suppressing all email subject lines and meeting titles. You'll still be able to run the query and set up the template with this warning, but you won't be able to see meeting titles in your report. Contact your Insights Administrator if you need to view meeting titles.
Select Run on the upper right side of the screen. The query might take a few minutes to run.
When your query results are ready, go to the Query results page and select the Power BI icon. Download the Power BI template and get the partition and query identifiers. You’ll need these identifiers later.
Link report to query
- Open the downloaded template.
- If you're prompted to select a program, select Power BI.
- When you're prompted by Power BI:
- Paste in the partition and query identifiers.
- Set the Minimum group size for data aggregation within this report's visualizations in accordance with your company's policy for viewing Viva Insights data.
- Select Load to import the query results into Power BI.
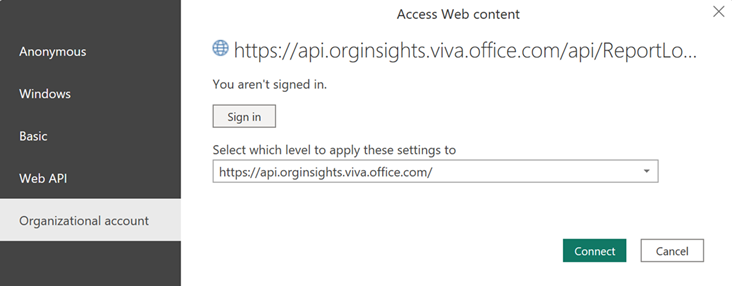
- If prompted by Power BI, sign in using your organizational account. Power BI then loads and prepares the data. For large files, this process might take a few minutes.
Important
You need to sign in to Power BI with the same account you use to access Viva Insights. If available, select Organizational account from the left. You might have to sign in more than once.
About report settings
After the Recurring meeting audit report is set up and populated with Viva Insights data in Power BI, you can view and set certain parameters within each page. We talk about specific settings in About the report below. For a full list of settings and what they do, jump to the Reference section.
About the report
Overview
Which groups are scheduling the greatest meeting load?
Use this page to view groups in your company, and:
- The number of meetings those groups are scheduling.
- The average attendance and duration of those meetings.
- The total cost of those meetings, and how that cost is changing over time.
After you’ve taken a look at all groups, use the information on this page to investigate which groups contribute most to overall meeting cost, or those who have large average attendances or durations. It’s helpful to view the biggest contributors to overall meeting cost. However, it might also be worthwhile to identify groups with lower overall cost but a tendency to schedule large and lengthy meetings.
Note
To change the date range of this report, use the Start and end date field. This field is the first filter from the right at the top of the page.
Pick a few groups you want to learn more about. You’ll learn more on the next page, Meeting view.
Meeting view
What recurring meeting series do we need to make more lean?
Use this page to filter the groups you identified on the Overview page. For example, if you wanted to learn more about recurring meetings in the Marketing organization, you’d set the Filter value dropdown to “Marketing.” When you set this filter, you’ll get a list of the meetings that group scheduled. The list shows the most expensive meeting series, sorted by cost.
Note
The default value for the Filter by scheduler’s dropdown is “Organization.” To filter by other organizational attributes—that is, pieces of descriptive information about the meeting scheduler—you’d need to add those attributes in while you’re building your query. Refer to step 6 above.
After you set your filters, explore quality and quantity metrics for each meeting series. All metrics, except meeting count and cost, are averages of meetings that happen between the Start and end date.
When you hover over Scheduler, you'll see organizational attributes of the individual who scheduled the meeting, but not who that individual is. This information can help you contact the scheduling organization so you can make changes to the meeting series or provide recommendations about it.
About blank or "unknown" values
The Meeting series title field might be blank if your organization is suppressing all email subject lines and meeting titles. If Meeting series title is blank, you can still see other fields, like Scheduler and associated metrics. Contact your Insights Administrator if you need to view Meeting series title.
If "Unknown" appears as the Scheduler, the scheduler has no organizational attributes. This might be because the organizational data file your admin uploaded has incomplete data, or the scheduler doesn't have a Viva Insights license.
Take action
Find opportunity areas for your organization. This page includes best practices, recommendations, and links to related articles about ways to reclaim time by modifying how these expensive meetings are organized.
Glossary
View the definitions of various concepts in the report.
Reference
Report settings
To find the Settings page, select the Settings link in the top-right corner of any report page. In Settings, you can make changes to the following parameters:
| Setting name(s) | Description |
|---|---|
| Select the report’s start and end date | Use the calendar picker to set your report’s date range. Your report will only include meetings that occur after the start date and before the end date. |
| View report by scheduler’s... | The default value is “Organization,” so all report pages will group by the scheduler’s organization. To group by other organizational attributes—that is, pieces of descriptive information about the meeting scheduler—you’d need to add them while you’re building your query. Refer to step 6 in Run query. |
|
Set filters to exclude or include meetings based on certain attributes of the meeting scheduler. For example, if you only want to view meetings scheduled by people in the Sales organization, you’d set Filter by scheduler’s to “Organization” and Filter value to “Sales.” If you use these filters, you’ll notice the measured meetings count—located on the page’s right—reflects a reduced number. |
| Average cost of employee hour | Set the average cost of an employee hour. The default value is 75, but you can set it from 0 – 1,000 to calculate a more accurate value for meeting hours across the report. |
|
Filter which meetings appear in your report by setting average duration and attendance. The report gets these averages from all instances of a recurring meeting that happened between the two dates you set earlier. For example, if you only want your report to include meetings between 30 minutes and 60 minutes on average, you’d set the low end of the slider to “30” and the high end of the slider to “60.“ Similarly, if you only want your report to include meetings with between 2 and 10 people, you’d set the low end of the slider to “2” and the high end of the slider to “10.” |
| Search meeting series name | Filter which meetings appear in your report based on a keyword in their titles. For example, if you only want to include meetings that have “monthly” in the title, you’d add “monthly” as a keyword in the search bar here. If the meeting organizer modifies the title, the report uses the most recent title for the meeting series name. The report allows one keyword at a time. |
| Don’t include in the report | Select the check box to leave out meetings that are probably blocks on people’s calendars. These blocks might be no-meeting days or similar events where people accept the invitation, but no one joined the meeting on Teams for the entire series. Deselect this box to include all meetings. |
Power BI tips, FAQs, and troubleshooting
For details about how to share the report and other Power BI tips, troubleshoot any issues, or review the FAQ, see Power BI tips, FAQ, and troubleshooting.