Note
Access to this page requires authorization. You can try signing in or changing directories.
Access to this page requires authorization. You can try changing directories.
The Ways of working report uses a template populated by Viva Insights data to conduct a broad diagnostic of a company’s collaboration patterns, meeting effectiveness, wellbeing, and coaching to uncover areas for improvement. The categories and pages in the report help you answer these business questions:
- Understand collaboration patterns
- How much time do employees spend using digital collaboration tools?
- How much time do people spend in different collaboration modes?
- Make meetings effective
- How does the organization spend its meeting time?
- How much time is going towards recurring meetings?
- Is multitasking driven by habit or necessity?
- Improve wellbeing
- Are employees getting enough time to work on their core priorities?
- Encourage coaching and development
- Are employees receiving sufficient manager 1:1 coaching time?
- Are managers balancing oversight with employee autonomy?
To populate the report in Power BI, you’ll need to set up and successfully run the predefined Ways of working query in Viva Insights.
Demonstration
The following demonstration uses sample data that’s only representative of this report and might not be exactly what you see in a live report specific to your organization's unique data.
Prerequisites
Before you can run the queries and populate the report in Power BI, you’ll need to:
Be assigned the role of Insights Analyst in Viva Insights.
Have the December 2022 (or newer) version of Power BI Desktop installed. If you have an earlier version of Power BI installed, uninstall it before installing the new version. Then go to Get Power BI Desktop to download and install the latest version.
Report setup
Run query
- In the Viva Insights analyst experience, select Create analysis.
- Under Power BI templates, navigate to Ways of working and select Set up analysis. To get more information about the Ways of working template before running your analysis, select Learn more.
Under Query setup:
- Type a Query name.
- Select a Time period. Time period defaults to Last 3 months.
- Set Auto-refresh (optional). You can set the query to automatically update by checking the Auto-refresh box. When you select the Auto-refresh option, your query automatically runs and computes a new result every time Viva Insights gets updated collaboration data for licensed people.
Note
If organizational data used in an auto-refreshing query changes (for example, an attribute name is altered or an attribute is removed), the query might stop auto-refreshing.
- Type a Description (optional).
- Change the metric rule (optional). To set a new metric rule, select More settings. Then, pick a new rule from the list. For more information about metric rules, refer to Metric rules.
Note
The More settings pane also contains Group by settings. Power BI queries are set to Group by Week, and you're not able to edit this field.
Under Predefined template metrics, view the list of preselected metrics, which appear as gray tags. These metrics are required to set up the Power BI report and you can’t remove them. You can add other metrics by selecting Add metrics.
Important
Low-quality or missing organizational data might affect your metrics and result in warnings or errors. Learn more about data-quality notifications in Data quality in the analyst experience.
In Select which employees you want to include in the query, add filters to narrow down the employees in scope for your report. Don’t remove the predefined “Is Active” filter. For more details about filter and metric options, refer to Filters. If you notice a warning or error here, it's because one of your attributes is missing from your organizational data or is of low quality.
Under Select which employee attributes you want to include in the query, add up to 20 organizational attributes. Once the query runs, you can use these attributes to group and filter the reports.
Important
This PowerBI query needs some specific attributes to run, and we've preselected them for you. These attributes appear in gray and you can't remove them. We might also include some attributes that help your template, but aren't required for your query to run. These attributes appear in blue and you can remove them.
If you notice attributes marked with yellow warnings, that attribute's quality is low. If you notice attributes marked in red and the query's Run button disabled, then your organizational data is missing that attribute.
Learn more about attributes and data quality in Data quality in the analyst experience.
Select Run on the upper right side of the screen. The query might take a few minutes to run.
Access query results
You can access the report in two different ways:
- View the report in the browser. Use this option if you only want to View the report.
- Open the Power BI template in Power BI desktop and connect to your query results. Use this option if you want to customize the report or share it with others in your organization by publishing the report to the Power BI Service.
View report in the browser
To view the report in the browser, go to the Query results page and select the eye icon in the View column. You can select Open in new tab if you want to keep the report in the background while doing other tasks in Advanced insights.
Open the Power BI template in Power BI Desktop
- Go to the Query results page and select the Power BI icon in the Actions column to download the Power BI template and get the query and partition identifiers. You’ll need these identifiers later.
- Open the downloaded template.
- If you're prompted to select a program, select Power BI.
- When you're prompted by Power BI:
- Paste in the partition and query identifiers.
- Set the Minimum group size for data aggregation within this report's visualizations in accordance with your company's policy for viewing Viva Insights data.
- Select Load to import the query results into Power BI.
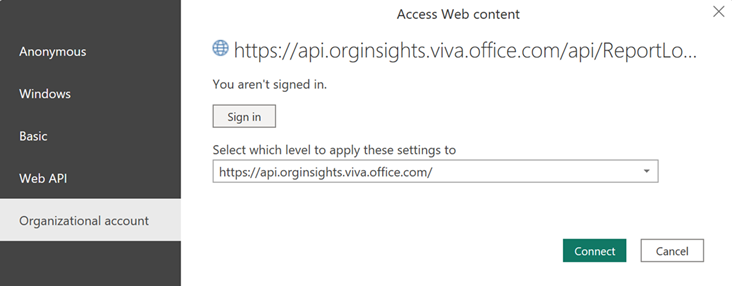
- If prompted by Power BI, sign in using your organizational account. Power BI then loads and prepares the data. For large files, this process might take a few minutes.
Important
You need to sign in to Power BI with the same account you use to access Viva Insights. If available, select Organizational account from the left. You might have to sign in more than once.
Report settings
After the Ways of working report is set up and populated with Viva Insights data in Power BI, view and set the following parameters on the Settings page:
| Setting | Description |
|---|---|
| Select the time period for the report | Select the time period for which you want to view data in the report. |
| Select an attribute to group data by | Select the primary group-by attribute shown in all the report pages. You can change this attribute at any time and all report pages will show group values by the new attribute. |
| Select optional report filter | To filter the measured employee population, you can filter by any selected organizational attribute, and then filter by any of the values for these attributes. If you use filters, the measured employees count will reflect a reduced number. Measured employees reflect the number of employees in the filtered population who were active during the specified time period. Active employees are those who’ve sent at least one email or Teams chat during a work week included in the current time period. |
| Exclusions | Use the check boxes to:
|
| Select the preferred language for your report | Change the language for your report. |
Note
Right now, the Exclusions listed above are not available if you choose to view the report in the browser. The Exclusions are only available if you download the Power BI template and open it on Power BI Desktop.
After confirming the settings, check the number of measured employees to confirm this is the population you want to analyze.
About this report
To help you assess your company's collaboration culture and employee experience, the Ways of working report includes the following categories and report pages:
| Category | Page |
|---|---|
| Understand collaboration patterns | Collaboration baseline and after-hours collaboration |
| Collaboration modes | |
| Make meetings effective | Long or large meetings |
| Recurring meeting hours | |
| Multitasking prevalence | |
| Improve wellbeing | Uninterrupted focus hours |
| Encourage coaching and development | Manager coaching time |
| Empower your workforce |
Let's discuss in more detail.
Understand collaboration patterns
Collaboration baseline and after-hours collaboration
How much time do employees spend using digital collaboration tools?
Compare the average weekly collaboration hours for each person, by group, to after-hours collaboration. This information highlights how collaboration load is impacting after-hours work.
Collaboration modes
How much time do people spend in different collaboration modes?
Explore, by group, the average number of hours per week that people are spending in:
- Meetings
- Teams chats
- Teams unscheduled calls
Toggle between total collaboration or after-hours collaboration. Understanding differences between how teams get work done can uncover both replicable best practices and areas of opportunity.
Make meetings effective
Long or large meetings
How does the organization spend its meeting time?
Discover how your organization spends its meeting time. On this page, view the percentage of time spent in the different meeting types by the number of invitees, including the meeting organizer, and duration.
Analyzing meeting practices at the organizational level can help pinpoint sources of meeting overload, which you can then work to streamline. You might also identify groups with successful meeting practices the rest of the company could adopt.
Recurring meeting hours
How much time is going towards recurring meetings?
Understand the time your organization spends in recurring meetings. We've broken out average time by meeting categories, like Large and short meetings and Small and long meetings. Large or long recurring meetings are easy candidates to streamline by reducing the number of invitees or the meeting frequency or duration.
Multitasking prevalence
Is multitasking driven by habit or necessity?
View the distribution of employees by their average collaboration hours and average multitasking rate—that is, the percentage of meetings and Teams calls hours where they’ve multitasked. This analysis helps determine whether multitasking during meetings is because of habit or because people don't have enough free time during the workday to catch up on email outside of meetings.
Improve wellbeing
Uninterrupted focus hours
Are employees getting enough time to work on their core priorities?
Find out how much time people have to work independently by viewing:
Average available-to-focus hours—that is, time without any scheduled meetings during working hours.
Uninterrupted hours—that is, time without any scheduled meetings during working hours not interrupted by email, Teams chats, or Teams calls.
Encourage coaching and development
Manager coaching time
Are employees receiving sufficient manager 1:1 coaching time?
Learn whether employees are getting enough 1:1 manager coaching. This page shows the distribution of employees by how much monthly 1:1 time they get with their managers.
Empower your workforce
Are managers balancing oversight with employee autonomy?
View the distribution of employees attending the same meetings as their managers, along with their average monthly 1:1 meeting time with their managers. This information is compared across the company.
Use this page to analyze different segments of manager behaviors (Co-attending, Highly managed, Under-coached, and Coaching) based on their rates of attending the same meeting as their reports and their 1:1 meeting time.
Behavioral trends
Understand trends for key leading indicator metrics.
Take action
Find opportunity areas for your organization. This page includes best practices, recommendations, and links to related articles about ways to help your managers improve in each area.
Glossary
View this report's metrics.
Power BI tips, FAQs, and troubleshooting
For details about how to share the report and other Power BI tips, troubleshoot any issues, or review the FAQ, see Power BI tips, FAQ, and troubleshooting.