Note
Access to this page requires authorization. You can try signing in or changing directories.
Access to this page requires authorization. You can try changing directories.
Note
We updated this template on August 24, 2023. If you've used the Wellbeing – balance and flexibility report before this date, make sure you run a new query as described in Report setup so you can enable new insights.
The Wellbeing – balance and flexibility report uses a template populated by Microsoft Viva Insights data to help you get insights into employee wellbeing across your company. This analysis can help you uncover opportunities to improve focus, work-life balance, flexibility at work, and employees’ sense of community.
With this report, you can visualize and explore the following top-level business questions asked by leaders:
- Protect focus – Do employees have enough time to focus, and are they using Viva Insights to help find that time?
- Balance work and life – Are employees able to protect personal time?
- Handle urgency – Can employees manage unexpected demands and proactively shift some to planned work?
- Embrace flexibility – Are employees adopting a flexible working schedule?
- Take breaks – Are employees able to mindfully disconnect?
- Stay connected – Are employees part of a community at work?
Each report page includes a Why this matters interpretation, recommended actions, and metric definitions.
To populate the report in Power BI, you’ll need to set up and successfully run the predefined Wellbeing – balance and flexibility report query in Viva Insights.
Demonstration
The following demonstration uses sample data that’s only representative of this report and might not be exactly what you see in a live report specific to your organization's unique data.
Prerequisites
Before you can run the queries and populate the report in Power BI, you’ll need to:
Be assigned the role of Insights Analyst in Viva Insights.
Have the December 2022 (or newer) version of Power BI Desktop installed. If you have an earlier version of Power BI installed, uninstall it before installing the new version. Then go to Get Power BI Desktop to download and install the latest version.
Report setup
Run query
In the Viva Insights analyst experience, select Create analysis.
Under Power BI templates, navigate to Wellbeing – balance and flexibility report and select Set up analysis.
Under Query setup:
- Type a Query name.
- Select a Time period. Time period defaults to Last 6 months.
- Set Auto-refresh (optional). You can set the query to automatically update by checking the Auto-refresh box. When you select the Auto-refresh option, your query automatically runs and computes a new result every time Viva Insights gets updated collaboration data for licensed people.
Note
If organizational data used in an auto-refreshing query changes (for example, an attribute name is altered or an attribute is removed), the query might stop auto-refreshing.
- Type a Description (optional).
- Change the metric rule (optional). To set a new metric rule, select More settings. Then, pick a new rule from the list. For more information about metric rules, refer to Metric rules.
Note
The More settings pane also contains Group by settings. Power BI queries are set to Group by Week, and you're not able to edit this field.
Under Predefined template metrics, view the list of preselected metrics, which appear as gray tags. These metrics are required to set up the Power BI report and you can’t remove them. You can add other metrics by selecting Add metrics.
Important
Low-quality or missing organizational data might affect your metrics and result in warnings or errors. Learn more about data-quality notifications in Data quality in the analyst experience.
In Select which employees you want to include in the query, add filters to narrow down the employees in scope for your report. Don’t remove the predefined “Is Active” filter. For more details about filter and metric options, refer to Filters. If you notice a warning or error here, it's because one of your attributes is missing from your organizational data or is of low quality.
Under Select which employee attributes you want to include in the query, add up to 14 organizational attributes, including the required Organization and HireDate attributes, and the optional LevelDesignation attributes. Once the query runs, you can use these attributes to group and filter the reports.
Important
This PowerBI query needs some specific attributes to run, and we've preselected them for you. These attributes appear in gray and you can't remove them. We might also include some attributes that help your template, but aren't required for your query to run. These attributes appear in blue and you can remove them.
If you notice attributes marked with yellow warnings, that attribute's quality is low. If you notice attributes marked in red and the query's Run button disabled, then your organizational data is missing that attribute.
Learn more about attributes and data quality in Data quality in the analyst experience.
Under Select which spotlight attributes you want to include in the query, add at least one and up to five attributes to use as a legend for insights in the report. You’ll also be able to focus on a specific group of employees in the report. Insights for this group will be highlighted.
Under Select an attribute that indicates the employee’s engagement score, you can optionally select an attribute that represents how engaged employees are.
Select Run on the upper right side of the screen. The query might take a few minutes to run.
When your query results are ready, go to the Analysis results page and select the Power BI icon. Download the Power BI template and get the partition and query identifiers. You’ll need these identifiers later.
Link report to query
- Open the downloaded template.
- If you're prompted to select a program, select Power BI.
- When you're prompted by Power BI:
- Paste in the partition and query identifiers.
- Set the Minimum group size for data aggregation within this report's visualizations in accordance with your company's policy for viewing Viva Insights data.
- Select Load to import the query results into Power BI.
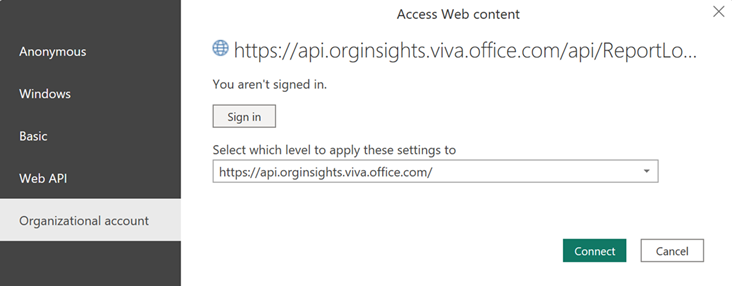
- If prompted by Power BI, sign in using your organizational account. Power BI then loads and prepares the data. For large files, this process might take a few minutes.
Important
You need to sign in to Power BI with the same account you use to access Viva Insights. If available, select Organizational account from the left. You might have to sign in more than once.
Report settings
Settings page
View and set the following parameters on the Settings page. You can find Settings on the right panel of the introduction page. You can also adjust the report settings as you go through the report pages through the Settings icon.
| Setting | Description |
|---|---|
| Select the time period to measure | Set the time period that you want to analyze. Note that the four-week trend information on the summary page won’t show if the selected time period is less than eight weeks. |
| Select an organizational attribute to view the report by | Set the primary "group-by" attribute shown in all subsequent reports. You can change this attribute at any time and all subsequent report pages will group values by the new attribute. |
| Select optional filters to exclude employee groups | To filter the measured employee population, filter by any selected organizational attribute, and then filter by any of the values for these attributes. If you use filters, the measured employees count will show a reduced number. Measured employees are the number of employees in the filtered population who were active during the specified time period. Active employees are those who send at least one email or Teams chat during a work week that's included in the current time period. |
| Exclude weeks marked with a holiday indicator | Select this control to exclude unusually low collaboration weeks based on individual collaboration patterns. These low collaboration weeks usually occur when employees are taking time off from work. |
| Exclude non-knowledge workers | Select this control to exclude employees who spend a weekly average of no more than five hours in meetings, emails, instant messages, and calls. These employees are unlikely to be knowledge workers or they don’t use Outlook or Teams. |
Embrace flexibility and Take breaks pages
Customize working hours
For Embrace flexibility and Take breaks pages, you can customize the standard working hours for your organization as a baseline. Select Customize working hours at the top right of the report page, and then select the standard start time and end time. The report will then compare employees’ collaboration patterns with these time settings.
About the report
The Wellbeing - balance and flexibility report includes the following report pages that help you identify your employees' wellbeing across the company.
Protect focus
This topic contains three pages, which each focus on a different theme: overview, adoption, and impact.
Overview
Do employees have enough time to focus, and are they using Viva Insights to help find that time?
Get a baseline view of how much time employees have to focus and how much time they kept as focus time using Viva Insights. This page helps you understand whether employees are actively protecting non-meeting time for focused work. You can also access adoption and impact pages from this page.
Adoption
Are employees using Viva Insights to set aside time for individual work?
Learn how consistently employees kept focus time over the last four weeks, and whether they’re using a Viva Insights focus plan to book their time. Use this page to:
- Better understand how your company is adopting focus time.
- Discover groups who haven't enrolled in a focus plan but have a high potential to benefit from one.
Impact
How are employees benefiting from protecting time in Viva Insights?
Find out how focus time is positively impacting employees. Like the last page, this page shows the number of hours employees kept for focus time over the last four weeks, and how employees booked that time--that is, with or without a focus plan.
Also, use this page to:
- Explore the impact of focus time on after-hours collaboration.
- Reduce meeting conflicts during focus hours by starting a shared no-meeting day plan.
Balance work and life
Are employees able to protect personal time?
To help understand after-hours working trends, view the:
- Average weekly after-hours collaboration for each employee.
- Distribution of employees by their after-hours collaboration.
- Percentage of employees who were active during the weekends at least once every four weeks.
When you understand employees' after-hours and weekend work behaviors, you might uncover opportunities to protect the boundary between work and personal life.
Handle urgency
Can employees manage unexpected demands and proactively shift some to planned work?
To uncover how unexpected demands are managed in your company, and to unlock opportunities to shift some of these demands to planned work, view:
- The percentage of employees and work weeks involved in urgent collaboration.
- The impact of urgent collaboration on employees' after-hours collaboration patterns.
This report defines urgent collaboration using the following keywords in the email subject lines or meeting invitation titles: "urgent," "immediately," "ASAP," "fire drill," "immediate action." You can also find this list of keywords in the report.
Embrace flexibility
Are employees adopting a flexible working schedule?
Identify employees' flexibility at work by exploring these three key percentages:
- Flexible start times – Weeks where employees had at least one day of flexible start time.
- Recurring time to disconnect – Weeks where employees took at least one hour of recurring break each day.
- Control active hours – Employees that limited their daily work activities to their expected working hours. Expected work hours are the hours employees plan to work. For example, if employees have a standard work schedule from 9:00 AM to 5:00 PM, their expected working hours for each day would be eight hours.
This analysis offers insight into how employees are adopting flexible working schedules.
Tip
You can customize work hours in the upper right of this page, next to Settings.
Take breaks
Are employees able to mindfully disconnect?
Find out how well employees are able to disconnect from work, and identify groups who might experience burnout. View the percentage weeks employees spent in each of the following categories (online activities on Outlook or Teams):
- Always on
- Long (non-stop)
- Long (with breaks)
- Standard (non stop)
- Standard (flexible)
- Low activity
Also view a distribution of this information by organization.
Tip
You can customize work hours in the upper right of this page, next to Settings.
Stay connected
Are employees part of a community at work?
Discover how employees connect with colleagues through small group meetings and informal communication. On this page, you'll find the:
- Average weekly meeting hours employees spent in small group meetings.
- Distribution of emails and chats by colleague type.
This information offers insight into whether employees are forming communities and rapport at work.
Other pages
The report also includes:
- A Behavioral trends page that tracks key metrics over time.
- A Take action page that provides actionable recommendations to improve behaviors.
- An Explore further page that highlights the research and studies in each topic.
- A Glossary page that describes all the metrics in the report.
Power BI tips, FAQs, and troubleshooting
For details about how to share the report and other Power BI tips, troubleshoot any issues, or review the FAQ, see Power BI tips, FAQ, and troubleshooting.