Note
Access to this page requires authorization. You can try signing in or changing directories.
Access to this page requires authorization. You can try changing directories.
Learning Agent reports give admins and leaders visibility into how their organization is discovering, adopting, and engaging with the Learning Agent. Reports are delivered across two surfaces, each tailored to a distinct audience:
Executive (Agents Dashboard)—surfaced inside the Viva Insights Agents Dashboard (currently in public preview, delivered by the Viva Insights team). Learning Agent appears as one of several agents in this cross-agent adoption rollup, alongside other Microsoft 365 Copilot agents. Designed for executives and leaders who want a cross-agent rollup of active users, returning users, agent responses, and adoption by org or role.
Knowledge Admin view (Learning Agent Reports)—surfaced inside the Learning Agent admin portal under Learning reports. Designed for Global Admins, Knowledge Admins, and Knowledge Managers responsible for driving and measuring learning outcomes. Includes an interactive dashboard plus a CSV export for deeper analysis.
Together, these reports answer four questions: Is Learning Agent reaching my workforce? Are people trying it? Are they coming back? And what are they actually doing when they engage?
Prerequisites
Who can access
| Report surface | Roles with access |
|---|---|
| Viva Insights Agents Dashboard (Executive view) | Connect to the Agent Dashboard M365 Global Admins; senior leaders (top 3 org levels, auto-granted via Entra ID); Viva Insights Analysts (global partition); delegated users. |
| Learning Agent admin portal — Learning Usage (Knowledge Admin view) | Learning Agent Reports link Global Admin, Knowledge Admin, Knowledge Manager. |
Note: Global Admins and Knowledge Admins can give non-admin users access to manage Learning Agent Reports through the Viva Learning admin tab. For more details, see Feature Access Management
Licensing requirements
The two report surfaces have different licensing footprints because they live in different products.
Knowledge Admin reports — Learning Agent admin portal (“Learning reports”)
- Included with a Microsoft 365 Copilot license. No separate Viva Learning license required.
- Not available for Copilot Chat–only tenants. Customers on Copilot Chat who want Learning Agent reporting needs to upgrade to Microsoft 365 Copilot.
Executive view — Viva Insights Agents Dashboard
- Currently in public preview, delivered by the Viva Insights team.
- Learning Agent appears as one of the agents in this cross-agent adoption rollup, alongside other Microsoft 365 Copilot agents.
- Access follows Viva Insights entitlements — See the Connect to the Agent Dashboard for current preview eligibility and licensing details. for current preview eligibility and licensing details.
Where to find Learning Agent Reports
Each audience reaches its report surface through a different entry point.
Knowledge Admin / Learning & Development view (admin portal)
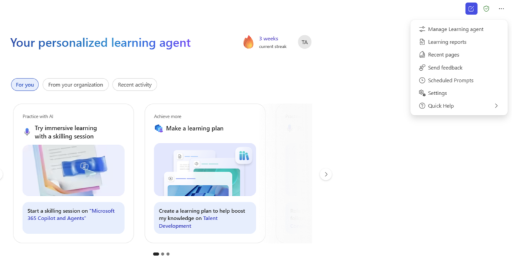
Global Admins, Knowledge Admins, and Knowledge Managers open the Learning Usage reports from directly within the Learning Agent:
- Open the Learning Agent.
- Select the more options (•••) menu in the top-right corner.
- Select Learning reports.
Accessing reports today
The Learning reports entry in the ••• menu is rolling out and may not yet be visible in every tenant. Until it appears, admins can open the reports directly using this link:
Open Learning Agent Reports
Executive view (Viva Insights Agents Dashboard)
Executives and senior leaders reach the cross-agent rollup through the Viva Insights Agents Dashboard (public preview), where Learning Agent appears alongside other Microsoft 365 Copilot agents. See the Viva Insights documentation for the current entry point and preview eligibility.
How it works
1. Dashboard
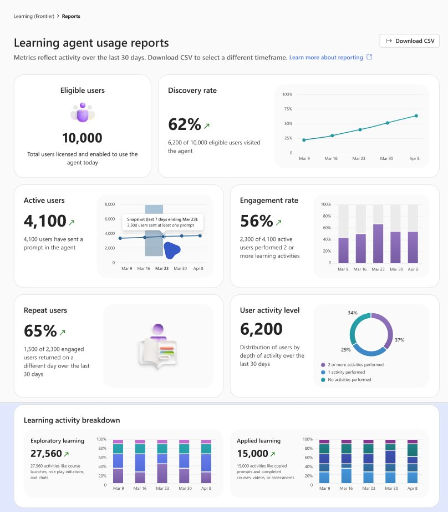
The Learning Usage dashboard reflects activity over the last 30 days by default. Each card shows a primary metric, a trend visualization, and a contextual sub-statement so admins can interpret the number at a glance.
Metrics shown:
- Eligible Users — How many employees in my tenant can use Learning Agent today? (Licensed and enabled, snapshot as of today.)
- Discovery Rate — Are my employees finding Learning Agent at all? (Unique visitors ÷ eligible users.)
- Active Users — Of those users who found it, how many actually tried it? (Users who sent at least one prompt.)
- Engagement Rate — Are active users converting to engaged? (Engaged learners ÷ active users, where engaged = 2 or more learning activities.)
- Repeat Users — Are learners coming back over more than one session or day, or is this behavior a one-time novelty? (Engaged learners who acted on two or more distinct days in the last 30 days.)
- User Activity Level — What does my learner base look like overall? Distribution across no activities, one activity, and two or more activities in the last 30 days.
- Learning Activity Breakdown — What are learners actually doing?
- Exploratory: course launched, microlearning viewed, role-play launched, skill assessment attempted.
- Applied: prompt copied, microlearning copied, skill assessment completed.
Calculation windows:
- Most metrics use a weekly (7-day rolling) window over the selected period.
- Repeat Users and User Activity Level use a fixed 30-day rolling window.
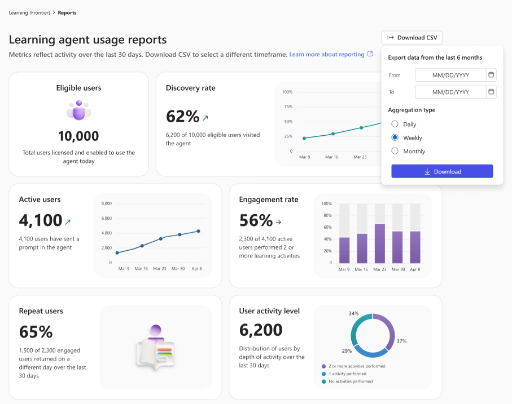
2. CSV Download
For deeper analysis or to integrate with internal BI tooling, admins can export the underlying metrics as a CSV.
Capabilities:
- Select Each row includes the full numerator and denominator behind every metric value, so the math is transparent and auditable.
- Useful for trend analysis beyond the dashboard’s default 30-day window, and for combining Learning Agent data with other tenant signals in your own BI tools.
FAQs
Q: I don’t see a “Learning reports” option in the menu yet. How do I access reports?
A: The Learning reports entry in the ••• menu is rolling out and may not be visible in your tenant yet. In the meantime, admins can open the reports using the direct link in Where to find Learning Agent Reports. Once the menu entry is available, you can launch reports directly from the Learning Agent.
Q: Why don’t I see any data yet?
A: Reports populate once your tenant has eligible users licensed and at least ten or more users interact with the Learning Agent. There may be a 24–48 hour delay for the first data to appear.
Q: How often does the dashboard refresh?
A: Data refreshes daily. Metric values reflect activity through the most recent processed day.
Q: What’s the difference between an Active User and an Engaged Learner?
A: An Active User sent at least one prompt. An Engaged Learner completed two or more learning activities (course launch, microlearning view, prompt copy, etc.) — a higher bar that signals actual learning behavior, not just trial.
Q: What counts as a “Learning Activity”?
A: Any meaningful learning action — broken into Exploratory (course launched, microlearning viewed, role-play launched, skill assessment attempted) and Applied (prompt copied, microlearning completed, course completed, role-play completed, skill assessment completed).
Q: Why do some metrics use a 7-day rolling window and others a fixed 30-day window?
A: Weekly rolling windows smooth daily noise for trend metrics (Discovery, Active, Engagement). Repeat Users and User Activity Level need a longer fixed window to meaningfully detect “coming back on a different day.”
Q: Can I export historical data beyond what the dashboard shows?
A: Yes — the CSV download supports any date range up to the last six months.
Q: Is the data anonymized? Can I see individual user activity?
A: Reports show aggregate metrics only. No individual user identities or prompt content are exposed. A tenant must have 10 or more users for reports to show, for privacy reasons.
Q: Can I delegate access to the Agents Dashboard in Viva Insights?
A: Yes — Viva Insights supports delegation, so an executive can have a chief of staff or analyst view the Agents Dashboard on their behalf.