Note
Access to this page requires authorization. You can try signing in or changing directories.
Access to this page requires authorization. You can try changing directories.
The Reporting & Analytics workspace provides an intuitive, interactive, and seamless reporting experience for Volume Licensing (VL) partners to derive maximum value from the data and make timely decisions to support and address customer needs.
The Reporting & Analytics workspace will provide the following to partners:
- Seamless reporting and analytics experience
- Personalized snapshots with insights and quick access to user data
- Actionable insights for scenarios such as expiring, out-of-compliance agreements and upcoming billings
- Capability to build and save custom reports
- Enhanced search capabilities for all VL reports and data
- Easy navigation and discoverability of reporting data
Additional capabilities and enhancements will be available in the next phases.
Workspace location
Reporting & Analytics is on the Microsoft Volume Licensing Central home page under Workspace. Select this option to open the page.

The Reporting & Analytics home page shows your organization’s agreements, invoices, purchase orders (POs), and reservations. Other report types are available under the My Views section.
You can add personalized snapshots, saved views, and favorite reports.
You can also search for and view price lists based on your program type and license agreement type.
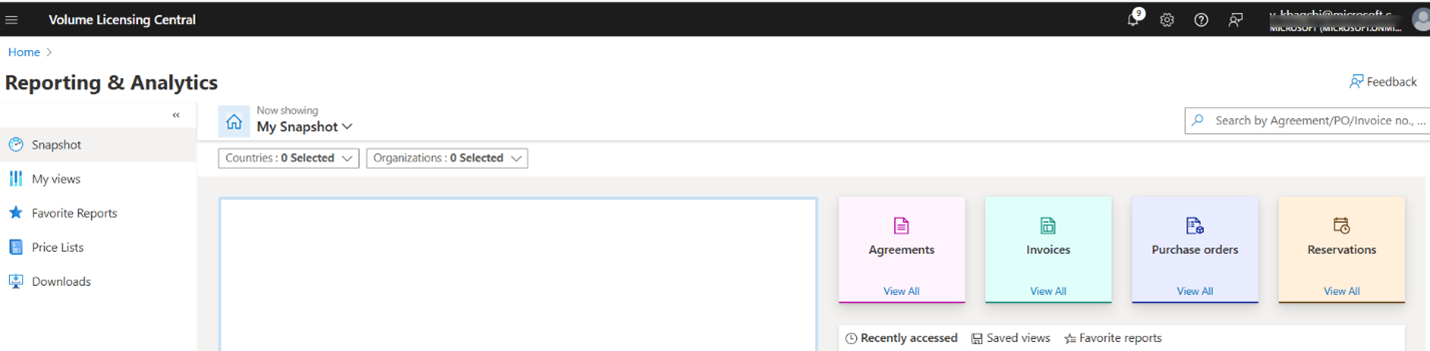
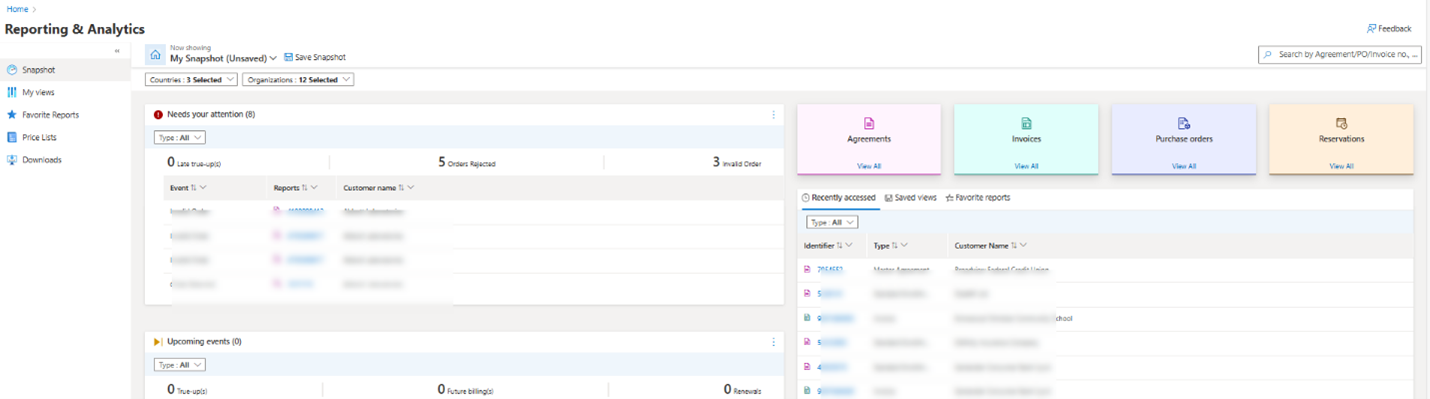
Reporting & Analytics home page
- Quick go-to options
- List of events that need action (such as invalid order or order rejected)
- List of upcoming events
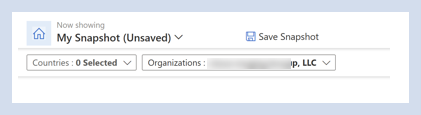
- Snapshot (Can be saved for future reference)
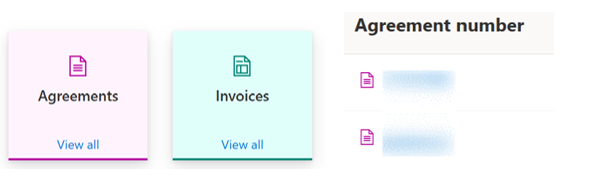
- Quick access widgets (Navigates to My views)
General functionality
- All blue text is clickable.
- Use the column headers to sort data.
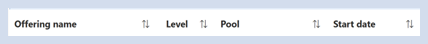
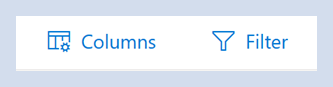
- Use the Columns option to select the columns you need and Filter to filter the data.
- The search bar allows for efficient search.

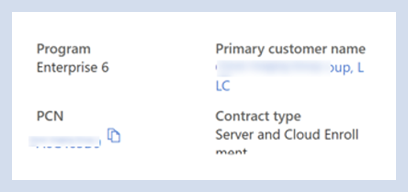
- Selecting the public customer number (PCN) or the customer name anywhere in the workspace will take you to the organization snapshot, with the organization preselected.
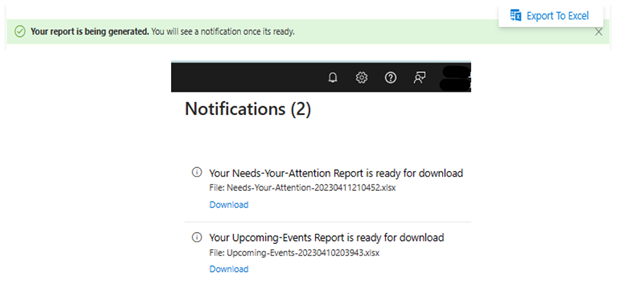
- To export the data to an Excel sheet, select the ellipsis, then Export to Excel. Go to the notification center and download the report from there.
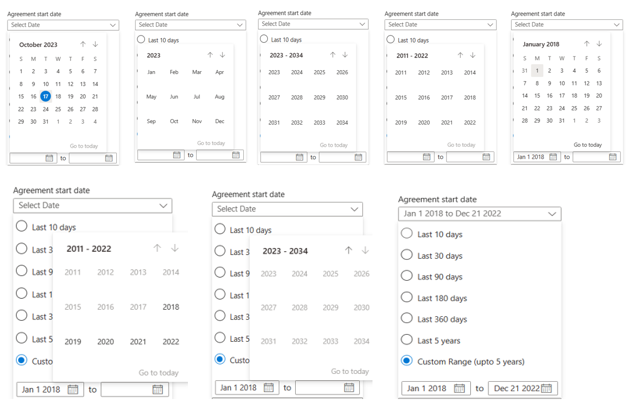
- There are custom date filters in the Reporting & Analytics workspace
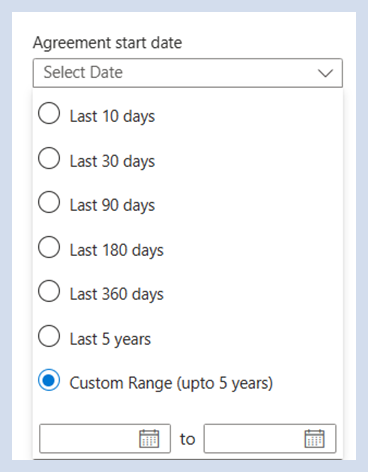
Selection of custom dates follows a five-year window – For example, to select a date from the year 2018, select October 2023 > 2023 > 2023-2024 > Go to the year 2018 for selection. Other dates will be grayed out for selection.