Note
Access to this page requires authorization. You can try signing in or changing directories.
Access to this page requires authorization. You can try changing directories.
This lab provides hands-on exercises that demonstrate how to debug the Sysvad audio kernel-mode device driver.
Microsoft Windows Debugger (WinDbg) is a powerful Windows-based debugging tool that you can use to perform user-mode and kernel-mode debugging. WinDbg provides source-level debugging for the Windows kernel, kernel-mode drivers, and system services, as well as user-mode applications and drivers.
WinDbg can step through source code, set breakpoints, view variables (including C++ objects), stack traces, and memory. Its Debugger Command window allows the user to issue a wide variety of commands.
Lab setup
You'll need the following hardware to be able to complete the lab:
- A laptop or desktop computer (host) running Windows 10
- A laptop or desktop computer (target) running Windows 10
- A network hub/router and network cables to connect the two PCs
- Access to the internet to download symbol files
You'll need the following software to be able to complete the lab.
- Microsoft Visual Studio 2017
- Windows Software Development Kit (SDK) for Windows 10
- Windows Driver Kit (WDK) for Windows 10
- The sample Sysvad audio driver for Windows 10
For information on downloading and installing the WDK, see Download the Windows Driver Kit (WDK).
Sysvad debugging walkthrough
This lab walk you through the process of debugging a kernel-mode driver. The exercises use the Syvad virtual audio driver sample. Because the Syvad audio driver doesn't interact with actual audio hardware, it can be used on most devices. The lab covers the following tasks:
- Section 1: Connect to a kernel-mode WinDbg session
- Section 2: kernel-mode debugging commands and techniques
- Section 3: Download and build the Sysvad audio driver
- Section 4: Install the Sysvad audio driver on the target system
- Section 5: Use WinDbg to display information about the driver
- Section 6: Display Plug and Play device tree information
- Section 7: Work with breakpoints and source code
- Section 8: Look at variables
- Section 9: View call stacks
- Section 10: Display processes and threads
- Section 11: IRQL, registers and disassembly
- Section 12: Work with memory
- Section 13: Ending the WinDbg session
- Section 14: Windows debugging resources
Echo driver lab
The Echo driver is a simpler driver than the Sysvad audio driver. If you're new to WinDbg, you may want to consider first completing the Debug Universal Drivers - Step-by-Step Lab (Echo kernel mode). This lab reuses the setup directions from that lab, so if you have completed that lab you can skip sections 1 and 2 here.
Section 1: Connect to a kernel-mode WinDbg session
In Section 1, you'll configure network debugging on the host and target system.
The PCs in this lab need to be configured to use an Ethernet network connection for kernel debugging.
This lab uses two computers. WinDbg runs on the host system and the Sysvad driver runs on the target system.
Use a network hub/router and network cables to connect the two PCs.

To work with kernel-mode applications and use WinDbg, we recommend that you use the KDNET over Ethernet transport. For information about how to use the Ethernet transport protocol, see Getting Started with WinDbg (Kernel-Mode). For more information about setting up the target computer, see Preparing a Computer for Manual Driver Deployment and Setting Up KDNET Network Kernel Debugging Automatically.
Configure kernel–mode debugging using ethernet
To enable kernel-mode debugging on the target system, perform the following steps.
<- On the host system
- Open a command prompt on the host system and type ipconfig /all to determine its IP address.
C:\>ipconfig /all
Windows IP Configuration

 Host Name . . . . . . . . . . . . : TARGETPC
...

Ethernet adapter Ethernet:
   Connection-specific DNS Suffix  . :
   Link-local IPv6 Address . . . . . : fe80::c8b6:db13:d1e8:b13b3
   Autoconfiguration IPv4 Address. . : 169.182.1.1
   Subnet Mask . . . . . . . . . . . : 255.255.0.0
   Default Gateway . . . . . . . . . :
Record the IP address of the host System: ______________________________________
Record the Host Name of the host System: ______________________________________
-> On the target system
- Open a command prompt on the target system and use the ping command to confirm network connectivity between the two systems. Use the actual IP address of the host system you recorded instead of 169.182.1.1 that is shown in the sample output.
C:\> ping 169.182.1.1

Pinging 169.182.1.1 with 32 bytes of data:
Reply from 169.182.1.1: bytes=32 time=1ms TTL=255
Reply from 169.182.1.1: bytes=32 time<1ms TTL=255
Reply from 169.182.1.1: bytes=32 time<1ms TTL=255
Reply from 169.182.1.1: bytes=32 time<1ms TTL=255

Ping statistics for 169.182.1.1:
    Packets: Sent = 4, Received = 4, Lost = 0 (0% loss),
Approximate round trip times in milli-seconds:
    Minimum = 0ms, Maximum = 1ms, Average = 0ms
To use the KDNET utility to enable kernel-mode debugging on the target system, perform the following steps.
On the host system, locate the WDK KDNET directory. By default it is located here.
C:\Program Files (x86)\Windows Kits\10\Debuggers\x64
This labs assumes that both PCs are running a 64 bit version of Windowson both the target and host. If that isn't the case, the best approach is to run the same "bitness" of tools on the host that the target is running. For example if the target is running 32 bit Windows, run a 32 version of the debugger on the host. For more information, see Choosing the 32-Bit or 64-Bit Debugging Tools.
Locate these two files and copy them to a network share or thumb drive, so that they will be available on the target computer.
kdnet.exe
VerifiedNICList.xml
On the target computer, open a Command Prompt window as Administrator. Enter this command to validate that the NIC on the target PC is supported.
C:\KDNET>kdnet

Network debugging is supported on the following NICs:
busparams=0.25.0, Intel(R) 82579LM Gigabit Network Connection, KDNET is running on this NIC.kdnet.exe
- Type this command to set the IP address of the host system. Use the actual IP address of the host system you recorded instead of 169.182.1.1 that is shown in the sample output. Pick a unique port address for each target/host pair that you work with, such as 50010.
C:\>kdnet 169.182.1.1 50010

Enabling network debugging on Intel(R) 82577LM Gigabit Network Connection.
Key=2steg4fzbj2sz.23418vzkd4ko3.1g34ou07z4pev.1sp3yo9yz874p
Important
Before using BCDEdit to change boot information you may need to temporarily suspend Windows security features such as BitLocker and Secure Boot on the test PC. Re-enable these security features when testing is complete and appropriately manage the test PC, when the security features are disabled. Secure boot is typically disabled in UEFI. To access UEFI setting, Use System, Recovery, Advanced start-up. On restart, select Troubleshoot, Advanced options, UEFI Firmware settings. Use caution, as incorrectly setting UEFI options or disabling BitLocker, may make the system inoperable.
- Type this command to confirm that the dbgsettings are set properly.
C:\> bcdedit /dbgsettings
busparams               0.25.0
key                     2steg4fzbj2sz.23418vzkd4ko3.1g34ou07z4pev.1sp3yo9yz874p
debugtype               NET
hostip                  169.182.1.1
port                    50010
dhcp                    Yes
The operation completed successfully.
Copy the auto generated unique key into a text file, to avoid having to type it in on the host PC. Copy the text file with the key over to the host system.
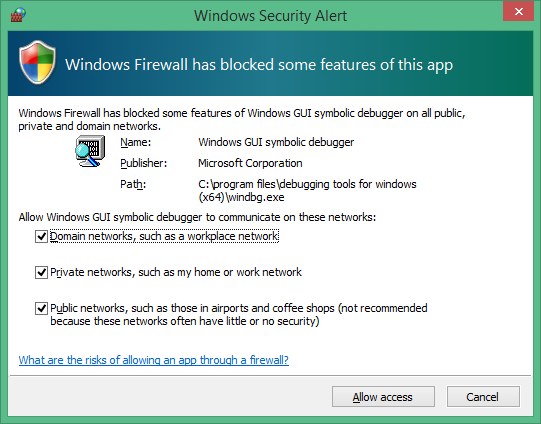
Note Firewalls and debuggers
If you receive a pop-up message from the firewall, and you wish to use the debugger, check all three of the boxes.
<- On the host system
- On the host computer, open a Command Prompt window as Administrator. Change to the WinDbg.exe directory. We will use the x64version of WinDbg.exe from the Windows Driver Kit (WDK) that was installed as part of the Windows kit installation.
C:\> Cd C:\Program Files (x86)\Windows Kits\10\Debuggers\x64
- Launch WinDbg with remote user debug using the following command. The value for the key and port match what you set earlier using BCDEdit on the target.
C:\> WinDbg –k net:port=50010,key=2steg4fzbj2sz.23418vzkd4ko3.1g34ou07z4pev.1sp3yo9yz874p
->On the target system
Reboot the target system.
<-On the host system
In a minute or two, debug output should be displayed on the host system.
The Debugger Command window is the primary debugging information window in WinDbg. You can enter debugger commands and view the command output in this window.
The Debugger Command window is split into two panes. You type commands in the smaller pane (the command entry pane) at the bottom of the window and view the command output in the larger pane at the top of the window.
In the command entry pane, use the up arrow and down arrow keys to scroll through the command history. When a command appears, you can edit it or press ENTER to run the command.
Section 2: kernel-mode debugging commands and techniques
In Section 2, you'll use debug commands to display information about the target system.
<- On the host system
Enable Debugger Markup Language (DML) with .prefer_dml
Some debug commands display text using Debugger Markup Language that you can select to quickly gather more information.
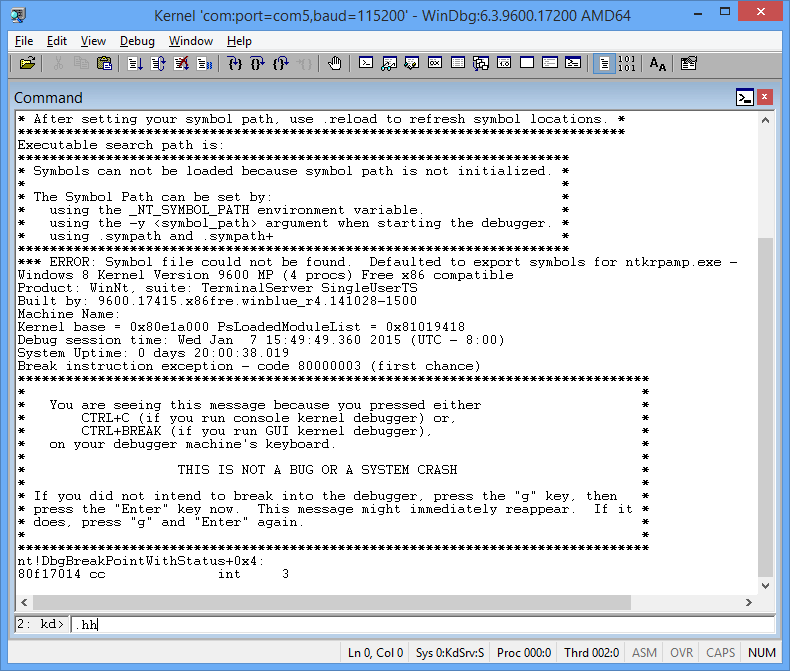
- Use Ctrl+Break (Scroll Lock) in WinDBg to break into the code running on the target system. It may take a bit of time for the target system to respond.
- Type the following command to enable DML in the Debugger Command window.
0: kd> .prefer_dml 1
DML versions of commands on by default
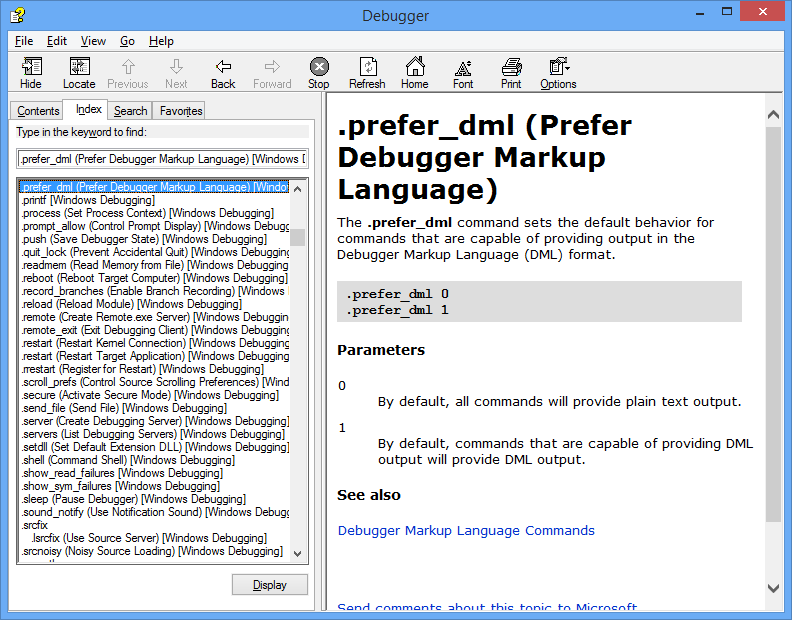
Use .hh to get help
You can access reference command help using the .hh command.
- Type the following command to view the command reference help for .prefer_dml.
0: kd> .hh .prefer_dml
The Debugger help file will display help for the .prefer_dml command.
Display the version of Windows on the target system
- Display detailed version information on the target system by typing the vertarget (Show Target Computer Version) command in the WinDbg window.
0: kd> vertarget
Windows 10 Kernel Version 9926 MP (4 procs) Free x64
Product: WinNt, suite: TerminalServer SingleUserTS
Built by: 9926.0.amd64fre.fbl_awesome1501.150119-1648
Machine Name: ""
Kernel base = 0xfffff801`8d283000 PsLoadedModuleList = 0xfffff801`8d58aef0
Debug session time: Fri Feb 20 10:15:17.807 2015 (UTC - 8:00)
System Uptime: 0 days 01:31:58.931
List the loaded modules
- You can verify that you're working with the right kernel-mode process by displaying the loaded modules by typing the lm (List Loaded Modules) command in the WinDbg window.
0: Kd> lm
start             end                 module name
fffff801`09200000 fffff801`0925f000   volmgrx    (no symbols)
fffff801`09261000 fffff801`092de000   mcupdate_GenuineIntel   (no symbols)
fffff801`092de000 fffff801`092ec000   werkernel   (export symbols)       werkernel.sys
fffff801`092ec000 fffff801`0934d000   CLFS       (export symbols)       CLFS.SYS
fffff801`0934d000 fffff801`0936f000   tm         (export symbols)       tm.sys
fffff801`0936f000 fffff801`09384000   PSHED      (export symbols)       PSHED.dll
fffff801`09384000 fffff801`0938e000   BOOTVID    (export symbols)       BOOTVID.dll
fffff801`0938e000 fffff801`093f7000   spaceport   (no symbols)
fffff801`09400000 fffff801`094cf000   Wdf01000   (no symbols)
fffff801`094d9000 fffff801`09561000   CI         (export symbols)       CI.dll
...
Note Output that has been omitted is indicated with "… " in this lab.
Because we have yet to set the symbol path and loaded symbols, limited information is available in the debugger.
Section 3: Download and build the Sysvad audio driver
In Section 3, you'll download and build the Sysvad audio driver.
Typically, you would be working with your own driver code when you use WinDbg. To become familiar with debugging audio drivers, the Sysvad virtual audio sample driver is used. This sample is used to illustrate how you can single step through native kernel-mode code. This technique can be very valuable for debugging complex kernel-mode code issues.
To download and build the Sysvad sample audio driver, perform the following steps.
Download and extract the Sysvad audio sample from GitHub
You can use a browser to view the Sysvad sample and Readme.md file here:
https://github.com/Microsoft/Windows-driver-samples/tree/main/audio/sysvad
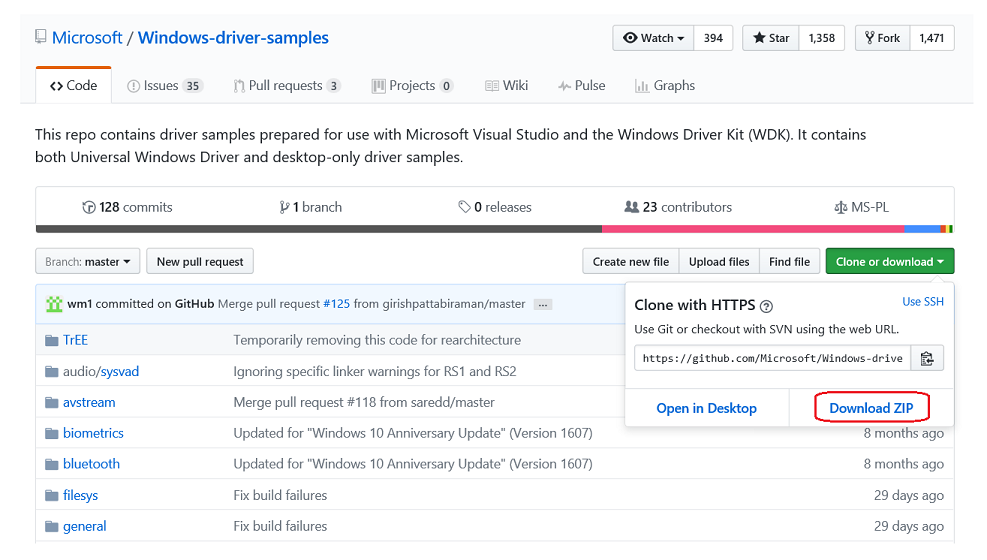
This lab, shows how to download the universal driver samples in one zip file.
a. Download the master.zip file to your local hard drive.
https://github.com/Microsoft/Windows-driver-samples/archive/master.zip
b. Select and hold (or right-click) Windows-driver-samples-master.zip, and choose Extract All. Specify a new folder, or browse to an existing one that will store the extracted files. For example, you could specify C:\WDK_Samples\ as the new folder into which the files are extracted.
c. After the files are extracted, navigate to the following subfolder.
C:\WDK_Samples\Sysvad
Open the driver solution in Visual Studio
In Visual Studio, select File > Open > Project/Solution... and navigate to the folder that contains the extracted files (for example, C:\WDK_Samples\Sysvad). Double-click the Syvad solution file.
In Visual Studio locate the Solution Explorer. (If this isn't already open, choose Solution Explorer from the View menu.) In Solution Explorer, you can see one solution that has a number of projects.
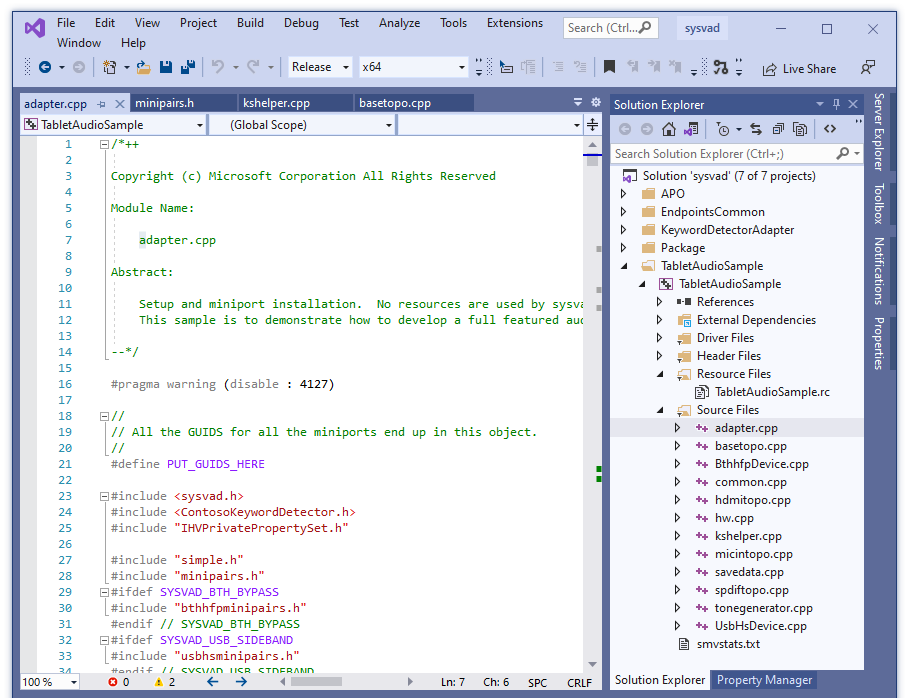
Set the sample's configuration and platform
In Solution Explorer, select and hold (or right-click) Solution 'sysvad' (7 of 7 projects), and choose Configuration Manager. Make sure that the configuration and platform settings are the same for the four projects. By default, the configuration is set to "Win10 Debug", and the platform is set to "Win64" for all the projects. If you make any configuration and/or platform changes for one project, you must make the same changes for the remaining three projects.
Note This lab assumes that 64 bit Windows is being used. If you're using 32 bit Windows, build the driver for 32 bit.
Check driver signing
Locate the TabletAudioSample. Open the Sysvad driver’s property page and make sure Driver Signing > Sign Mode is set to Test Sign.
Driver samples need to be modified to use values that don't overlap with existing drivers. Refer to From Sample Code to Production Driver - What to Change in the Samples on how to create a unique driver sample that will coexist with existing real drivers installed in Windows.
Build the sample using Visual Studio
In Visual Studio, select Build > Build Solution.
The build windows should display a message indicating that the build for all six projects succeeded.
Tip
If you encounter a build error message, use the build error number to determine a fix. For example, MSBuild error MSB8040 describes how to work with spectre mitigated libraries.
Locate the built driver files
In File Explorer, navigate to the folder that contains the extracted files for the sample. For example, you would navigate to C:\WDK_Samples\Sysvad, if that's the folder you specified earlier. Within that folder, the location of the compiled driver files varies depending on the configuration and platform settings that you selected in the Configuration Manager. For example, if you left the default settings unchanged, then the compiled driver files will be saved to a folder named \x64\Debug for a 64-bit, debug build.
Navigate to the folder that contains the built files for the TabletAudioSample driver:
C:\WDK_Samples\Sysvad\TabletAudioSample\x64\Debug. The folder will contain the TabletAudioSample .SYS driver, symbol pdp file and the inf file. You'll also need to locate the DelayAPO, KWSApo and KeywordDetectorContosoAdapter dlls and symbol files.
To install the driver, you'll need the following files.
File name Description TabletAudioSample.sys The driver file. TabletAudioSample.pdb The driver symbol file. tabletaudiosample.inf An information (INF) file that contains information needed to install the driver. KeywordDetectorContosoAdapter.dll A sample keyword detector. KeywordDetectorContosoAdapter.pdb The sample keyword detector symbol file. DelayAPO.dll A sample delay APO. DelayAPO.pdb The delay APO symbol file. KWSApo.dll A sample keyword spotter APO. KWSApo.pdb The keyword spotter symbol file. TabletAudioSample.cer The TabletAudioSample certificate file. Locate a USB thumb drive or set up a network share to copy the built driver files from the host to the target system.
In the next section, you'll copy the code to the target system, and install and test the driver.
Section 4: Install the Sysvad audio driver sample on the target system
In Section 4, you'll use devcon to install the Sysvad audio driver.
-> On the target system
The computer where you install the driver is called the target computer or the test computer. Typically, this is a separate computer from the computer on which you develop and build the driver package. The computer where you develop and build the driver is called the host computer.
The process of moving the driver package to the target computer and installing the driver is called deploying the driver.
Before you deploy a driver, you must prepare the target computer by turning on test signing. After that you’re ready to run the built driver sample on the target system.
To install the driver on the target system, perform the following steps.
Enable test signed drivers
To enable the ability to run test signed drivers:
Open Windows Settings.
In Update and Security, select Recovery.
Under Advanced startup, select Restart Now.
When the PC restarts, select Troubleshoot.
Then select Advanced options, Startup Settings and then select Restart.
Select Disable driver signature enforcement by pressing the F7 key.
The PC will start with the new values in place.
-> On the target system
Install the driver
The following instructions show you how to install and test the sample driver.
The INF file required for installing this driver is TabletAudioSample.inf. On the target computer, open a Command Prompt window as Administrator. Navigate to your driver package folder, right-click the TabletAudioSample.inf file, and then select Install.
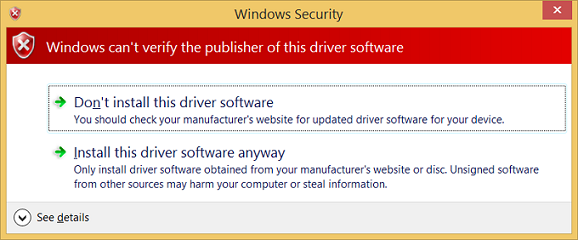
A dialog box will appear indicating that the test driver is an unsigned driver. Select Install this driver anyway to proceed.
Tip
If you have any issues with the installation, check the following file for more information.
%windir%\inf\setupapi.dev.logFor more detailed instructions, see Configuring a Computer for Driver Deployment, Testing, and Debugging.
The INF file contains the hardware ID for installing the tabletaudiosample.sys. For the Syvad sample, the hardware ID is:
root\sysvad_TabletAudioSampleExamine the driver in Device Manager
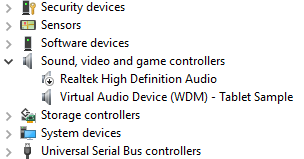
On the target computer, in a Command Prompt window, enter devmgmt to open Device Manager. In Device Manager, on the View menu, select Devices by type.
In the device tree, locate Virtual Audio Device (WDM) - Tablet Sample in the Audio Device node. This is typically under the Sound, video and game controllers node. Confirm that it is installed and active.
Highlight the driver for the actual hardware on the PC in Device Manager. Then select and hold (or right-click) the driver and select disable to disable the driver.
Confirm in Device Manager that audio hardware driver, displays the a down arrow, indicating that it is disabled.
After successfully installing the sample driver, you're now ready to test it.
Test the Sysvad audio driver
On the target computer, in a Command Prompt window, enter devmgmt to open Device Manager. In Device Manager, on the View menu, select Devices by type. In the device tree, locate Virtual Audio Device (WDM) - Tablet Sample.
Open Control Panel and navigate to Hardware and Sound > Manage audio devices. In the Sound dialog box, select the speaker icon labeled as Virtual Audio Device (WDM) - Tablet Sample, and then select Set Default, but do not select OK. This will keep the Sound dialog box open.
Locate an MP3 or other audio file on the target computer and double-click to play it. Then in the Sound dialog box, verify that there is activity in the volume level indicator associated with the Virtual Audio Device (WDM) - Tablet Sample driver.
Section 5: Use WinDbg to display information about the driver
In Section 5, you'll set the symbol path and use kernel debugger commands to display information about the Sysvad sample driver.
Symbols allow for WinDbg to display additional information such as variable names, that can be invaluable when debugging. WinDbg uses the Microsoft Visual Studio debug symbol formats for source-level debugging. It can access any symbol or variable from a module that has PDB symbol files.
To load the debugger, perform the following steps.
<-On the host system
If you closed the debugger, open it again using the following command in the administrator command prompt window. Replace the key and port with what you previously configured.
C:\> WinDbg –k net:port=50010,key=2steg4fzbj2sz.23418vzkd4ko3.1g34ou07z4pev.1sp3yo9yz874pUse Ctrl+Break (Scroll Lock) to break into the code running on the target system.
Set the symbol path
To set the symbols path to the Microsoft symbol server in the WinDbg environment, use the .symfix command.
0: kd> .symfixTo add your local symbol location to use your local symbols, add the path using .sympath+ and then .reload /f.
0: kd> .sympath+ C:\WDK_Samples\Sysvad
0: kd> .reload /f
Note The .reload command with the /f force option deletes all symbol information for the specified module and reloads the symbols. In some cases, this command also reloads or unloads the module itself.
Note You must load the proper symbols to use advanced functionality that WinDbg provides. If you do not have symbols properly configured, you'll receive messages indicating that symbols aren't available when you attempt to use functionality that is dependent on symbols.
0:000> dv
Unable to enumerate locals, HRESULT 0x80004005
Private symbols (symbols.pri) are required for locals.
Type “.hh dbgerr005” for details.
Note Symbol servers
There are a number of approaches that can be used to work with symbols. In many situations, you can configure the PC to access symbols from a symbol server that Microsoft provides when they are needed. This walkthrough assumes that this approach will be used. If the symbols in your environment are in a different location, modify the steps to use that location. For additional information, see Symbol path for Windows debugger.
Note Understand source code symbol requirements
To perform source debugging, you must build a checked (debug) version of your binaries. The compiler will create symbol files (.pdb files). These symbol files will show the debugger how the binary instructions correspond to the source lines. The actual source files themselves must also be accessible to the debugger.
The symbol files do not contain the text of the source code. For debugging, it is best if the linker doesn't optimize your code. Source debugging and access to local variables are more difficult, and sometimes nearly impossible, if the code has been optimized. If you're having problems viewing local variables or source lines, set the following build options.
set COMPILE_DEBUG=1
set ENABLE_OPTIMIZER=0
Type the following in the command area of the debugger to display information about the Sysvad driver.
0: kd> lm m tabletaudiosample v
Browse full module list
start             end                 module name
fffff801`14b40000 fffff801`14b86000   tabletaudiosample   (private pdb symbols)  C:\Debuggers\sym\TabletAudioSample.pdb\E992C4803EBE48C7B23DC1596495CE181\TabletAudioSample.pdb
    Loaded symbol image file: tabletaudiosample.sys
    Image path: \SystemRoot\system32\drivers\tabletaudiosample.sys
    Image name: tabletaudiosample.sys
    Browse all global symbols  functions  data
    Timestamp:        Thu Dec 10 12:20:26 2015 (5669DE8A)
    CheckSum:         0004891E
...
For more information, see lm.
Select the Browse all global symbols link in the debug output to display information about items symbols that start with the letter a.
Because DML is enabled, some elements of the output are hot links that you can select. Select the data link in the debug output to display information about items symbols that start with the letter a.
0: kd> x /D /f tabletaudiosample!a*
 A B C D E F G H I J K L M N O P Q R S T U V W X Y Z

fffff806`9adb1000 tabletaudiosample!AddDevice (struct _DRIVER_OBJECT *, struct _DEVICE_OBJECT *)
For information, see x (Examine Symbols).
The !lmi extension displays detailed information about a module. Type !lmi tabletaudiosample. Your output should be similar to the text shown below.
0: kd> !lmi tabletaudiosample
Loaded Module Info: [tabletaudiosample]
         Module: tabletaudiosample
   Base Address: fffff8069ad90000
     Image Name: tabletaudiosample.sys
   Machine Type: 34404 (X64)
     Time Stamp: 58ebe848 Mon Apr 10 13:17:12 2017
           Size: 48000
       CheckSum: 42df7
Characteristics: 22
Debug Data Dirs: Type  Size     VA  Pointer
             CODEVIEW    a7,  e5f4,    d1f4 RSDS - GUID: {5395F0C5-AE50-4C56-AD31-DD5473BD318F}
               Age: 1, Pdb: C:\Windows-driver-samples-master\audio\sysvad\TabletAudioSample\x64\Debug\TabletAudioSample.pdb
                   ??   250,  e69c,    d29c [Data not mapped]
     Image Type: MEMORY   - Image read successfully from loaded memory.
    Symbol Type: PDB      - Symbols loaded successfully from image header.
                 C:\Program Files (x86)\Windows Kits\10\Debuggers\x64\sym\TabletAudioSample.pdb\5395F0C5AE504C56AD31DD5473BD318F1\TabletAudioSample.pdb
       Compiler: Resource - front end [0.0 bld 0] - back end [14.0 bld 24210]
    Load Report: private symbols & lines, not source indexed
                 C:\Program Files (x86)\Windows Kits\10\Debuggers\x64\sym\TabletAudioSample.pdb\5395F0C5AE504C56AD31DD5473BD318F1\TabletAudioSample.pdb
Use the !dh extension to display header information as shown below.
0: kd> !dh tabletaudiosample

File Type: EXECUTABLE IMAGE
FILE HEADER VALUES
    8664 machine (X64)
       9 number of sections
5669DE8A time date stamp Thu Dec 10 12:20:26 2015

       0 file pointer to symbol table
       0 number of symbols
      F0 size of optional header
      22 characteristics
            Executable
            App can handle >2gb addresses
...
Section 6: Displaying Plug and Play device tree information
In Section 6, you'll display information about the Sysvad sample device driver and where it lives in the Plug and Play device tree.
Information about the device driver in the Plug and Play device tree can be useful for troubleshooting. For example, if a device driver isn't resident in the device tree, there may an issue with the installation of the device driver.
For more information about the device node debug extension, see !devnode.
<-On the host system
To see all the device nodes in the Plug and Play device tree, enter the !devnode 0 1 command. This command can take a minute or two to run. During that time, "*Busy" will be displayed in the status area of WinDbg.
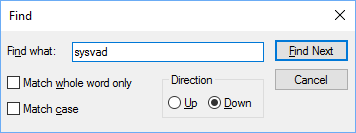
0: kd> !devnode 0 1
Dumping IopRootDeviceNode (= 0xffffe0005a3a8d30)
DevNode 0xffffe0005a3a8d30 for PDO 0xffffe0005a3a9e50
  InstancePath is "HTREE\ROOT\0"
  State = DeviceNodeStarted (0x308)
  Previous State = DeviceNodeEnumerateCompletion (0x30d)
  DevNode 0xffffe0005a3a3d30 for PDO 0xffffe0005a3a4e50
    InstancePath is "ROOT\volmgr\0000"
    ServiceName is "volmgr"
    State = DeviceNodeStarted (0x308)
    Previous State = DeviceNodeEnumerateCompletion (0x30d)
    DevNode 0xffffe0005a324560 for PDO 0xffffe0005bd95ca0…
...
Use Ctrl+F to search in the output that is generated to look for the name of the device driver, sysvad.
A device node entry with a name of
sysvad_TabletAudioSamplewill be present in the !devnode output for Syvad.DevNode 0xffffe00086e68190 for PDO 0xffffe00089c575a0 InstancePath is "ROOT\sysvad_TabletAudioSample\0000" ServiceName is "sysvad_tabletaudiosample" State = DeviceNodeStarted (0x308) ...Note that the PDO address and the DevNode address are displayed.
Use the
!devnode 0 1 sysvad_TabletAudioSamplecommand to display Plug and Play information associated with our Sysvad device driver.0: kd> !devnode 0 1 sysvad_TabletAudioSample Dumping IopRootDeviceNode (= 0xffffe00082df8d30) DevNode 0xffffe00086e68190 for PDO 0xffffe00089c575a0 InstancePath is "ROOT\sysvad_TabletAudioSample\0000" ServiceName is "sysvad_tabletaudiosample" State = DeviceNodeStarted (0x308) Previous State = DeviceNodeEnumerateCompletion (0x30d) DevNode 0xffffe000897fb650 for PDO 0xffffe00089927e30 InstancePath is "SWD\MMDEVAPI\{0.0.0.00000000}.{64097438-cdc0-4007-a19e-62e789062e20}" State = DeviceNodeStarted (0x308) Previous State = DeviceNodeStartPostWork (0x307) DevNode 0xffffe00086d2f5f0 for PDO 0xffffe00089939ae0 InstancePath is "SWD\MMDEVAPI\{0.0.0.00000000}.{78880f4e-9571-44a4-a9df-960bde446487}" State = DeviceNodeStarted (0x308) Previous State = DeviceNodeStartPostWork (0x307) DevNode 0xffffe00089759bb0 for PDO 0xffffe000875aa060 InstancePath is "SWD\MMDEVAPI\{0.0.0.00000000}.{7cad07f2-d0a0-4b9b-8100-8dc735e9c447}" State = DeviceNodeStarted (0x308) Previous State = DeviceNodeStartPostWork (0x307) DevNode 0xffffe00087735010 for PDO 0xffffe000872068c0 InstancePath is "SWD\MMDEVAPI\{0.0.0.00000000}.{fc38551b-e69f-4b86-9661-ae6da78bc3c6}" State = DeviceNodeStarted (0x308) Previous State = DeviceNodeStartPostWork (0x307) DevNode 0xffffe00088457670 for PDO 0xffffe0008562b830 InstancePath is "SWD\MMDEVAPI\{0.0.1.00000000}.{0894b831-c9fe-4c56-86a6-092380fc5628}" State = DeviceNodeStarted (0x308) Previous State = DeviceNodeStartPostWork (0x307) DevNode 0xffffe000893dbb70 for PDO 0xffffe00089d68060 InstancePath is "SWD\MMDEVAPI\{0.0.1.00000000}.{15eb6b5c-aa54-47b8-959a-0cff2c1500db}" State = DeviceNodeStarted (0x308) Previous State = DeviceNodeStartPostWork (0x307) DevNode 0xffffe00088e6f250 for PDO 0xffffe00089f6e990 InstancePath is "SWD\MMDEVAPI\{0.0.1.00000000}.{778c07f0-af9f-43f2-8b8d-490024f87239}" State = DeviceNodeStarted (0x308) Previous State = DeviceNodeStartPostWork (0x307) DevNode 0xffffe000862eb4b0 for PDO 0xffffe000884443a0 InstancePath is "SWD\MMDEVAPI\{0.0.1.00000000}.{e4b72c7c-be50-45df-94f5-0f2922b85983}" State = DeviceNodeStarted (0x308) Previous State = DeviceNodeStartPostWork (0x307)The output displayed in the previous command includes the PDO associated with the running instance of our driver, in this example it is 0xffffe00089c575a0. Enter the !devobj<PDO address> command to display Plug and Play information associated with the Sysvad device driver. Use the PDO address that !devnode displays on your PC, not the one shown here.
0: kd> !devobj 0xffffe00089c575a0
Device object (ffffe00089c575a0) is for:
0000004e \Driver\PnpManager DriverObject ffffe00082d47e60
Current Irp 00000000 RefCount 65 Type 0000001d Flags 00001040
SecurityDescriptor ffffc102b0f6d171 DevExt 00000000 DevObjExt ffffe00089c576f0 DevNode ffffe00086e68190
ExtensionFlags (0000000000)
Characteristics (0x00000180)  FILE_AUTOGENERATED_DEVICE_NAME, FILE_DEVICE_SECURE_OPEN
AttachedDevice (Upper) ffffe00088386a50 \Driver\sysvad_tabletaudiosample
Device queue is not busy.
The output displayed in the !devobj command includes the name of the attached device: \Driver\sysvad_tabletaudiosample. Use the !drvobj command with a bit mask of 2, to display information associated with the attached device.
0: kd> !drvobj \Driver\sysvad_tabletaudiosample 2
Driver object (ffffe0008834f670) is for:
\Driver\sysvad_tabletaudiosample
DriverEntry:   fffff80114b45310  tabletaudiosample!FxDriverEntry
DriverStartIo: 00000000
DriverUnload:  fffff80114b5fea0                tabletaudiosample!DriverUnload
AddDevice:     fffff80114b5f000  tabletaudiosample!AddDevice

Dispatch routines:
[00] IRP_MJ_CREATE                      fffff80117b49a20             portcls!DispatchCreate
[01] IRP_MJ_CREATE_NAMED_PIPE           fffff8015a949a00          nt!IopInvalidDeviceRequest
[02] IRP_MJ_CLOSE                       fffff80115e26f90                ks!DispatchCleanup
[03] IRP_MJ_READ                        fffff80115e32710                ks!DispatchRead
[04] IRP_MJ_WRITE                       fffff80115e327e0              ks!DispatchWrite
[05] IRP_MJ_QUERY_INFORMATION           fffff8015a949a00         nt!IopInvalidDeviceRequest
[06] IRP_MJ_SET_INFORMATION             fffff8015a949a00              nt!IopInvalidDeviceRequest
[07] IRP_MJ_QUERY_EA                    fffff8015a949a00         nt!IopInvalidDeviceRequest
[08] IRP_MJ_SET_EA                      fffff8015a949a00              nt!IopInvalidDeviceRequest
[09] IRP_MJ_FLUSH_BUFFERS               fffff80115e32640  ks!DispatchFlush
[0a] IRP_MJ_QUERY_VOLUME_INFORMATION    fffff8015a949a00           nt!IopInvalidDeviceRequest
[0b] IRP_MJ_SET_VOLUME_INFORMATION      fffff8015a949a00               nt!IopInvalidDeviceRequest
[0c] IRP_MJ_DIRECTORY_CONTROL           fffff8015a949a00           nt!IopInvalidDeviceRequest
[0d] IRP_MJ_FILE_SYSTEM_CONTROL         fffff8015a949a00         nt!IopInvalidDeviceRequest
[0e] IRP_MJ_DEVICE_CONTROL              fffff80115e27480               ks!DispatchDeviceIoControl
[0f] IRP_MJ_INTERNAL_DEVICE_CONTROL     fffff8015a949a00   nt!IopInvalidDeviceRequest
[10] IRP_MJ_SHUTDOWN                    fffff8015a949a00      nt!IopInvalidDeviceRequest
[11] IRP_MJ_LOCK_CONTROL                fffff8015a949a00  nt!IopInvalidDeviceRequest
[12] IRP_MJ_CLEANUP                     fffff8015a949a00           nt!IopInvalidDeviceRequest
[13] IRP_MJ_CREATE_MAILSLOT             fffff8015a949a00               nt!IopInvalidDeviceRequest
[14] IRP_MJ_QUERY_SECURITY              fffff80115e326a0 ks!DispatchQuerySecurity
[15] IRP_MJ_SET_SECURITY                fffff80115e32770      ks!DispatchSetSecurity
[16] IRP_MJ_POWER                       fffff80117b3dce0            portcls!DispatchPower
[17] IRP_MJ_SYSTEM_CONTROL              fffff80117b13d30              portcls!PcWmiSystemControl
[18] IRP_MJ_DEVICE_CHANGE               fffff8015a949a00 nt!IopInvalidDeviceRequest
[19] IRP_MJ_QUERY_QUOTA                 fffff8015a949a00  nt!IopInvalidDeviceRequest
[1a] IRP_MJ_SET_QUOTA                   fffff8015a949a00       nt!IopInvalidDeviceRequest
[1b] IRP_MJ_PNP                         fffff80114b5f7d0 tabletaudiosample!PnpHandler
Enter the !devstack<PDO address> command to display Plug and Play information associated with the device driver. The output displayed in the !devnode 0 1 command includes the PDO address associated with the running instance of our driver. In this example it is 0xffffe00089c575a0. Use the PDO address that !devnode displays on your PC, not the one shown below.
0: kd> !devstack 0xffffe00089c575a0
  !DevObj           !DrvObj            !DevExt           ObjectName
  ffffe00088d212e0  \Driver\ksthunk    ffffe00088d21430  0000007b
  ffffe00088386a50  \Driver\sysvad_tabletaudiosampleffffe00088386ba0  0000007a
> ffffe00089c575a0  \Driver\PnpManager 00000000  0000004e
!DevNode ffffe00086e68190 :
  DeviceInst is "ROOT\sysvad_TabletAudioSample\0000"
  ServiceName is "sysvad_tabletaudiosample"
The output shows that we have a farily simple device driver stack. The sysvad_TabletAudioSample driver is a child of the PnPManager node. The PnPManager is a root node.
This diagram shows a more complex device node tree.
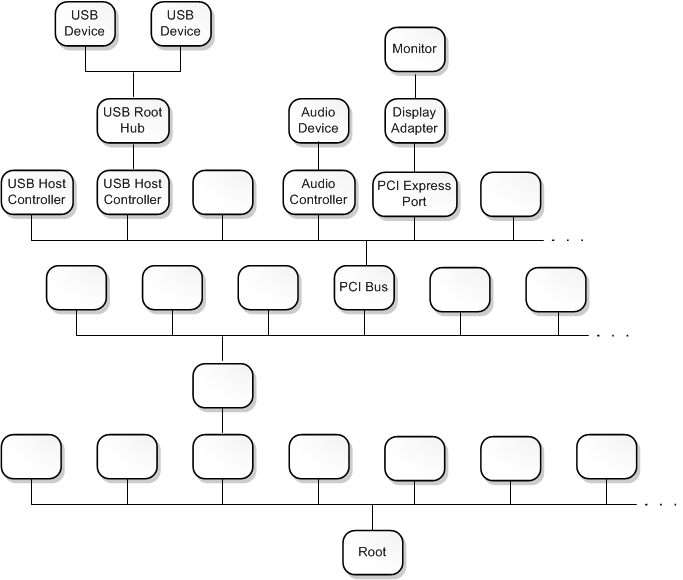
Note For more information about more complex driver stacks, see Driver stacks and Device nodes and device stacks.
Section 7: Working with breakpoints
In Section 7, you'll work with breakpoints to stop code execution at specific points.
Setting breakpoints using commands
Breakpoints are used to stop code execution at a particular line of code. You can then step forward in the code from that point, to debug that specific section of code.
To set a breakpoint using a debug command, use one of the following b commands.
bp |
Sets a breakpoint that will be active until the module it is in is unloaded. |
bu |
Sets a breakpoint that is unresolved when the module is unloaded and re-enables when the module reloads. |
bm |
Sets a breakpoint for a symbol. This command will use bu or bp appropriately and allows wildcards * to be used to set breakpoints on every symbols that matches (like all methods in a class). |
Use the WinDbg UI to confirm that Debug > Source Mode is enabled in the current WinDbg session.
Add your local code location to the source path by typing the following command.
.sympath+ C:\WDK_Samples\SysvadAdd your local symbol location to the symbol path by typing the following command.
.sympath+ C:\WDK_Samples\SysvadSet the debug mask
As you're working with a driver it can be handy to see all of the messages that it may display. Type the following to change the default debug bit mask so that all debug messages from the target system will be displayed in the debugger.
0: kd> ed nt!Kd_DEFAULT_MASK 0xFFFFFFFFSet the breakpoint with the bm command using the name of the driver, followed by the function name (AddDevice) where you want to set the breakpoint, separated by an exclamation mark.
0: kd> bm tabletaudiosample!AddDevice
breakpoint 1 redefined
  1: fffff801`14b5f000 @!"tabletaudiosample!AddDevice"
You can use different syntax in conjunction with setting variables like <module>!<symbol>, <class>::<method>,‘<file.cpp>:<line number>’, or skip a number of times <condition> <#>. For more information, see Using Breakpoints.
List the current breakpoints to confirm that the breakpoint was set by typing the bl command.
0: kd> bl
1 e fffff801`14b5f000     0001 (0001) tabletaudiosample!AddDevice
Restart code execution on the target system by typing the go command g.
->On the target system
In Windows, open Device Manager by using the icon or by entering mmc devmgmt.msc. In Device Manager expand the Sound, video and game controllers node. Select and hold (or right-click) the virtual audio driver entry and select Disable from the menu.
Select and hold (or right-click) the virtual audio driver entry again and select Enable from the menu.
<- On the host system
This should cause Windows to reload the driver, which calls AddDevice. This will cause the AddDevice debug breakpoint to fire and the execution of the driver code on the target system should halt.
Breakpoint 1 hit
tabletaudiosample!AddDevice:
fffff801`14baf000 4889542410      mov     qword ptr [rsp+10h],rdx
If your source path is set properly, you should stop at the AddDevice routine in adapter.cpp
{
    PAGED_CODE();

    NTSTATUS        ntStatus;
    ULONG           maxObjects;

    DPF(D_TERSE, ("[AddDevice]"));

    maxObjects = g_MaxMiniports;

    #ifdef SYSVAD_BTH_BYPASS
    //
    // Allow three (3) Bluetooth hands-free profile devices.
    //
    maxObjects += g_MaxBthHfpMiniports * 3;
    #endif // SYSVAD_BTH_BYPASS

    // Tell the class driver to add the device.
    //
    ntStatus =
        PcAddAdapterDevice
        (
            DriverObject,
            PhysicalDeviceObject,
            PCPFNSTARTDEVICE(StartDevice),
            maxObjects,
            0
        );
    return ntStatus;
} // AddDevice
Step line-by-line through the code by typing the p command or pressing F10. You can step forward out of the sysvad AddDevice code to PpvUtilCall, PnpCallAddDevice and then to the PipCallDriverAddDevice Windows code. You can provide a number to the p command to step forward multiple lines, for example p 5.
When you're done stepping through the code, use the go command g to restart execution on the target system.
Setting memory access breakpoints
You can also set breakpoints that fire when a memory location is accessed. Use the ba (break on access) command, with the following syntax.
ba <access> <size> <address> {options}
| Option | Description |
|---|---|
e |
execute (when CPU fetches an instruction from the address) |
r |
read/write (when CPU reads or writes to the address) |
w |
write (when the CPU writes to the address) |
Note that you can only set four data breakpoints at any given time and it is up to you to make sure that you're aligning your data correctly or you won’t trigger the breakpoint (words must end in addresses divisible by 2, dwords must be divisible by 4, and quadwords by 0 or 8)
For example, to set a read/write breakpoint on a specific memory address, use a command like this.
ba r 4 fffff800`7bc9eff0
Modifying breakpoint state
You can modify existing breakpoints by using the following commands.
bl |
Lists breakpoints. |
bc |
Clears a breakpoint from the list. Use bc * to clear all breakpoints. |
bd |
Disables a breakpoint. Use bd * to disable all breakpoints. |
be |
Enables a breakpoint. Use be * to enable all breakpoints. |
Alternatively, you can also modify breakpoints by selecting edit > breakpoints. Note that the breakpoint dialog box only works with existing breakpoints. New breakpoints must be set from the command line.
Set a breakpoint on MixerVolume
Different parts of the audio driver code is called to respond to various events, after the device driver is loaded. In the next section, we set a breakpoint that will fire when the user adjusts the volume control for the virtual audio driver.
To set a breakpoint on MixerVolume, perform the following steps.
<- On the host system
To locate the method that changes the volume, use the x command to list the symbols in CAdapterCommon, that contain the string volume.
kd> x tabletaudiosample!CAdapterCommon::*
...
fffff800`7bce26a0 tabletaudiosample!CAdapterCommon::MixerVolumeWrite (unsigned long, unsigned long, long)
…
Use CTRL+F to search upward in the output for volume and locate the MixerVolumeWrite method.
Clear the previous breakpoints using bc *.
Set a symbol breakpoint on the CAdapterCommon::MixerVolumeWrite routine using the following command.
kd> bm tabletaudiosample!CAdapterCommon::MixerVolumeWrite
  1: fffff801`177b26a0 @!"tabletaudiosample!CAdapterCommon::MixerVolumeWrite"
List the breakpoints to confirm that the breakpoint is set properly.
kd> bl
1 e fffff801`177b26a0 [c:\WDK_Samples\audio\sysvad\common.cpp @ 1668]    0001 (0001) tabletaudiosample!CAdapterCommon::MixerVolumeWrite
Restart code execution on the target system by typing the go command g.
In Control Panel select Hardware and Sound >Sound. Select and hold (or right-click) Sink Description Sample and select Properties. Select the Levels tab. Adjust the slider volume.
This should cause the SetMixerVolume debug breakpoint to fire and execution of the driver code on the target system should halt.
kd> g
Breakpoint 1 hit
tabletaudiosample!CAdapterCommon::MixerVolumeWrite:
fffff801`177b26a0 44894c2420      mov     dword ptr [rsp+20h],r9d
You should stop at this line in common.cpp
{
    if (m_pHW)
    {
        m_pHW->SetMixerVolume(Index, Channel, Value);
    }
} // MixerVolumeWrite
Use the dv command to display the current variables and their values. More information on variables is provided in the next section of this lab.
2: kd> dv
           this = 0x00000000`00000010
         ulNode = 0x344
      ulChannel = 0x210a45f8
        lVolume = 0n24
Press F10 to single step through the code.
Press F5 to finish the execution of the MixerVolumeWrite code.
Summary - Stepping through code from the Debugger Command window
The following are the commands that you can use to step through your code (with the associated keyboard short cuts shown in parentheses).
Break in (Ctrl+Break) - This command will interrupt a system as long as the system is running and is in communication with WinDbg (the sequence in the Kernel Debugger is Ctrl+C).
Step over (F10) – This command causes code execution to proceed one statement or one instruction at a time. If a call is encountered, code execution passes over the call without entering the called routine. (If the programming language is C or C++ and WinDbg is in source mode, source mode can be turned on or off using Debug>Source Mode).
Step in (F11) – This command is like step-over, except that the execution of a call does go into the called routine.
Step out (Shift+F11) – This command causes execution to run to and exit from the current routine (current place in the call stack). This is useful if you've seen enough of the routine.
Run to cursor (F7 or Ctrl+F10) – Place the cursor in a source or disassembly window where you want the execution to break, then press F7; code execution will run to that point. Note that if the flow of code execution doesn't reach the point indicated by the cursor (e.g., an IF statement isn't executed), WinDbg would not break, because the code execution didn't reach the indicated point.
Run (F5) – Run until a breakpoint is encountered or an event like a bug check occurs.
Advanced options
Set instruction to the current line (Ctrl+Shift+I) – In a source window, you can place your cursor on a line, enter this keyboard shortcut, and code execution will start from that point as soon as you let it proceed (for example using F5 or F10). This is handy if you want to retry a sequence, but it requires some care. For example, registers and variables aren't set to what they would be if code execution had reached that line naturally.
Direct setting of the eip register -- You can put a value into the eip register, and as soon as you press F5 (or F10, F11, etc.), execution commences from that address. This is similar to setting instruction to the cursor-designated current line, except that you specify the address of an assembly instruction.
It can be easier to step through UI rather than from the command line so this method is recommended. If necessary, the following commands can be used to step through a source file at the command line:
.lines - Enable source line information.
bp main - Set the initial breakpoint at the beginning of your module.
l+t - Stepping will be done by source line.
Select Debug>Source Mode to enter source mode; the
L+tcommand isn't sufficient.l+s - Source lines will be displayed at prompt.
g - Run program until "main" is entered.
p - Execute one source line.
For more information, see Source Code Debugging in WinDbg (Classic) in the debugging reference documentation.
Set breakpoints in code
You can set a breakpoint in code by adding the DebugBreak() statement and rebuilding the project and re-installing the driver. This breakpoint will fire each time the driver is enabled, so it would be a techniques to be used in the early development stages, not in production code. This technique isn't as flexible as dynamically setting breakpoints using the breakpoint commands.
Tip: You may want to keep a copy of the Sysvad driver with out the breakpoint added for further lab work.
Set a break to occur each time the AddDevice method is run by adding the
DebugBreak()statement to the sample code.... // Insert the DebugBreak() statment before the PcAddAdapterDevice is called. // DebugBreak() // Tell the class driver to add the device. // ntStatus = PcAddAdapterDevice ( DriverObject, PhysicalDeviceObject, PCPFNSTARTDEVICE(StartDevice), maxObjects, 0 ); return ntStatus; } // AddDeviceFollow all of the steps previously described to rebuild the driver in Microsoft Visual Studio and re-install it to the target machine. Be sure to uninstall the existing driver before installing the updated driver.
Clear any previous breakpoints and make sure that the debugger is attached to the target PC.
When the code runs and reaches the
DebugBreakstatement, execution will stop and a message will be displayed.KERNELBASE!DebugBreak: 77b3b770 defe __debugbreak
Section 8: Display variables
In Section 8, you'll use debugger commands to display variables.
It can be useful to examine variables as the code executes to confirm that the code is working as expected. This labs examines variables as the audio driver produces sound.
Use the dv command to examine the locale variables associated with the tabletaudiosample!CMiniportWaveRT::New*.
kd> dv tabletaudiosample!CMiniportWaveRT::New*Clear the previous breakpoints
bc *Set a symbol breakpoint on the CMiniportWaveCyclicStreamMSVAD routines using the following command.
0: kd> bm tabletaudiosample!CMiniportWaveRT::NewStream
  1: fffff801`177dffc0 @!"tabletaudiosample!CMiniportWaveRT::NewStream"
Restart code execution on the target system by typing the go command g.
-> On the target system
Locate a small media file (such as Windows notification sound file with a .wav file extension) and select the file to play it. For example you can use Ring05.wav located in the Windows\Media directory.
<- On the host system
When the media file is played, the breakpoint should fire, and execution of the driver code on the target system should halt.
Breakpoint 1 hit
tabletaudiosample!CMiniportWaveRT::NewStream:
fffff801`177dffc0 44894c2420      mov     dword ptr [rsp+20h],r9d
The source code Window should be highlighting the brace on the entrance to the NewStream function.
/*++

Routine Description:

  The NewStream function creates a new instance of a logical stream
  associated with a specified physical channel. Callers of NewStream should
  run at IRQL PASSIVE_LEVEL.

Arguments:

  OutStream -

  OuterUnknown -

  Pin -

  Capture -

  DataFormat -

Return Value:

  NT status code.

--*/
{

...
Local variables
You can display the names and values of all local variables for a given frame by typing the dv command.
0: kd> dv
                this = 0xffffe000`4436f8e0
           OutStream = 0xffffe000`49d2f130
        OuterUnknown = 0xffffe000`4436fa30
                 Pin = 0
             Capture = 0x01 '
          DataFormat = 0xffffe000`44227790
signalProcessingMode = {487E9220-E000-FFFF-30F1-D24900E0FFFF}
            ntStatus = 0n1055
              stream = 0x00000000`00000200
Use DML to Display Variables
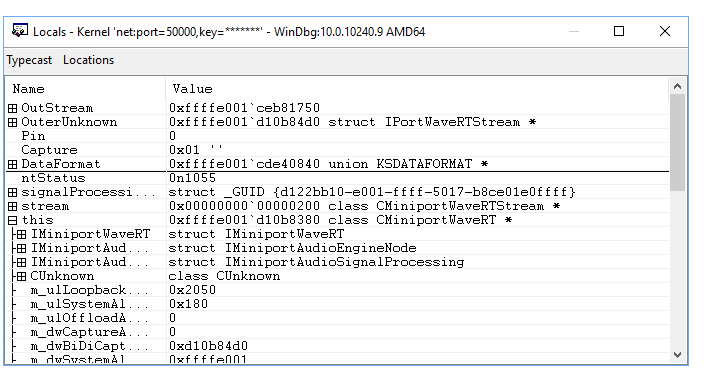
To use DML to explore variables, select the underlined elements. The select action builds a dx (Display NatVis Expression) command that allows you to drill down on nested data structures.
0: kd> dx -r1 (*((tabletaudiosample!CMiniportWaveRT *)0xffffe001d10b8380))
(*((tabletaudiosample!CMiniportWaveRT *)0xffffe001d10b8380)) :  [Type: CMiniportWaveRT]
    [+0x020] m_lRefCount      : 0
    [+0x028] m_pUnknownOuter  : 0xffffe001d1477e50 : [Type: IUnknown *]
    [+0x030] m_ulLoopbackAllocated : 0x2050
    [+0x034] m_ulSystemAllocated : 0x180
    [+0x038] m_ulOffloadAllocated : 0x0
    [+0x03c] m_dwCaptureAllocatedModes : 0x0

0: kd> dx -r1 (*((tabletaudiosample!_GUID *)0xffffd001c8acd348))
(*((tabletaudiosample!_GUID *)0xffffd001c8acd348)) : {487E9220-E000-FFFF-30F1-D24900E0FFFF} [Type: _GUID]
    [<Raw View>]

0: kd> dx -r1 -n (*((tabletaudiosample!_GUID *)0xffffd001c8acd348))
(*((tabletaudiosample!_GUID *)0xffffd001c8acd348)) :  [Type: _GUID]
    [+0x000] Data1            : 0x487e9220
    [+0x004] Data2            : 0xe000
    [+0x006] Data3            : 0xffff
    [+0x008] Data4            :  [Type: unsigned char [8]]

0: kd> dx -r1 -n (*((tabletaudiosample!unsigned char (*)[8])0xffffd001c8acd350))
(*((tabletaudiosample!unsigned char (*)[8])0xffffd001c8acd350)) :  [Type: unsigned char [8]]
    [0]              : 0x30
    [1]              : 0xf1
    [2]              : 0xd2
    [3]              : 0x49
    [4]              : 0x0
    [5]              : 0xe0
    [6]              : 0xff
    [7]              : 0xff
Global variables
You can find the memory location of a global variable by typing ? <variable name>.
0: kd> ? signalProcessingMode
Evaluate expression: -52768896396472 = ffffd001`c8acd348
This returns the memory location of the variable, in this case ffffd001`c8acd348. You can view the contents of the memory location by dumping the value of that location typing the dd command using the memory location returned by the previous command.
0: kd> dd ffffd001`c8acd348
ffffd001`c8acd348  487e9220 ffffe000 49d2f130 ffffe000
ffffd001`c8acd358  4837c468 ffffe000 18221570 ffffc000
ffffd001`c8acd368  4436f8e0 ffffe000 487e9220 ffffe000
ffffd001`c8acd378  18ab145b fffff801 4837c420 ffffe000
ffffd001`c8acd388  4436f8e0 ffffe000 49d2f130 ffffe000
ffffd001`c8acd398  4436fa30 ffffe000 00000000 00000000
ffffd001`c8acd3a8  00000001 00000000 44227790 ffffe000
ffffd001`c8acd3b8  18adc7f9 fffff801 495972a0 ffffe000
You can also use variable names with the dd command.
0: kd> dd signalProcessingMode
ffffd001`c8acd348  487e9220 ffffe000 49d2f130 ffffe000
ffffd001`c8acd358  4837c468 ffffe000 18221570 ffffc000
ffffd001`c8acd368  4436f8e0 ffffe000 487e9220 ffffe000
ffffd001`c8acd378  18ab145b fffff801 4837c420 ffffe000
ffffd001`c8acd388  4436f8e0 ffffe000 49d2f130 ffffe000
ffffd001`c8acd398  4436fa30 ffffe000 00000000 00000000
ffffd001`c8acd3a8  00000001 00000000 44227790 ffffe000
ffffd001`c8acd3b8  18adc7f9 fffff801 495972a0 ffffe000
Display variables
Use the View> Locals menu item to display local variables. This interface also provides this ability to drill down on more complex data structures.
Use p or F10 to step forward about 10 lines in the code until you're highlighting the ntStatus = IsFormatSupported(Pin, Capture, DataFormat); line of code.
    PAGED_CODE();

    ASSERT(OutStream);
    ASSERT(DataFormat);

    DPF_ENTER(("[CMiniportWaveRT::NewStream]"));

    NTSTATUS                    ntStatus = STATUS_SUCCESS;
    PCMiniportWaveRTStream      stream = NULL;
    GUID                        signalProcessingMode = AUDIO_SIGNALPROCESSINGMODE_DEFAULT;

    *OutStream = NULL;

     //
    // If the data format attributes were specified, extract them.
    //
    if ( DataFormat->Flags & KSDATAFORMAT_ATTRIBUTES )
    {
        // The attributes are aligned (QWORD alignment) after the data format
        PKSMULTIPLE_ITEM attributes = (PKSMULTIPLE_ITEM) (((PBYTE)DataFormat) + ((DataFormat->FormatSize + FILE_QUAD_ALIGNMENT) & ~FILE_QUAD_ALIGNMENT));
        ntStatus = GetAttributesFromAttributeList(attributes, attributes->Size, &signalProcessingMode);
    }

    // Check if we have enough streams.
    //
    if (NT_SUCCESS(ntStatus))
    {
        ntStatus = ValidateStreamCreate(Pin, Capture, signalProcessingMode);
    }

    // Determine if the format is valid.
    //
    if (NT_SUCCESS(ntStatus))
    {
        ntStatus = IsFormatSupported(Pin, Capture, DataFormat);
    }

...
Use the dv command to display the names and values of all local variables for a given frame. Note that, as expected, the values are different from the last time we ran this command, as additional code has been run that changes the local variables and some variables are now not in the current frame or their values have changed.
2: kd> dv
                this = 0xffffe001`d1182000
           OutStream = 0xffffe001`d4776d20
        OuterUnknown = 0xffffe001`d4776bc8
                 Pin = 0
             Capture = 0x00 '
          DataFormat = 0xffffe001`cd7609b0
signalProcessingMode = {4780004E-7133-41D8-8C74-660DADD2C0EE}
            ntStatus = 0n0
              stream = 0x00000000`00000000
Section 9: View call stacks
In Section 9, you'll view call stacks to examine caller/callee code.
The call stack is the chain of function calls that have led to the current location of the program counter. The top function on the call stack is the current function, and the next function is the function that called the current function, and so on.
To display the call stack, use the k* commands:
kb |
Displays the stack and first three parameters. |
kp |
Displays the stacks and the full list of parameters. |
kn |
Allows you to see the stack with the frame information next to it. |
If you want to keep the call stack available, you can select View> Call stack to view it. Select the columns at the top of the window to toggle the display of additional information.
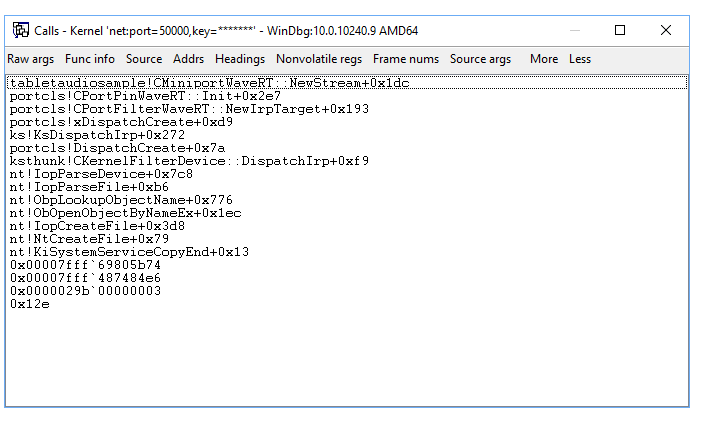
This output shows the call stack while debugging the sample adapter code in a break state.
0: kd> kb
# RetAddr           : Args to Child                                                           : Call Site
00 fffff800`7a0fa607 : ffffe001`d1182000 ffffe001`d4776d20 ffffe001`d4776bc8 ffffe001`00000000 : tabletaudiosample!CMiniportWaveRT::NewStream+0x1dc [c:\data1\threshold\audio\endpointscommon\minwavert.cpp @ 597]
01 fffff800`7a0fb2c3 : 00000000`00000000 ffffe001`d122bb10 ffffe001`ceb81750 ffffe001`d173f058 : portcls!CPortPinWaveRT::Init+0x2e7
02 fffff800`7a0fc7f9 : ffffe001`d4776bc0 00000000`00000000 ffffe001`d10b8380 ffffe001`d122bb10 : portcls!CPortFilterWaveRT::NewIrpTarget+0x193
03 fffff800`7a180552 : 00000000`00000000 ffffe001`d10b8380 ffffe001`d122bb10 ffffe001`d4565600 : portcls!xDispatchCreate+0xd9
04 fffff800`7a109a9a : ffffe001`d10b84d0 ffffe001`d10b8380 00000000`00000000 ffffe001`00000000 : ks!KsDispatchIrp+0x272
05 fffff800`7bd314b1 : ffffe001`d122bb10 ffffd001`c3098590 ffffe001`d122bd90 ffffe001`ce80da70 : portcls!DispatchCreate+0x7a
06 fffff803`cda1bfa8 : 00000000`00000024 00000000`00000000 00000000`00000000 ffffe001`d122bb10 : ksthunk!CKernelFilterDevice::DispatchIrp+0xf9
07 fffff803`cda7b306 : 00000000`000001f0 ffffe001`d48ce690 ffffe001`d13d6400 ffffe001`d13d64c0 : nt!IopParseDevice+0x7c8
08 fffff803`cda12916 : 00000000`000001f0 ffffd001`c30988d0 ffffe001`d13d6490 fffff803`cda7b250 : nt!IopParseFile+0xb6
09 fffff803`cda1131c : ffffe001`d2ccb001 ffffd001`c30989e0 00ffffe0`00000040 ffffe001`cd127dc0 : nt!ObpLookupObjectName+0x776
0a fffff803`cd9fedb8 : ffffe001`00000001 ffffe001`d48ce690 00000000`00000000 00000000`00000000 : nt!ObOpenObjectByNameEx+0x1ec
0b fffff803`cd9fe919 : 000000ee`6d1fc8d8 000000ee`6d1fc788 000000ee`6d1fc7e0 000000ee`6d1fc7d0 : nt!IopCreateFile+0x3d8
0c fffff803`cd752fa3 : ffffc000`1f296870 fffff803`cd9d9fbd ffffd001`c3098be8 00000000`00000000 : nt!NtCreateFile+0x79
0d 00007fff`69805b74 : 00007fff`487484e6 0000029b`00000003 00000000`0000012e 00000000`00000000 : nt!KiSystemServiceCopyEnd+0x13
0e 00007fff`487484e6 : 0000029b`00000003 00000000`0000012e 00000000`00000000 00000000`00000000 : 0x00007fff`69805b74
0f 0000029b`00000003 : 00000000`0000012e 00000000`00000000 00000000`00000000 00000000`00000000 : 0x00007fff`487484e6
10 00000000`0000012e : 00000000`00000000 00000000`00000000 00000000`00000000 00000000`00000080 : 0x0000029b`00000003
11 00000000`00000000 : 00000000`00000000 00000000`00000000 00000000`00000080 00000000`00000000 : 0x12e
You can use DML to further explore the code. When you select the first 00 entry, the .frame (Set Local Context) command is used to set the context and then, the dv (Display Local Variables) command displays the local variables.
0: kd> .frame 0n0;dv /t /v
00 ffffd001`c30981d0 fffff800`7a0fa607 tabletaudiosample!CMiniportWaveRT::NewStream+0x1dc [c:\data1\threshold\audio\endpointscommon\minwavert.cpp @ 597]
ffffd001`c30982b0 class CMiniportWaveRT * this = 0xffffe001`d1182000
ffffd001`c30982b8 struct IMiniportWaveRTStream ** OutStream = 0xffffe001`d4776d20
ffffd001`c30982c0 struct IPortWaveRTStream * OuterUnknown = 0xffffe001`d4776bc8
ffffd001`c30982c8 unsigned long Pin = 0
ffffd001`c30982d0 unsigned char Capture = 0x00 '
ffffd001`c30982d8 union KSDATAFORMAT * DataFormat = 0xffffe001`cd7609b0
ffffd001`c3098270 struct _GUID signalProcessingMode = {4780004E-7133-41D8-8C74-660DADD2C0EE}
ffffd001`c3098210 long ntStatus = 0n0
ffffd001`c3098218 class CMiniportWaveRTStream * stream = 0x00000000`00000000
Section 10: Display processes and threads
In Section 10, you'll use debugger commands to display processes and threads.
Process
To change the current process context, use the .process <process> command. The following example demonstrates how to identify a process and switch context to it.
Use the
!processcommand to display the current process that is involved in playing the sound.For more information see !process
The output shows that the process is associated with audiodg.exe. If you're still at the breakpoint described in the previous section of this topic, the current process should be associated with the audiodg.exe image.
<- On the host system
0: kd> !process
PROCESS ffffe001d147c840
    SessionId: 0  Cid: 10f0    Peb: ee6cf8a000  ParentCid: 0434
    DirBase: d2122000  ObjectTable: ffffc0001f191ac0  HandleCount: <Data Not Accessible>
    Image: audiodg.exe
    VadRoot ffffe001d4222f70 Vads 70 Clone 0 Private 504. Modified 16. Locked 0.
    DeviceMap ffffc00019113080
    Token                             ffffc0001f1d4060
    ElapsedTime                       <Invalid>
    UserTime                          00:00:00.000
    KernelTime                        00:00:00.000
    QuotaPoolUsage[PagedPool]         81632
    QuotaPoolUsage[NonPagedPool]      9704
    Working Set Sizes (now,min,max)  (2154, 1814, 2109) (8616KB, 7256KB, 8436KB)
    PeakWorkingSetSize                2101
    VirtualSize                       2097192 Mb
    PeakVirtualSize                   2097192 Mb
    PageFaultCount                    2336
    MemoryPriority                    BACKGROUND
    BasePriority                      8
    CommitCharge                      1573

        THREAD ffffe001d173e840  Cid 10f0.1dac  Teb: 000000ee6cf8b000 Win32Thread: ffffe001d1118cf0 WAIT: (UserRequest) UserMode Non-Alertable
            ffffe001d16c4dd0  NotificationEvent
            ffffe001d08b0840  ProcessObject

        THREAD ffffe001ceb77080  Cid 10f0.16dc  Teb: 000000ee6cf8d000 Win32Thread: 0000000000000000 WAIT: (WrQueue) UserMode Alertable
            ffffe001cf2d1840  QueueObject

        THREAD ffffe001d112c840  Cid 10f0.0a4c  Teb: 000000ee6cf8f000 Win32Thread: 0000000000000000 WAIT: (WrQueue) UserMode Alertable
            ffffe001cf2d1840  QueueObject

        THREAD ffffe001d16c7840  Cid 10f0.13c4  Teb: 000000ee6cf91000 Win32Thread: 0000000000000000 WAIT: (WrQueue) UserMode Alertable
            ffffe001cf2d1840  QueueObject

        THREAD ffffe001cec67840  Cid 10f0.0dbc  Teb: 000000ee6cf93000 Win32Thread: 0000000000000000 WAIT: (WrQueue) UserMode Alertable
            ffffe001d173e5c0  QueueObject

        THREAD ffffe001d1117840  Cid 10f0.1d6c  Teb: 000000ee6cf95000 Win32Thread: 0000000000000000 WAIT: (WrQueue) UserMode Alertable
            ffffe001d173e5c0  QueueObject

        THREAD ffffe001cdeae840  Cid 10f0.0298  Teb: 000000ee6cf97000 Win32Thread: 0000000000000000 RUNNING on processor 2
Note that one of the threads associated with this process is in the RUNNING state. This thread was supporting the playing of the media clip when the breakpoint was hit.
Use the !process 0 0 command to display summary information for all processes. In the command output use CTRL+F to locate the process ID for the process associated with the audiodg.exe image. In the example shown below, the process ID is ffffe001d147c840.
Record the process ID associated with audiodg.exe on your PC to use later in this lab. ________________________
...

PROCESS ffffe001d147c840
    SessionId: 0  Cid: 10f0    Peb: ee6cf8a000  ParentCid: 0434
    DirBase: d2122000  ObjectTable: ffffc0001f191ac0  HandleCount: <Data Not Accessible>
    Image: audiodg.exe
...
Enter g into the debugger to run the code forward until the media clip is done playing. Then break in to the debugger, by pressing Ctrl+ScrLk (Ctrl+Break) Use the !process command to confirm that you're now running a different process.
!process
PROCESS ffffe001cd0ad040
    SessionId: none  Cid: 0004    Peb: 00000000  ParentCid: 0000
    DirBase: 001aa000  ObjectTable: ffffc00017214000  HandleCount: <Data Not Accessible>
    Image: System
    VadRoot ffffe001d402b820 Vads 438 Clone 0 Private 13417. Modified 87866. Locked 64.
    DeviceMap ffffc0001721a070
    Token                             ffffc00017216a60
    ElapsedTime                       05:04:54.716
    UserTime                          00:00:00.000
    KernelTime                        00:00:20.531
    QuotaPoolUsage[PagedPool]         0
    QuotaPoolUsage[NonPagedPool]      0
    Working Set Sizes (now,min,max)  (1720, 50, 450) (6880KB, 200KB, 1800KB)
    PeakWorkingSetSize                15853
    VirtualSize                       58 Mb
    PeakVirtualSize                   74 Mb
    PageFaultCount                    46128
   MemoryPriority                    BACKGROUND
    BasePriority                      8
    CommitCharge                      66

        THREAD ffffe001cd0295c0  Cid 0004.000c  Teb: 0000000000000000 Win32Thread: 0000000000000000 WAIT: (Executive) KernelMode Non-Alertable
            fffff803cd8e0120  SynchronizationEvent

        THREAD ffffe001cd02a6c0  Cid 0004.0010  Teb: 0000000000000000 Win32Thread: 0000000000000000 WAIT: (Executive) KernelMode Non-Alertable
            fffff803cd8e0ba0  Semaphore Limit 0x7fffffff
...
The output above shows that a different system process of ffffe001cd0ad040 is running. The image name shows System, not audiodg.exe.
Now use the !process command to switch to the process that was associated with audiodg.exe. In the example, the process ID is ffffe001d147c840. Substitute the process ID in the example with your process ID, that you recorded earlier.
0: kd> !process  ffffe001d147c840
PROCESS ffffe001d147c840
    SessionId: 0  Cid: 10f0    Peb: ee6cf8a000  ParentCid: 0434
    DirBase: d2122000  ObjectTable: ffffc0001f191ac0  HandleCount: <Data Not Accessible>
    Image: audiodg.exe
    VadRoot ffffe001d4222f70 Vads 60 Clone 0 Private 299. Modified 152. Locked 0.
    DeviceMap ffffc00019113080
    Token                             ffffc0001f1d4060
    ElapsedTime                       1 Day 01:53:14.490
    UserTime                          00:00:00.031
    KernelTime                        00:00:00.031
    QuotaPoolUsage[PagedPool]         81552
    QuotaPoolUsage[NonPagedPool]      8344
    Working Set Sizes (now,min,max)  (1915, 1814, 2109) (7660KB, 7256KB, 8436KB)
    PeakWorkingSetSize                2116
    VirtualSize                       2097189 Mb
    PeakVirtualSize                   2097192 Mb
    PageFaultCount                    2464
    MemoryPriority                    BACKGROUND
    BasePriority                      8
    CommitCharge                      1418

        THREAD ffffe001d173e840  Cid 10f0.1dac  Teb: 000000ee6cf8b000 Win32Thread: ffffe001d1118cf0 WAIT: (UserRequest) UserMode Non-Alertable
            ffffe001d16c4dd0  NotificationEvent
            ffffe001d08b0840  ProcessObject
        Not impersonating
        DeviceMap                 ffffc00019113080
        Owning Process            ffffe001d147c840       Image:         audiodg.exe
        Attached Process          N/A            Image:         N/A
        Wait Start TickCount      338852         Ticks: 197682 (0:00:51:28.781)
        Context Switch Count      36             IdealProcessor: 0
        UserTime                  00:00:00.015
        KernelTime                00:00:00.000
        Win32 Start Address 0x00007ff7fb928de0
        Stack Init ffffd001c2ec6dd0 Current ffffd001c2ec60c0
        Base ffffd001c2ec7000 Limit ffffd001c2ec1000 Call 0
        Priority 8 BasePriority 8 UnusualBoost 0 ForegroundBoost 0 IoPriority 2 PagePriority 5
        Kernel stack not resident.

        THREAD ffffe001d115c080  Cid 10f0.15b4  Teb: 000000ee6cf9b000 Win32Thread: 0000000000000000 WAIT: (WrQueue) UserMode Alertable
            ffffe001d0bf0640  QueueObject
        Not impersonating
        DeviceMap                 ffffc00019113080
        Owning Process            ffffe001d147c840       Image:         audiodg.exe
        Attached Process          N/A            Image:         N/A
        Wait Start TickCount      338852         Ticks: 197682 (0:00:51:28.781)
        Context Switch Count      1              IdealProcessor: 0
        UserTime                  00:00:00.000
        KernelTime                00:00:00.000
        Win32 Start Address 0x00007fff6978b350
        Stack Init ffffd001c3143dd0 Current ffffd001c3143520
        Base ffffd001c3144000 Limit ffffd001c313e000 Call 0
        Priority 8 BasePriority 8 UnusualBoost 0 ForegroundBoost 0 IoPriority 2 PagePriority 5
        Kernel stack not resident.

        THREAD ffffe001d3a27040  Cid 10f0.17f4  Teb: 000000ee6cf9d000 Win32Thread: 0000000000000000 WAIT: (WrQueue) UserMode Alertable
            ffffe001d173e5c0  QueueObject
        Not impersonating
        DeviceMap                 ffffc00019113080
        Owning Process            ffffe001d147c840       Image:         audiodg.exe
        Attached Process          N/A            Image:         N/A
        Wait Start TickCount      518918         Ticks: 17616 (0:00:04:35.250)
        Context Switch Count      9              IdealProcessor: 1
        UserTime                  00:00:00.000
        KernelTime                00:00:00.000
        Win32 Start Address 0x00007fff6978b350
        Stack Init ffffd001c70c6dd0 Current ffffd001c70c6520
        Base ffffd001c70c7000 Limit ffffd001c70c1000 Call 0
        Priority 9 BasePriority 8 UnusualBoost 0 ForegroundBoost 0 IoPriority 2 PagePriority 5
        Kernel stack not resident.
Because this code isn't active, all of the threads are in WAIT state, as expected.
Threads
The commands to view and set threads are very similar to those of processes. Use the !thread command to view threads. Use .thread to set the current threads.
To explore threads associated with the media player, play the media clip again. If the breakpoint described in the previous section is still in place, you'll stop in the context of audiodg.exe.
Use the !thread -1 0 to display brief information for the current thread. This shows the thread address, the thread and process IDs, the thread environment block (TEB) address, the address of the Win32 function (if any) the thread was created to run, and the thread’s scheduling state.
0: kd> !thread -1 0
THREAD ffffe001d3a27040  Cid 10f0.17f4  Teb: 000000ee6cf9d000 Win32Thread: 0000000000000000 RUNNING on processor 0
To view more information about the thread that is running, type !thread. Information similar to the following should be displayed.
0: kd> !thread
THREAD ffffe001d3a27040  Cid 10f0.17f4  Teb: 000000ee6cf9d000 Win32Thread: 0000000000000000 RUNNING on processor 0
IRP List:
    ffffe001d429e580: (0006,02c8) Flags: 000008b4  Mdl: 00000000
Not impersonating
DeviceMap                 ffffc00019113080
Owning Process            ffffe001d147c840       Image:         audiodg.exe
Attached Process          N/A            Image:         N/A
Wait Start TickCount      537630         Ticks: 0
Context Switch Count      63             IdealProcessor: 1
UserTime                  00:00:00.000
KernelTime                00:00:00.015
Win32 Start Address 0x00007fff6978b350
Stack Init ffffd001c70c6dd0 Current ffffd001c70c6520
Base ffffd001c70c7000 Limit ffffd001c70c1000 Call 0
Priority 8 BasePriority 8 UnusualBoost 0 ForegroundBoost 0 IoPriority 2 PagePriority 5
Child-SP          RetAddr           : Args to Child                                                           : Call Site
ffffd001`c70c62a8 fffff800`7a0fa607 : ffffe001`d4aec5c0 ffffe001`cdefd3d8 ffffe001`d4aec5c0 ffffe001`cdefd390 : tabletaudiosample!CMiniportWaveRT::NewStream [c:\data1\threshold\audio\endpointscommon\minwavert.cpp @ 562]
ffffd001`c70c62b0 fffff800`7a0fb2c3 : 00000000`00000000 ffffe001`d429e580 ffffe001`d4ea47b0 ffffe001`cdefd3d8 : portcls!CPortPinWaveRT::Init+0x2e7
ffffd001`c70c6340 fffff800`7a0fc7f9 : ffffe001`d4aec430 00000000`00000000 ffffe001`d10b8380 ffffe001`d429e580 : portcls!CPortFilterWaveRT::NewIrpTarget+0x193
ffffd001`c70c63c0 fffff800`7a180552 : 00000000`00000000 ffffe001`d10b8380 ffffe001`d429e580 ffffe001`d4565600 : portcls!xDispatchCreate+0xd9
ffffd001`c70c6450 fffff800`7a109a9a : ffffe001`d10b84d0 ffffe001`d10b8380 00000000`00000000 ffffe001`00000000 : ks!KsDispatchIrp+0x272
ffffd001`c70c6510 fffff800`7bd314b1 : ffffe001`d429e580 ffffd001`c70c6590 ffffe001`d429e800 ffffe001`ce80da70 : portcls!DispatchCreate+0x7a
ffffd001`c70c6540 fffff803`cda1bfa8 : 00000000`00000025 00000000`00000000 00000000`00000000 ffffe001`d429e580 : ksthunk!CKernelFilterDevice::DispatchIrp+0xf9
ffffd001`c70c65a0 fffff803`cda7b306 : 00000000`000002fc ffffe001`d5e0d510 00000000`00000000 ffffe001`d3341bd0 : nt!IopParseDevice+0x7c8
ffffd001`c70c6770 fffff803`cda12916 : 00000000`000002fc ffffd001`c70c68d0 ffffe001`d3341ba0 fffff803`cda7b250 : nt!IopParseFile+0xb6
ffffd001`c70c67d0 fffff803`cda1131c : ffffe001`ceb6c601 ffffd001`c70c69e0 00000000`00000040 ffffe001`cd127dc0 : nt!ObpLookupObjectName+0x776
ffffd001`c70c6970 fffff803`cd9fedb8 : ffff8ab8`00000001 ffffe001`d5e0d510 00000000`00000000 00000000`00000000 : nt!ObOpenObjectByNameEx+0x1ec
ffffd001`c70c6a90 fffff803`cd9fe919 : 000000ee`6d37c6e8 00000004`6d37c500 000000ee`6d37c5f0 000000ee`6d37c5e0 : nt!IopCreateFile+0x3d8
ffffd001`c70c6b40 fffff803`cd752fa3 : fffff6fb`7da05360 fffff6fb`40a6c0a8 fffff681`4d815760 ffff8ab8`92895e23 : nt!NtCreateFile+0x79
ffffd001`c70c6bd0 00007fff`69805b74 : 00007fff`487484e6 0000029b`00000003 00000000`0000012e 00000000`00000000 : nt!KiSystemServiceCopyEnd+0x13 (TrapFrame @ ffffd001`c70c6c40)
000000ee`6d37c568 00007fff`487484e6 : 0000029b`00000003 00000000`0000012e 00000000`00000000 00000000`00000000 : 0x00007fff`69805b74
000000ee`6d37c570 0000029b`00000003 : 00000000`0000012e 00000000`00000000 00000000`00000000 00000000`00000000 : 0x00007fff`487484e6
000000ee`6d37c578 00000000`0000012e : 00000000`00000000 00000000`00000000 00000000`00000000 00000000`00000080 : 0x0000029b`00000003
000000ee`6d37c580 00000000`00000000 : 00000000`00000000 00000000`00000000 00000000`00000080 00000000`00000000 : 0x12e
Use the k command to view the call stack associated with the thread.
0: kd> k
# Child-SP          RetAddr           Call Site
00 ffffd001`c70c62a8 fffff800`7a0fa607 tabletaudiosample!CMiniportWaveRT::NewStream [c:\data1\threshold\audio\endpointscommon\minwavert.cpp @ 562]
01 ffffd001`c70c62b0 fffff800`7a0fb2c3 portcls!CPortPinWaveRT::Init+0x2e7
02 ffffd001`c70c6340 fffff800`7a0fc7f9 portcls!CPortFilterWaveRT::NewIrpTarget+0x193
03 ffffd001`c70c63c0 fffff800`7a180552 portcls!xDispatchCreate+0xd9
04 ffffd001`c70c6450 fffff800`7a109a9a ks!KsDispatchIrp+0x272
05 ffffd001`c70c6510 fffff800`7bd314b1 portcls!DispatchCreate+0x7a
06 ffffd001`c70c6540 fffff803`cda1bfa8 ksthunk!CKernelFilterDevice::DispatchIrp+0xf9
07 ffffd001`c70c65a0 fffff803`cda7b306 nt!IopParseDevice+0x7c8
08 ffffd001`c70c6770 fffff803`cda12916 nt!IopParseFile+0xb6
09 ffffd001`c70c67d0 fffff803`cda1131c nt!ObpLookupObjectName+0x776
0a ffffd001`c70c6970 fffff803`cd9fedb8 nt!ObOpenObjectByNameEx+0x1ec
0b ffffd001`c70c6a90 fffff803`cd9fe919 nt!IopCreateFile+0x3d8
0c ffffd001`c70c6b40 fffff803`cd752fa3 nt!NtCreateFile+0x79
0d ffffd001`c70c6bd0 00007fff`69805b74 nt!KiSystemServiceCopyEnd+0x13
0e 000000ee`6d37c568 00007fff`487484e6 0x00007fff`69805b74
0f 000000ee`6d37c570 0000029b`00000003 0x00007fff`487484e6
10 000000ee`6d37c578 00000000`0000012e 0x0000029b`00000003
11 000000ee`6d37c580 00000000`00000000 0x12e
Enter g into the debugger to run the code forward until the media clip is done playing. Then break in to the debugger, by pressing Ctrl - ScrLk (Ctrl-Break) Use the !thread command to confirm that you're now running a different thread.
0: kd> !thread
THREAD ffffe001ce80b840  Cid 17e4.01ec  Teb: 00000071fa9b9000 Win32Thread: ffffe001d41690d0 RUNNING on processor 0
Not impersonating
DeviceMap                 ffffc0001974e2c0
Owning Process            ffffe001d1760840       Image:         rundll32.exe
Attached Process          N/A            Image:         N/A
Wait Start TickCount      538040         Ticks: 0
Context Switch Count      3181840        IdealProcessor: 0
UserTime                  00:00:08.250
KernelTime                00:00:10.796
Win32 Start Address 0x00007ff6d2f24270
Stack Init ffffd001cd16afd0 Current ffffd001cd16a730
Base ffffd001cd16b000 Limit ffffd001cd165000 Call 0
Priority 8 BasePriority 8 UnusualBoost 0 ForegroundBoost 0 IoPriority 2 PagePriority 5

Child-SP          RetAddr           : Args to Child                                                           : Call Site
fffff803`cf373d18 fffff800`7a202852 : fffff803`cf373e60 00000000`00000001 ffffe001`cf4ed330 00000000`0000ffff : nt!DbgBreakPointWithStatus
fffff803`cf373d20 fffff803`cd6742c6 : ffffe001`cf4ed2f0 fffff803`cf373e60 00000000`00000001 00000000`0004e4b8 : kdnic!TXSendCompleteDpc+0x142
fffff803`cf373d60 fffff803`cd74d495 : 00000000`00000000 fffff803`cd923180 fffff803`cde1f4b0 fffff901`40669010 : nt!KiRetireDpcList+0x5f6
fffff803`cf373fb0 fffff803`cd74d2a0 : 00000000`00000090 0000000e`0000006a 00000000`00000092 00000000`00000000 : nt!KxRetireDpcList+0x5 (TrapFrame @ fffff803`cf373e70)
ffffd001`cd16a6c0 fffff803`cd74bd75 : 00000000`00000000 fffff803`cd74a031 00000000`00000000 00000000`00000000 : nt!KiDispatchInterruptContinue
ffffd001`cd16a6f0 fffff803`cd74a031 : 00000000`00000000 00000000`00000000 ffffe001`cff4d2a0 fffff803`cd67738e : nt!KiDpcInterruptBypass+0x25
ffffd001`cd16a700 fffff960`50cdb5a4 : fffff901`400006d0 00000000`00000001 fffff901`40000d60 ffffd001`cd16a9f0 : nt!KiInterruptDispatchNoLockNoEtw+0xb1 (TrapFrame @ ffffd001`cd16a700)
ffffd001`cd16a890 fffff960`50c66b2f : 00000000`00000000 fffff901`40669010 fffff901`42358580 fffff901`40000d60 : win32kfull!Win32FreePoolImpl+0x34
ffffd001`cd16a8c0 fffff960`50c68cd6 : 00000000`00000000 ffffd001`cd16a9f0 fffff901`400006d0 fffff901`400c0460 : win32kfull!EXLATEOBJ::vAltUnlock+0x1f
ffffd001`cd16a8f0 fffff803`cd752fa3 : 00000000`00000000 00000000`00000000 ffffe001`ce80b840 00000000`00000000 : win32kfull!NtGdiAlphaBlend+0x1d16
ffffd001`cd16add0 00007fff`674c1494 : 00007fff`674b1e97 0000a7c6`daee0559 00000000`00000001 0000020b`741f3c50 : nt!KiSystemServiceCopyEnd+0x13 (TrapFrame @ ffffd001`cd16ae40)
00000071`fa74c9a8 00007fff`674b1e97 : 0000a7c6`daee0559 00000000`00000001 0000020b`741f3c50 00000000`00ffffff : 0x00007fff`674c1494
00000071`fa74c9b0 0000a7c6`daee0559 : 00000000`00000001 0000020b`741f3c50 00000000`00ffffff 00000000`00000030 : 0x00007fff`674b1e97
00000071`fa74c9b8 00000000`00000001 : 0000020b`741f3c50 00000000`00ffffff 00000000`00000030 00000000`01010bff : 0x0000a7c6`daee0559
00000071`fa74c9c0 0000020b`741f3c50 : 00000000`00ffffff 00000000`00000030 00000000`01010bff 00000000`00000000 : 0x1
00000071`fa74c9c8 00000000`00ffffff : 00000000`00000030 00000000`01010bff 00000000`00000000 00000000`000000c0 : 0x0000020b`741f3c50
00000071`fa74c9d0 00000000`00000030 : 00000000`01010bff 00000000`00000000 00000000`000000c0 00000000`00000030 : 0xffffff
00000071`fa74c9d8 00000000`01010bff : 00000000`00000000 00000000`000000c0 00000000`00000030 00000071`00000030 : 0x30
00000071`fa74c9e0 00000000`00000000 : 00000000`000000c0 00000000`00000030 00000071`00000030 00000071`01ff8000 : 0x1010bff
The image name is rundll32.exe, which is indeed not the image name associated with playing the media clip.
Note To set the current thread, type .thread <thread number>.
For more information about threads and processes, see the following references:
Section 11: IRQL, registers, and disassembly
View the saved IRQL
In Section 11, you'll display the IRQL, and the contents of the regsisters.
<- On the host system
The interrupt request level (IRQL) is used to manage the priority of interrupt servicing. Each processor has an IRQL setting that threads can raise or lower. Interrupts that occur at or below the processor's IRQL setting are masked and will not interfere with the current operation. Interrupts that occur above the processor's IRQL setting take precedence over the current operation. The !irql extension displays the interrupt request level (IRQL) on the current processor of the target computer before the debugger break occurred. When the target computer breaks into the debugger, the IRQL changes, but the IRQL that was effective just before the debugger break is saved and is displayed by !irql.
0: kd> !irql
Debugger saved IRQL for processor 0x0 -- 2 (DISPATCH_LEVEL)
<View the registers and disassembly
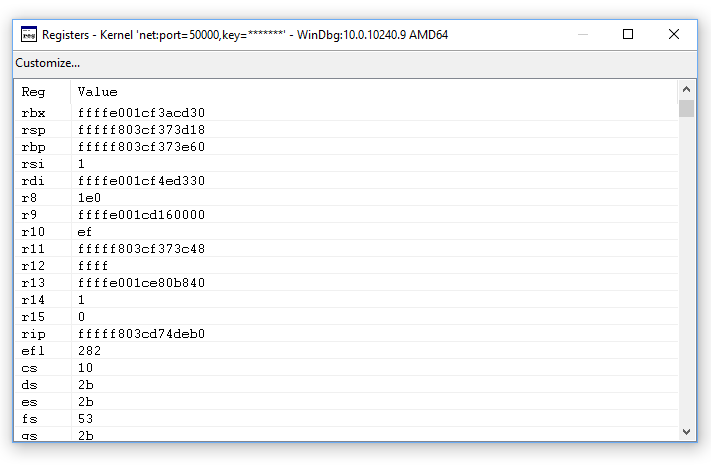
View the registers
Display the contents of the registers for the current thread on the current processor by using the r (Registers) command.
0: kd> r
rax=000000000000c301 rbx=ffffe00173eed880 rcx=0000000000000001
rdx=000000d800000000 rsi=ffffe00173eed8e0 rdi=ffffe00173eed8f0
rip=fffff803bb757020 rsp=ffffd001f01f8988 rbp=ffffe00173f0b620
 r8=000000000000003e  r9=ffffe00167a4a000 r10=000000000000001e
r11=ffffd001f01f88f8 r12=0000000000000000 r13=ffffd001f01efdc0
r14=0000000000000001 r15=0000000000000000
iopl=0         nv up ei pl nz na pe nc
cs=0010  ss=0018  ds=002b  es=002b  fs=0053  gs=002b             efl=00000202
nt!DbgBreakPointWithStatus:
fffff803`bb757020 cc              int     3
Alternatively, you can display the contents of the registers by selecting View > Registers.
Viewing the contents of the registers can be helpful when stepping through assembly language code execution and in other scenarios. For more information see r (Registers).
For information about contents of the register, see x86 Architecture and x64 Architecture.
Disassembly
You can disassemble the code that is under execution to view the assembly language code that is being run by selecting View > Disassembly.

For more information about assembly language disassembly, see Annotated x86 Disassembly and Annotated x64 Disassembly.
Section 12: Work with memory
In Section 12, you'll use debugger commands to display the contents of memory.
View memory
You may need to examine memory to identify an issue or to inspect variables, pointers, and so on. You can display memory by typing one of the following d* <address> commands.
db |
Displays data in byte values and ASCII characters. |
dd |
Displays data as double wide words (4 bytes). |
du |
Displays data as Unicode characters. |
dw |
Displays data as word values (2 bytes) and ASCII characters. |
Note If you attempt to display an invalid address, its contents are shown as question marks (?).
Alternatively, you can view the memory by selecting View > Memory. Use the Display format pull down to change how the memory is displayed.
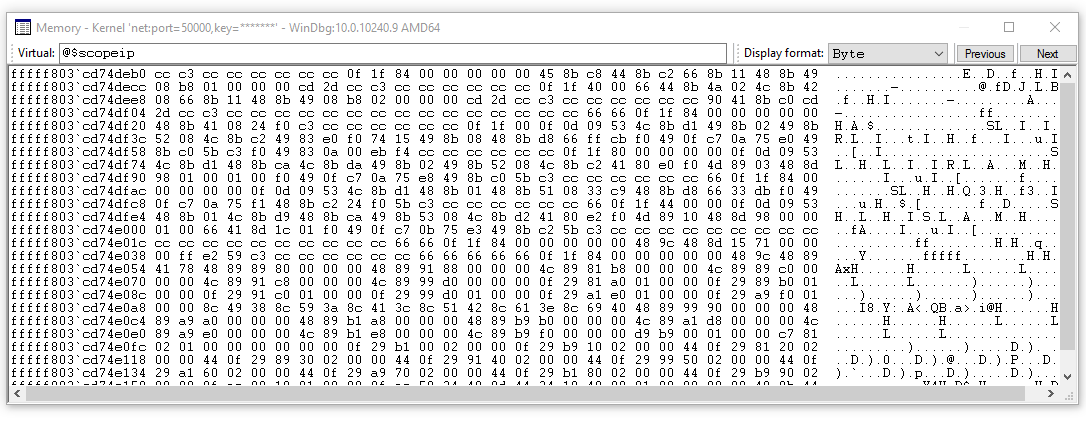
To view data associated with the volume control, set a breakpoint to fire on the PropertyHandlerAudioEngineVolumeLevel routine using the bm command. Before we set the new breakpoint, we will clear all of the previous breakpoints using bc *.
kd> bc *Set a breakpoint to fire on the PropertyHandlerAudioEngineVolumeLevel routine using the bm command.
kd> bm tabletaudiosample!CMiniportWaveRT::SetDeviceChannelVolume
  1: fffff80f`02c3a4b0 @!"tabletaudiosample!CMiniportWaveRT::SetDeviceChannelVolume"
List the breakpoints to confirm that the breakpoint is set properly.
kd> bl
  1: fffff80f`02c3a4b0 @!"tabletaudiosample!CMiniportWaveRT::SetDeviceChannelVolume"
Use the g command to restart code execution.
On the target system adjust the volume in the system tray. This will cause the breakpoint to fire.
Breakpoint 1 hit
tabletaudiosample!CMiniportWaveRT::SetDeviceChannelVolume:
fffff80f`02c3a4b0 44894c2420      mov     dword ptr [rsp+20h],r9d
Use the View> Local menu item to display local variables. Note the current value of the IVolume variable.
You can display the data type and the current value for the IVolume variable in the sample code by typing the dt command and the name of the variable.
kd> dt lVolume
Local var @ 0xa011ea50 Type long
0n-6291456
The breakpoint is hit on entering SetDeviceChannelVolume.
STDMETHODIMP_(NTSTATUS) CMiniportWaveRT::SetDeviceChannelVolume(_In_  ULONG _ulNodeId, _In_ UINT32 _uiChannel, _In_  LONG  _Volume)
{
    NTSTATUS ntStatus = STATUS_INVALID_DEVICE_REQUEST;

    PAGED_CODE ();

    DPF_ENTER(("[CMiniportWaveRT::SetEndpointChannelVolume]"));
    IF_TRUE_ACTION_JUMP(_ulNodeId != KSNODE_WAVE_AUDIO_ENGINE, ntStatus = STATUS_INVALID_DEVICE_REQUEST, Exit);

    // Snap the volume level to our range of steppings.
    LONG lVolume = VOLUME_NORMALIZE_IN_RANGE(_Volume);

    ntStatus = SetChannelVolume(_uiChannel, lVolume);
Exit:
    return ntStatus;
}
Attempt to display the value at the memory location of IVolume by using the dt (Display Type) command.
kd> dt dt lVolume
Local var @ 0xffffb780b7eee664 Type long
0n0
Because the variable is yet to be defined, it doesn't contain information.
Press F10 to run forward to the last line of code in SetDeviceChannelVolume.
return ntStatus;Display the value at the memory location of IVolume by using the dt (Display Type) command.
kd> dt lVolume
Local var @ 0xffffb780b7eee664 Type long
0n-6291456
Now that the variable is active, a value of 6291456 is displayed in this example.
You can also display the memory location of IVolume by using the ? (Evaluate Expression) command.
kd> ? lVolume
Evaluate expression: -79711507126684 = ffffb780`b7eee664
The address shown, ffffb780`b7eee664 is the address of the lVolume variable. Use the dd command to display the contents of memory at that location.
kd>  dd ffffb780`b7eee664
ffffb780`b7eee664  ffa00000 00000018 00000000 c52d7008
ffffb780`b7eee674  ffffc98e e0495756 fffff80e c52d7008
ffffb780`b7eee684  ffffc98e 00000000 fffff80e 00000000
ffffb780`b7eee694  ffffc98e ffa00000 ffffb780 b7eee710
ffffb780`b7eee6a4  ffffb780 00000000 00000000 c7477260
ffffb780`b7eee6b4  ffffc98e b7eee7a0 ffffb780 b7eee6f0
ffffb780`b7eee6c4  ffffb780 e04959ca fffff80e 00000000
ffffb780`b7eee6d4  00000000 00000028 00000000 00000002
You can display the first four bytes of an address by specifying the range parameter L4.
kd> dd ffffb780`b7eee664 l4
ffffb780`b7eee664  ffa00000 00000018 00000000 c52d7008
To see the different types of memory output displayed, type the du, da and db commands.
kd> du ffffb780`b7eee664
ffffb780`b7eee664  ""

kd> a ffffb780`b7eee664
ffffb780`b7eee664  ""

kd> db 0xffffae015ff97664
ffffae01`5ff97664  00 80 bc ff 18 00 00 00-00 00 00 00 08 50 e0 51  .............P.Q
ffffae01`5ff97674  00 c0 ff ff 56 57 da 56-0e f8 ff ff 08 50 e0 51  ....VW.V.....P.Q
ffffae01`5ff97684  00 c0 ff ff 00 00 00 00-0e f8 ff ff 00 00 00 00  ................
ffffae01`5ff97694  00 c0 ff ff aa 80 bc ff-01 ae ff ff 10 77 f9 5f  .............w._
ffffae01`5ff976a4  01 ae ff ff 40 00 00 00-00 e6 ff ff 10 dc 30 55  ....@.........0U
ffffae01`5ff976b4  00 c0 ff ff a0 77 f9 5f-01 ae ff ff f0 76 f9 5f  .....w._.....v._
ffffae01`5ff976c4  01 ae ff ff ca 59 da 56-0e f8 ff ff 00 00 00 00  .....Y.V........
ffffae01`5ff976d4  00 00 00 00 28 00 00 00-00 00 00 00 02 00 00 00  ....(...........
Use the df float option to display data as single-precision floating-point numbers (4 bytes).
df ffffb780`b7eee664
ffffb780`b7eee664          -1.#QNAN   3.3631163e-044                0        -2775.002
ffffb780`b7eee674          -1.#QNAN  -5.8032637e+019         -1.#QNAN        -2775.002
ffffb780`b7eee684          -1.#QNAN                0         -1.#QNAN                0
ffffb780`b7eee694          -1.#QNAN         -1.#QNAN         -1.#QNAN  -2.8479408e-005
Write to memory
Similar to the commands that are used for reading memory, you can use the e* commands to change memory contents.
| Command | Description |
|---|---|
ea |
ASCII string (not NULL-terminated) |
eu |
Unicode string (not NULL-terminated |
ew |
Word values (2 bytes) |
eza |
NULL-terminated ASCII string |
ezu |
NULL-terminated Unicode string |
eb |
Byte values |
ed |
Double-word values (4 bytes) |
The following example shows how to overwrite memory.
First, locate the address of the lVolume that is used in the sample code.
kd> ? lVolume
Evaluate expression: -79711507126684 = ffffb780`b7eee664
Overwrite that memory address with new characters using the eb command.
kd> eb 0xffffb780`b7eee664 11 11 11 11 11Display the memory location to confirm that the characters have been overwritten by typing the db command.
kd> db 0xffffb780`b7eee664
ffffb780`b7eee664  11 11 11 11 11 00 00 00-00 00 00 00 08 70 2d c5  .............p-.
ffffb780`b7eee674  8e c9 ff ff 56 57 49 e0-0e f8 ff ff 08 70 2d c5  ....VWI......p-.
ffffb780`b7eee684  8e c9 ff ff 00 00 00 00-0e f8 ff ff 00 00 00 00  ................
ffffb780`b7eee694  8e c9 ff ff 00 00 a0 ff-80 b7 ff ff 10 e7 ee b7  ................
ffffb780`b7eee6a4  80 b7 ff ff 00 00 00 00-00 00 00 00 60 72 47 c7  ............`rG.
ffffb780`b7eee6b4  8e c9 ff ff a0 e7 ee b7-80 b7 ff ff f0 e6 ee b7  ................
ffffb780`b7eee6c4  80 b7 ff ff ca 59 49 e0-0e f8 ff ff 00 00 00 00  .....YI.........
ffffb780`b7eee6d4  00 00 00 00 28 00 00 00-00 00 00 00 02 00 00 00  ....(...........
Alternatively, you can modify the contents of the memory in a watch or locals window. For the watch window, you may see variables that are out of context of the current frame. Modifying them isn't relevant if they aren't in context.
Section 13: End the WinDbg session
<-On the host system
If you want to leave the debugger attached, but want to work on the target, clear any breakpoints using bc *, so that the target computer won't try to connect to the host computer debugger. Then use the g command to let the target computer run again.
To end the debugging session, on the host system, break into the debugger and enter the qd (Quit and Detach) command or select Stop Debugging from the menu.
0: kd> qd
For more information, see Ending a Debugging Session in WinDbg (Classic) in the debugging reference documentation.
Section 14: Windows debugging resources
Additional information is available on Windows debugging. Note that some of these books will use older versions of Windows such as Windows Vista in their examples, but the concepts discussed are applicable to most versions of Windows.
Books
Advanced Windows Debugging by Mario Hewardt and Daniel Pravat
Inside Windows Debugging: A Practical Guide to Debugging and Tracing Strategies in Windows® by Tarik Soulami
Windows Internals by Pavel Yosifovich, Alex Ionescu, Mark Russinovich and David Solomon
Video
The Defrag Tools Show WinDbg Episodes 13-29: </shows/defrag-tools/>
Training Vendors:
OSR - https://www.osr.com/