Note
Access to this page requires authorization. You can try signing in or changing directories.
Access to this page requires authorization. You can try changing directories.
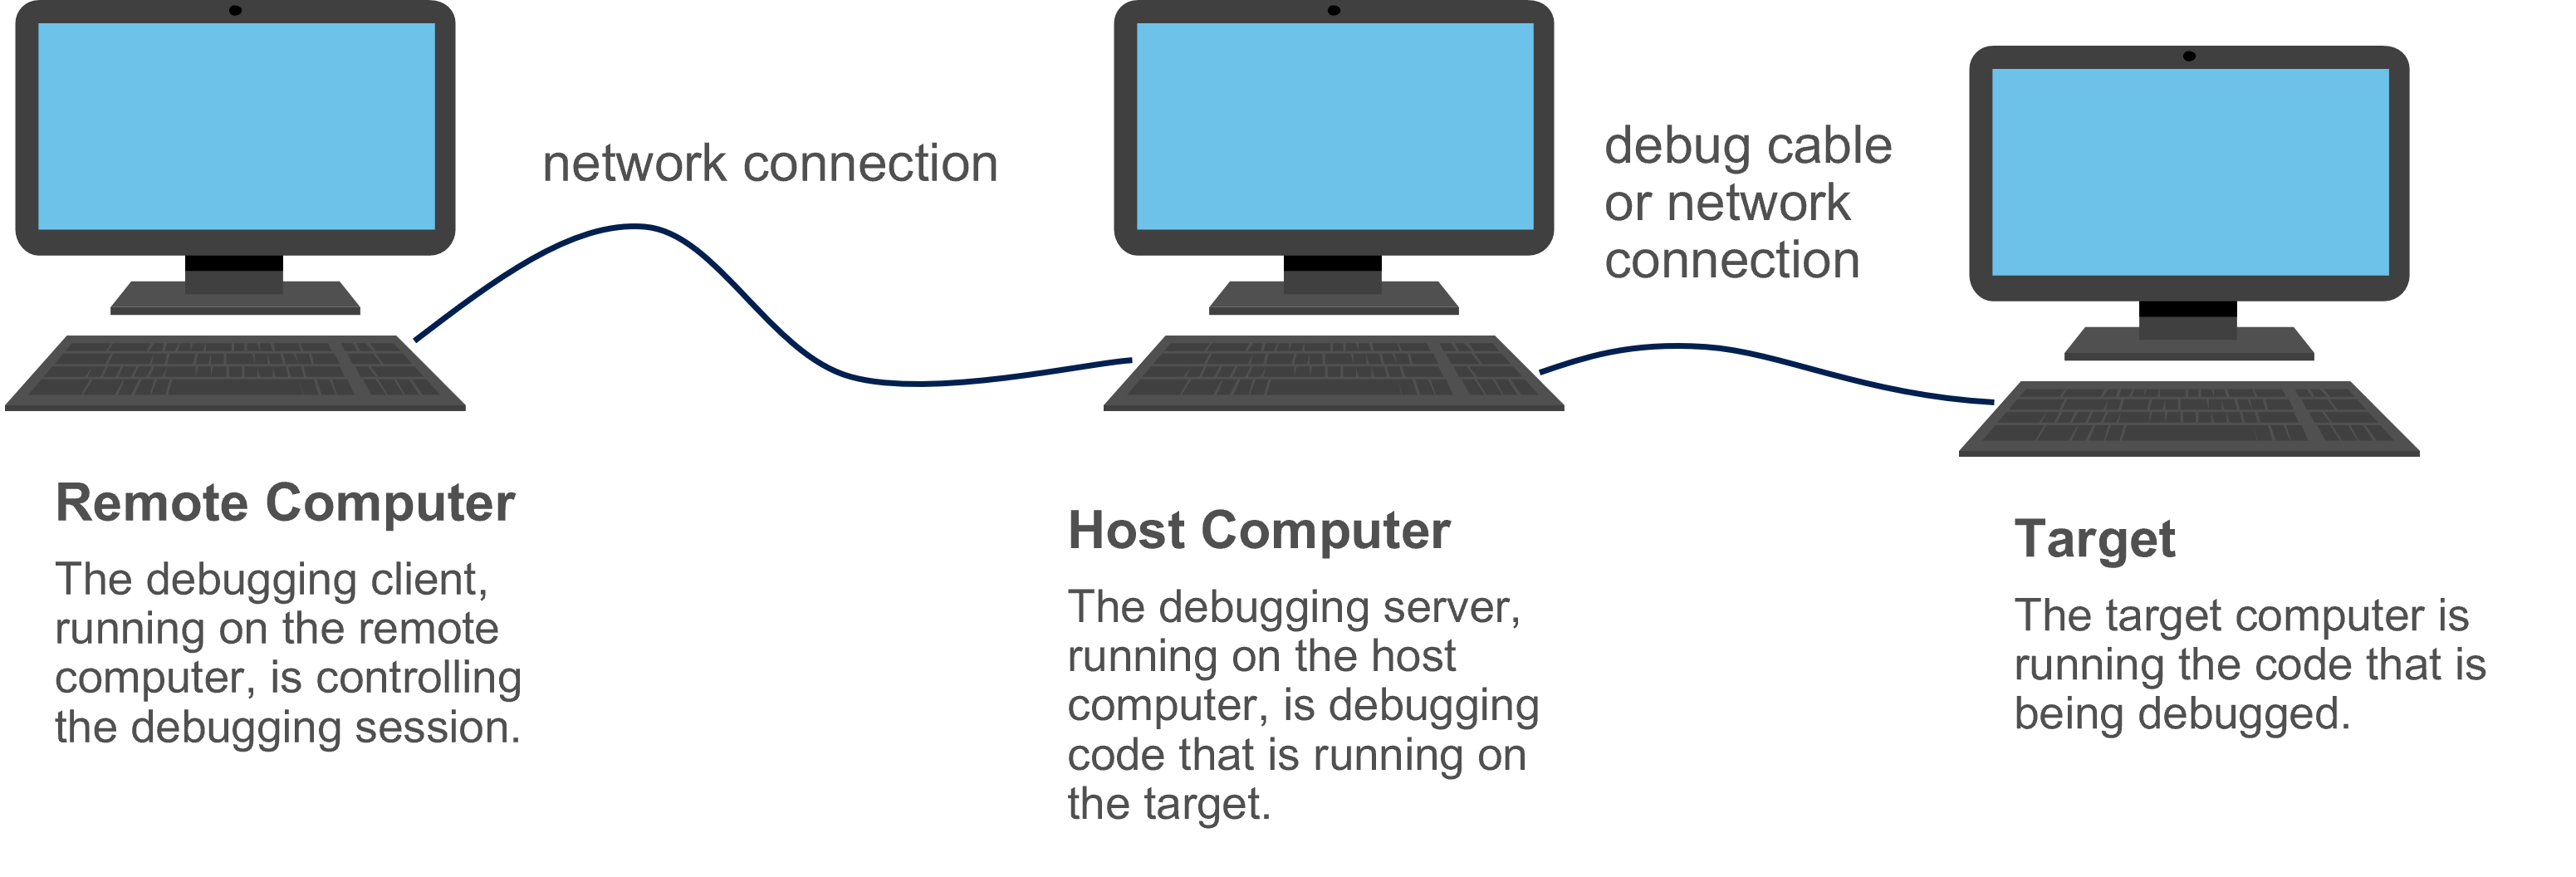
Remote debugging lets you debug code running on a different computer. This guide shows you how to set up a debugging server and connect a debugging client to control your debugging session remotely. You'll learn the exact steps to configure both components.
The code that you're debugging might run on the same computer as the debugging server, or it might run on a separate computer. If the debugging server performs user-mode debugging, the process that you're debugging can run on the same computer as the debugging server. If the debugging server performs kernel-mode debugging, the code you're debugging typically runs on a separate target computer.
This diagram shows how the three computers work together in a typical remote debugging setup:
Important
Remote debugging exposes your system to potential security risks. Before proceeding:
- Review Security During Remote Debugging to enable secure mode
- Understand Security Considerations for Windows Debugging Tools
You can use several transport protocols for a remote debugging connection: TCP, NPIPE, SPIPE, SSL, and COM Port. Suppose you choose TCP as the protocol and WinDbg as both the debugging client and the debugging server. Use the following procedure to establish a remote kernel-mode debugging session.
On the host computer, open WinDbg and establish a kernel-mode debugging session with a target computer. (See Live Kernel-Mode Debugging Using WinDbg (Classic).)
Break in by choosing Break from the Debug menu or by pressing CTRL-Break.
In the Debugger Command Window, enter the following command.
.server tcp:port=5005
Note
The port number 5005 is arbitrary. You choose the port number.
WinDbg responds with output similar to the following. Copy the connection string—you'll need it for the next step.
Server started.  Client can connect with any of these command lines
0: <debugger> -remote tcp:Port=5005,Server=YourHostComputer
On the remote computer, open WinDbg, and choose Connect to Remote Session from the File menu.
Under Connection String, enter the following string.
tcp:Port=5005,Server=YourHostComputer
where YourHostComputer is the name of your host computer, which runs the debugging server.
Select OK.
Using the Command Line
As an alternative to the procedure in the preceding section, you can set up a remote debugging session at the command line. Suppose you want to establish a kernel-mode debugging session between a host computer and a target computer over a 1394 cable on channel 32. Use the following procedure to establish a remote debugging session:
On the host computer, enter the following command in a Command Prompt window.
windbg -server tcp:port=5005 -k 1394:channel=32
Wait for the server to start. You'll see a confirmation message with the connection details. Copy this connection string before proceeding to step 3.
On the remote computer, enter the following command in a Command Prompt window.
windbg -remote tcp:Port=5005,Server=YourHostComputer
where YourHostComputer is the name of your host computer, which runs the debugging server.
Important
The 1394 transport is available for use in Windows 10, version 1607 and earlier. It's not available in later versions of Windows. Transition your projects to other transports, such as KDNET using Ethernet. For more information about that transport, see Setting Up KDNET Network Kernel Debugging Automatically.
Next steps
You can establish remote debugging in many ways other than the ones shown in this topic.
- For complete information about setting up a debugging server in the WinDbg Debugger Command Window, see .server (Create Debugging Server).
- For complete information about launching WinDbg (and establishing remote debugging) at the command line, see WinDbg Command-Line Options.