WinDbg - Scripting Menu
This section describes how to use the scripting support in the WinDbg.
The WinDbg script window features basic syntax highlighting, IntelliSense, and error recognition.
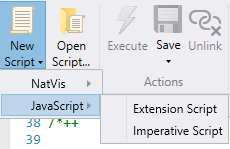
Use the ribbon buttons to:
- Create a new script
- Open an existing script
- Execute a script
- Save a script
- Unlink a script
You can also automatically execute scripts by right-clicking in the script window and selecting Execute Script on Save. When you successfully load a script, a green check box will appear on the script title bar. If there are errors in the script, a red x will be displayed.
JavaScript Scripting
To start using JavaScript, you must first be debugging a target. When you're ready to start working on your JavaScript, click "Load JavaScript Provider". After that you can create a new JavaScript, by picking between these two types of script templates.
Extension Script - A script which is designed to act as an extension to the debugger. It manipulates the object model of the debugger and provides continued functionality. No action happens upon hitting the Execute button on the ribbon.
Imperative Script - A script which is designed to perform an action each and every time the Execute button is clicked on the ribbon. Such a script does not generally modify the object model of the debugger.
For more information about working with JavaScript, see these topics:
Native Debugger Objects in JavaScript Extensions
JavaScript Debugger Example Scripts
NatVis Scripting
Use New Script > NatVis to open the following blank NatVis template.
<AutoVisualizer xmlns="https://schemas.microsoft.com/vstudio/debugger/natvis/2010">
  <Type Name="">
  </Type>
</AutoVisualizer>
For more information about working with NatVis, see Debugger Objects in NatVis.
See Also
Feedback
Coming soon: Throughout 2024 we will be phasing out GitHub Issues as the feedback mechanism for content and replacing it with a new feedback system. For more information see: https://aka.ms/ContentUserFeedback.
Submit and view feedback for