Note
Access to this page requires authorization. You can try signing in or changing directories.
Access to this page requires authorization. You can try changing directories.
![]()
This article describes when and how to use the TTD.exe command line utility to record Time Travel Debugging (TTD) traces. The TTD.exe command line utility allows you to record app or process execution, save it to a trace file, and replay it in WinDbg to diagnose code execution issues.
In this article, you'll learn:
- When to use TTD.exe versus the WinDbg UI
- How to install and configure TTD.exe
- Three ways to record traces (launch, attach, monitor)
- Command line options and advanced scenarios
When to use the TTD.exe command line utility
Time Travel Debugging (TTD) lets you record the code execution of an app or process and save it in a trace file. You can play back the file in the Windows debugger to locate an issue with code execution.
For many scenarios, the easiest way to use TTD to record an app or process is directly from the WinDbg UI. If you're new to Time Travel Debugging, start with Time Travel Debugging - Overview to learn the basics using the WinDbg interface.
You might have scenarios where you need only the TTD command line recorder: recording on a PC without installing the debugger, advanced recording scenarios, test automation, and so on. In these scenarios, you can install just the TTD command line recorder through a URL.
TTD recording impacts the recorded process
TTD recording is an invasive technology. You notice anywhere from 5x-20x or more slowdown of the running app or process while recording, depending on the application and the recording options you select.
The created trace files grow over time and can take significant storage space. Work to trace for the shortest period of time, capturing the program activity of interest and then close the trace as soon as possible.
Once TTD attaches to a process, it can't remove itself. Close the app or end the process once TTD recording is complete. For system-critical processes, this action requires a reboot of the OS.
TTD recordings might contain personally identifiable or security related information
Important
TTD recordings capture memory contents and might contain personally identifiable or security related information, including but not necessarily limited to file paths, registry, memory, or file contents. The exact information depends on target process activity while it was recorded.
Download and install the TTD.exe command line utility (preferred method)
Download the TTD command line utility from https://aka.ms/ttd/download.
Select Install and TTD downloads and installs. The TTD command is added to the system path and is available for use at the command prompt when the install completes.
Tip
After installation, open a new command prompt and type ttd.exe -help to verify the installation succeeded.
If you encounter difficulties installing, see Troubleshoot installation issues with the App Installer file.
On some PCs, you might need to install the Microsoft App Installer for Windows 10. It's available in the Microsoft Store app in Windows. Windows Package Manager is supported through App Installer starting on Windows 10 1809.
Download and install the TTD.exe command line utility (offline method)
While the preferred installation method is to use the App Installer, you can also download the TTD command line package and extract the files manually. Here are two ways to do it.
Extract the files from an installed TTD.exe command line utility
If you already installed the TTD command line utility, you can extract the files from the installed location. In PowerShell, run the following command to find the installed location:
(Get-AppxPackage | where Name -eq 'Microsoft.TimeTravelDebugging').InstallLocation
From there, you can copy all the binaries (*.dll, *.exe, *.sys) to a new location. Here's one way to do this in PowerShell:
robocopy.exe (Get-AppxPackage | where Name -eq 'Microsoft.TimeTravelDebugging').InstallLocation c:\myttd *.exe *.dll *.sys /E /XD AppxMetadata
Replace "c:\myttd" with the destination of your choice. The result looks something like this (on an x64 machine):
ls -Recurse c:\myttd

    Directory: C:\myttd

Mode                 LastWriteTime         Length Name
----                 -------------         ------ ----
d----           11/9/2023  2:43 PM                x86
-a---           11/9/2023  2:43 PM          79240 ProcLaunchMon.sys
-a---           11/9/2023  2:43 PM         112568 TTD.exe
-a---           11/9/2023  2:43 PM         309176 TTDInject.exe
-a---           11/9/2023  2:43 PM          55328 TTDLoader.dll
-a---           11/9/2023  2:43 PM         821176 TTDRecord.dll
-a---           11/9/2023  2:43 PM        1222584 TTDRecordCPU.dll
-a---           11/9/2023  2:43 PM          63416 TTDRecordUI.dll

    Directory: C:\myttd\x86

Mode                 LastWriteTime         Length Name
----                 -------------         ------ ----
-a---           11/9/2023  2:43 PM         247728 TTDInject.exe
-a---           11/9/2023  2:43 PM          42928 TTDLoader.dll
-a---           11/9/2023  2:43 PM        1128480 TTDRecordCPU.dll
Note that the x86 binaries are in a subdirectory. If you don't need to record 32-bit processes, you can delete this folder (and you could add /xd x86 to the robocopy command to avoid copying it in the first place). The ARM64 version doesn't have any subdirectories.
The TTDRecordUI.dll file is only needed if you want to use the UI to control recording. If you don't want the UI, you can delete this file.
Download and manually extract the TTD.exe command line utility package
If you don't want to install the TTD command line utility, you can download the package and extract the files manually. The following PowerShell script:
- Gets the URL for the current version of TTD from https://aka.ms/ttd/download.
- Downloads the MSIX bundle.
- Extracts the requested architecture's MSIX from the MSIX bundle.
- Extracts the TTD binaries from the MSIX.
param(
    $OutDir = ".",
    [ValidateSet("x64", "x86", "arm64")]
    $Arch = "x64"
)

# Ensure the output directory exists
if (!(Test-Path $OutDir)) {
    $null = mkdir $OutDir
}

# Ensure the temp directory exists
$TempDir = Join-Path $OutDir "TempTtd"
if (!(Test-Path $TempDir)) {
    $null = mkdir $TempDir
}

# Determine if the destination already contains binaries
$extensions = @('.dll', '.exe', '.sys')
$existingBinaries = (Get-ChildItem -recurse $OutDir | Where-Object Extension -In $extensions).Count -gt 0

# Download the appinstaller to find the current uri for the msixbundle
Invoke-WebRequest https://aka.ms/ttd/download -OutFile $TempDir\ttd.appinstaller

# Download the msixbundle
$msixBundleUri = ([xml](Get-Content $TempDir\ttd.appinstaller)).AppInstaller.MainBundle.Uri

if ($PSVersionTable.PSVersion.Major -lt 6) {
    # This is a workaround to get better performance on older versions of PowerShell
    $ProgressPreference = 'SilentlyContinue'
}

# Download the msixbundle (but name as zip for older versions of Expand-Archive)
Invoke-WebRequest $msixBundleUri -OutFile $TempDir\ttd.zip

# Extract the 3 msix files (plus other files)
Expand-Archive -DestinationPath $TempDir\UnzippedBundle $TempDir\ttd.zip -Force

# Expand the build you want - also renaming the msix to zip for Windows PowerShell
$fileName = switch ($Arch) {
    "x64"   { "TTD-x64"   }
    "x86"   { "TTD-x86"   }
    "arm64" { "TTD-ARM64" }
}

# Rename msix (for older versions of Expand-Archive) and extract the debugger
Rename-Item "$TempDir\UnzippedBundle\$fileName.msix" "$fileName.zip"
Expand-Archive -DestinationPath "$OutDir" "$TempDir\UnzippedBundle\$fileName.zip"

# Delete the temp directory
Remove-Item $TempDir -Recurse -Force

# Remove unnecessary files, if it is safe to do so
if (-not $existingBinaries) {
    Get-ChildItem -Recurse -File $OutDir |
        Where-Object Extension -NotIn $extensions |
        Remove-Item -Force

    Remove-Item -Recurse -Force (Join-Path $OutDir "AppxMetadata")
} else {
    Write-Host "Detected pre-existing binaries in '$OutDir' so did not remove any files from TTD package."
}
Assuming you save the preceding script as Get-Ttd.ps1, run it like this to download the x64 binaries to the c:\myttd directory:
md c:\myttd
cd c:\myttd
.\Get-Ttd.ps1
Or specify the output directory and architecture:
.\Get-Ttd.ps1 -OutDir c:\myttd-arm64 -Arch arm64
Replace "c:\myttd" or "c:\myttd-arm64" with the destination of your choice.
Record a trace using the TTD.exe command line utility
You can record a trace in three ways:
| Method | Best for | Example scenario |
|---|---|---|
| Launch | Starting a new process with specific arguments | Recording a command-line tool like ping.exe |
| Attach | Recording an already-running process | Debugging a service or long-running application |
| Monitor | Automatically recording every time a process starts | Capturing intermittent issues or startup problems |
After you start recording the process, trigger the issue you want to debug. You might open a problematic file or select a specific button in the app to cause the event of interest. When the application you're recording ends, either naturally or by crashing, the trace file is finalized.
Tip
Recording TTD traces requires administrative rights. Typically, you run ttd.exe from an administrator command prompt.
For more information about recording a time travel trace by using WinDbg, see Time Travel Debugging - Record a trace.
Launch a process
-launch <Program> [<arguments>]
Launch and trace the program (default mode).
This mode is the only mode that lets you pass arguments to the program. The program launches with the same privileges as TTD.exe (as an admin). Use -attach or -monitor to record the program with its normal set of privileges.
Including -launch is optional, but you can use it for clarity.
The first unrecognized argument that doesn't start with - or / is assumed to be an executable path to launch, and any subsequent arguments are assumed to be the arguments for that program.
For example, use TTD.exe notepad.exe to launch and record Notepad. The trace stops when you close Notepad.
For example usage, see Scenario usage examples - recording a process.
Attach to a process
-attach <PID>
Attach to a running process specified by process ID. Use Task Manager or the TaskList utility to identify process numbers. For more information, see Finding the process ID.
For example, use TTD.exe -attach 21440 -out C:\traces\MyTraceFile.run to launch and record the process with an ID of 21440 and save the trace in MyTraceFile.run.
Make sure the directory exists (C:\traces in this example) before running TTD.exe.
For example usage, see Scenario - Locate and attach to a running process.
Monitor a process
-monitor <Program>
The monitor option lets you monitor and trace a program each time it starts. To use this option, you must specify a full path to the output location with -out.
To stop monitoring, press Ctrl+C.
The main benefits of monitoring compared to the other methods are:
- You can launch the target app the normal way, no need to figure out the command line to start it.
- The target app runs with its normal privileges. If you launch the app directly from ttd.exe, it launches elevated and that change might affect the program's behavior.
- It's useful for automation (use a script that monitors the launch of a program and collects a trace).
You can specify the -monitor option more than once to monitor multiple programs.
For example usage, see Scenario usage examples - monitoring processes.
Command line options
Syntax
TTD.exe [options] [mode] [program [<arguments>]]
-? | -help
Display the command line help.
Modes
-launch <Program> [<arguments>]
Launch and trace the program (default mode).
This mode is the only mode that lets you pass arguments to the program. The -launch option must be the last TTD option in the command-line, followed by the program to launch, and any arguments that the program requires. If you don't specify a mode, the tool treats it as a launch. For example, TTD.exe -out C:\traces ping.exe msn.com is treated as a launch.
-attach <PID>
Attach to a running process specified by process ID. Use Task Manager or TaskList utility to identify process IDs. For more information, see Finding the process ID.
-monitor <Program>
Trace programs or services each time they start (until reboot). To use this option, you must specify a full path to the output location with -out.
Basic command line options
-out <path>
Specify a trace file name or a directory. If you specify a directory, it must already exist. If you specify a file name, the file name must not exist.
-noUI
Disables the UI for manual control of recording. Use this option for automation scenarios where you don't need interactive control.
If you don't select this option, a small UI appears when recording is active:
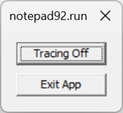
The UI provides two controls:
- Tracing Off - Stops tracing and the app continues running
- Exit App - Closes the app and stops tracing
-accepteula
Use this option to accept the EULA user license agreement. Use this option in automation scenarios, after you review and accept the EULA.
TTD displays the EULA the first time it runs. Type Y or N to accept the EULA. Once accepted, the EULA no longer appears at startup. If you don't accept the EULA, TTD exits and displays the EULA the next time it runs.
Trace control
-stop <process name> | <PID> | all
Stop tracing the specified process name, PID, or "all".
-wait <timeout>
Wait for up to the specified number of seconds for all trace sessions on the system to end. Specify -1 to wait infinitely.
-tracingOff
Starts application with trace recording off. You can use the UI checkbox to turn tracing back on after it has been turned off.
Additional command line options
-children
Record the target process and any processes created by the target. Each child process is recorded into its own trace file.
-cmdLineFilter "<string>"
Record the target process if its command line contains the string. This option works only with -monitor mode. It's useful when the command line argument uniquely identifies the process you're interested in. For example, -monitor notepad.exe -cmdLineFilter "specialfile.txt" records notepad.exe only if specialfile.txt appears on the command line.
-cleanup
Uninstall process monitor driver.
Trace behavior settings
-timestampFilename
Adds a timestamp to the last part of the trace file name. For example, ping_2023-06-17_103116.run.
To record ping.exe with a timestamp in the file name, use this command.
ttd.exe -out c:\traces -timestampFilename ping.exe msn.com
By default, the recorder sequentially scans the output directory to find an unused file name. If you record ping.exe, the recorder tries ping01.run, ping02.run, and so on until it finds an unused file name. For most scenarios, this naming method is sufficient. However, if you want to record the same program many times, the default file naming algorithm can become inefficient when a large number of existing files are present.
-ring
Traces to a ring buffer. The file size doesn't grow beyond the limits specified by -maxFile. Only the last portion of the recording that fits within the given size is saved.
-maxFile <size>
Maximum size of the trace file in MB. When in full trace mode, the default is 1,024 GB and the minimum value is 1 MB. When in ring buffer mode, the default is 2,048 MB, the minimum value is 1 MB, and the maximum value is 32,768 MB.
The default for in-memory ring on 32-bit processes is 256 MB.
-maxConcurrentRecordings <count>
Maximum number of recordings that can be ongoing at any one point in time. If you don't specify this value, an unlimited number of recordings can occur simultaneously.
-numVCpu <number>
Specifies the number of virtual CPUs to reserve and use when tracing. This value affects the total memory overhead placed on the guest process' memory by TTD. If you don't specify this value, the default per platform is 55 for x64/ARM64 and 32 for x86.
Change this setting to limit the memory impact only if you're running out of memory. Lowering the numVCpu value can severely impact the performance of tracing and should only be done to work around memory usage issues.
If TTD.exe fails to record, or the .out file indicates a simulation of 0 seconds, using -numVCpu might enable the recording to succeed.
-replayCpuSupport <support>
Specifies the support expected from the CPUs that replay the trace. The default setting is recommended for portability of traces between machines, but you can use other options to produce smaller trace files and record faster, depending on the specific instructions used by the target program.
<support> values
| Value | Description |
|---|---|
Default |
Default CPU support, just requires basic commonly available support in the replay CPU. |
MostConservative |
Requires no special support in the replay CPU. Adequate for traces that are replayed on a completely different CPU architecture, like an Intel trace on ARM64 CPU. |
MostAggressive |
Assumes that the replay CPU is similar and of equal or greater capability than the CPU used to record. |
IntelAvxRequired |
Assumes that the replay CPU is Intel/AMD 64-bit CPU supporting AVX. |
IntelAvx2Required |
Assumes that the replay CPU is Intel/AMD 64-bit CPU supporting AVX2. |
Reducing overhead of tracing
While TTD is very efficient for what it does (full instruction level tracing encoded into less than one byte/instruction on average), it still has noticeable overhead when recording. Modern CPUs can execute billions of instructions per second, making even one byte/instruction expensive. In many cases recording the entire process is not necessary.
The following options can be used to reduce the overhead of tracing:
-module <module name>
Record only the specified module (such as comdlg32.dll) and the code that it calls. This can be the executable itself or any DLL loaded by the executable. This option can be specified more than once to record multiple modules.
When this option is used the target process runs at full speed until code in the specified module(s) is executed. TTD will then record the process until execution leaves the specified module(s), at which point recording is turned off and the target returns to full speed. Because turning recording on/off is expensive, TTD will leave recording on when a specified module calls out to other modules in the process.
-recordmode <Automatic | Manual>
Normally recording starts as soon as TTD injects itself in the target process ("Automatic" mode, the default). If your program makes use of TTD's in-process recording API to control when recording occurs then you can use the "Manual" mode to run at full speed until your program calls the API to start recording.
Using these options can result in a significant reduction in recording overhead and trace file size. Debugging a trace recorded with these options is no different than a trace of the entire process. Whenever you reach a location in the trace where recording is turned off, the next instruction in the trace is the first instruction executed when recording resumed.
Event related settings
-passThroughExit
Pass the guest process exit value through as TTD.exe's exit value. This value is available to batch files
through the %ERRORLEVEL% variable. PowerShell and other command line environments offer mechanisms for getting the process exit value as well.
-onInitCompleteEvent <eventName>
Allows an event to be signaled when tracing initialization is complete.
Scenario usage examples - recording a process
Choose a scenario that matches your needs:
- Launch and record - Start with a simple Notepad example.
- Launch with parameters - Pass arguments to your application.
- Attach to running process - Record an already-running application.
- Record parent and children - Capture multi-process scenarios.
Scenario - Launch and record a Windows app
In this scenario, you launch Notepad and create a trace.
- Use the
-launchoption to start Notepad and record it.
C:\TTD> TTD.exe -launch notepad.exe
Launching 'notepad.exe'
    Recording process (PID:9960) on trace file: C:\TTD\notepad01.run
notepad.exe(x64) (PID:9960): Process exited with exit code 0 after 12984ms
  Full trace dumped to C:\TTD\notepad01.run
- A small application menu appears, showing that tracing is on.
- When you close the application, it generates a trace file. In this example, the trace file is named notepad01.run.
Scenario - Launch and record a Windows app with a passed parameter
In this scenario, you start ping and pass the address to ping as a parameter.
- In this example, you omit the
-launchoption because it's the default mode.
C:\TTD> TTD.exe ping.exe msn.com
Launching 'ping.exe msn.com'
    Recording process (PID:24044) on trace file: C:\TTD\ping01.run

Pinging msn.com [204.79.197.219] with 32 bytes of data:
Reply from 204.79.197.219: bytes=32 time=22ms TTL=118
Reply from 204.79.197.219: bytes=32 time=21ms TTL=118
Reply from 204.79.197.219: bytes=32 time=25ms TTL=118
Reply from 204.79.197.219: bytes=32 time=21ms TTL=118

Ping statistics for 204.79.197.219:
    Packets: Sent = 4, Received = 4, Lost = 0 (0% loss),
Approximate round trip times in milli-seconds:
    Minimum = 21ms, Maximum = 25ms, Average = 22ms
ping.exe(x64) (PID:24044): Process exited with exit code 0 after 3390ms
  Full trace dumped to C:\TTD\ping01.run
- When you close the application, it generates a trace file. In this example, the trace file is named ping01.run.
Scenario - Locate and attach to a running process
In this scenario, you start Notepad, find its process ID, and create a trace by attaching to the running application.
Start the target app, in this example, Notepad.
Use TaskList or other methods to find the process ID. For more information, see Finding the process ID.
C:\TTD> TaskList
...
Notepad.exe                  21440 Console                    1     73,020 K
...
- Use the process ID with the
-attachoption to attach and record it. Optionally, specify a filename for the trace file with-out.
C:\TTD> TTD.exe -attach 21440 -out C:\TTD\MyTraceFile.run
Attaching to 21440
    Recording process (PID:21440) on trace file: C:\TTD\MyTraceFile.run
(x64) (PID:21440): Process exited with exit code 0 after 26672ms
  Full trace dumped to C:\TTD\MyTraceFile.run
Scenario - Record a parent process and its child processes
In this scenario, you record a parent process and its child processes. Because some apps use many child processes, the family trace file that contains the children might become quite large.
- Specify the
-childrenoption and the name of the parent app to record.
This example records cmd.exe launching ping.exe as a child process.
ttd.exe -out d:\traces -children cmd.exe /C ping.exe msn.com

Microsoft (R) TTD 1.01.11
Release: 1.11.0.0
Copyright (C) Microsoft Corporation. All rights reserved.

Launching 'cmd.exe /C ping.exe msn.com'
    Recording process (PID:48200) on trace file: d:\traces\cmd01.run
    Recording process (PID:53724) on trace file: d:\traces\PING01.run

Pinging msn.com [204.79.197.219] with 32 bytes of data:
Reply from 204.79.197.219: bytes=32 time=6ms TTL=117
Reply from 204.79.197.219: bytes=32 time=6ms TTL=117
Reply from 204.79.197.219: bytes=32 time=7ms TTL=117
Reply from 204.79.197.219: bytes=32 time=7ms TTL=117

Ping statistics for 204.79.197.219:
    Packets: Sent = 4, Received = 4, Lost = 0 (0% loss),
Approximate round trip times in milli-seconds:
    Minimum = 6ms, Maximum = 7ms, Average = 6ms
(x64) (PID:53724): Process exited with exit code 0 after 3516ms
  Trace family nesting level is 1; Parent process ID is 48200
  Full trace dumped to d:\traces\PING01.run

...
- Multiple trace files are created: one for the parent process and a trace file for each child process. WinDbg opens only one trace file at a time, so you need to run separate instances of WinDbg for each trace if you want to debug them at the same time.
Scenario usage examples - monitoring processes
Scenario - monitoring for program launches and starting recording
In this scenario, use the -monitor option to record all currently running instances and future instances of notepad.exe until the system reboots or you exit ttd.exe with Ctrl+C. You need the -out option for monitor, and the output folder must already exist.
- Monitor and trace the current and future instances of notepad.exe.
C:\TTD> TTD.exe -out C:\TTD\ -monitor notepad.exe
Microsoft (R) TTD 1.01.11
Release: 1.11.121.0
Copyright (C) Microsoft Corporation. All rights reserved.


The Process Launch Monitor driver is not installed
Successfully installed the Process Launch Monitor driver
Recording process Notepad.exe(15904)        From parent process explorer.exe(8440)
    Recording process (PID:15904) on trace file: C:\TTD\notepad01.run
Recording process Notepad.exe(19920)        From parent process explorer.exe(8440)
    Recording process (PID:19920) on trace file: C:\TTD\notepad02.run
(x64) (PID:19920): Process exited with exit code 0 after 1281ms
  Full trace dumped to C:\TTD\notepad02.run

(x64) (PID:15904): Process exited with exit code 0 after 30719ms
  Full trace dumped to C:\TTD\notepad01.run
- In this example, you load two instances of notepad.exe after tracing starts. When you capture the activity of interest, use CTRL-C at the command prompt to stop the recording.
Scenario - monitoring two programs for program launches
In this scenario, use the -monitor option to monitor and record two applications.
- Monitor and trace the current and future instances of notepad.exe and ping.exe.
C:\TTD> TTD.exe -out C:\TTD\ -monitor notepad.exe -monitor ping.exe
Microsoft (R) TTD 1.01.11
Release: 1.11.121.0
Copyright (C) Microsoft Corporation. All rights reserved.


Successfully uninstalled the Process Launch Monitor driver
Successfully installed the Process Launch Monitor driver
Recording process Notepad.exe(17972)        From parent process explorer.exe(8440)
    Recording process (PID:17972) on trace file: C:\TTD\Notepad01.run
Tracking process svchost.exe(7824)        From parent process services.exe(1292)
Tracking process sppsvc.exe(10376)        From parent process services.exe(1292)
Tracking process ClipUp.exe(15108)        From parent process svchost.exe(7824)
Tracking process ClipUp.exe(21180)        From parent process ClipUp.exe(15108)
Tracking process consent.exe(24280)        From parent process svchost.exe(892)
Tracking process ctfmon.exe(24508)        From parent process svchost.exe(5064)
Tracking process wt.exe(10768)        From parent process explorer.exe(8440)
Tracking process WindowsTerminal.exe(23296)        From parent process wt.exe(10768)
Tracking process OpenConsole.exe(6816)        From parent process WindowsTerminal.exe(23296)
Tracking process powershell.exe(15956)        From parent process WindowsTerminal.exe(23296)
Tracking process git.exe(3656)        From parent process powershell.exe(15956)
Tracking process git.exe(1928)        From parent process git.exe(3656)
Tracking process git.exe(20312)        From parent process powershell.exe(15956)
Tracking process git.exe(5712)        From parent process git.exe(20312)
Tracking process csc.exe(16144)        From parent process powershell.exe(15956)
Tracking process cvtres.exe(19488)        From parent process csc.exe(16144)
Recording process PING.EXE(21468)        From parent process powershell.exe(15956)
    Recording process (PID:21468) on trace file: C:\TTD\PING01.run
(x64) (PID:21468): Process exited with exit code 1 after 234ms
  Full trace dumped to C:\TTD\PING01.run


Tracking process Teams.exe(10060)        From parent process Teams.exe(2404)
Tracking process cmd.exe(21796)        From parent process powershell.exe(15956)
Recording process PING.EXE(364)        From parent process cmd.exe(21796)
    Recording process (PID:364) on trace file: C:\TTD\PING02.run
(x64) (PID:364): Process exited with exit code 1 after 234ms
  Full trace dumped to C:\TTD\PING02.run
- In this example, you load notepad.exe and then ping.exe after tracing starts. When you capture the activity of interest, use CTRL-C at the command prompt to stop the recording.
Tips for working with trace files
- When sharing traces with others, share only the .run file. The index file (.idx) can be as large as the .run file and is automatically created when WinDbg loads the trace file.
- When collaborating with others, share any relevant trace positions related to the problem. The collaborator can use the
!tt x:ycommand to move to that exact point in time in the execution of the code. You can include time position ranges in bug descriptions to track where the possible issue occurs. - When reporting an issue with TTD, if you supply the .run file, supply the .out file as well. This addition allows for the confirmation that the recording process worked properly.
- Trace files (.run) compress well.
Troubleshooting TTD.exe recording issues
Trace file errors can occur. For more information, see Time Travel Debugging - Troubleshooting.
You can use the .out file for troubleshooting. The example out file shows a functional trace, ending with an exit code of zero.
Microsoft (R) TTDRecord 1.01.11
Release: 1.11.47.0
Copyright (C) Microsoft Corporation. All rights reserved.


Initializing Time Travel Debugging for Attach to 9916
Time: 05/08/2023 17:07:15
OS:10.0.25314 EDITION:x64

SessionID: 008F918C-B8A7-4C4E-B91B-34CFC953C501

   (TTD::ManageTTDTrace:2725)
Running
   (TTD::StartGuestProcess:1512)
Group tracing GUID: B84DF180-DA54-46E5-9019-73690C689979

Running "C:\WINDOWS\SYSTEM32\TTDInject.exe" /duration 1 /InjectMode LoaderForCombinedRecording /ClientParams "37 C:\TTD\Notepad03.run 0 0 0 0 0 0 0 0 c06001 0" /RecordScenario 268435458 /attach 9916 -TraceFileHandle 4f8 -GuestEventHandle 380 -ClientEventHandle 384 -ActiveEventHandle 4f4 -MutexHandle 46c -CommunicationBufferHandle 3c0 -SharedSequenceMutexHandle 3b8 -SharedSequenceBufferHandle 330 /TelemetryFeatureSessionId "008F918C-B8A7-4C4E-B91B-34CFC953C501"
   (TTD::StartGuestProcess:1955)
Microsoft (R) TTDInject 1.01.11
Release: 1.11.27.0
Copyright (C) Microsoft Corporation. All rights reserved.

TTDLoader Params:
 LauncherDll = TTDLoader
 ClientDll   = TTDRecordCPU
 ClientEntry = InitializeNirvanaClient
 ClientParams= 37 C:\TTD\Notepad03.run 0 0 0 0 0 0 0 0 c06001 0
 Attach
WaitForMain is off
Allocated processors:55, running threads:2.
Loader TTDLoader.dll injected at 0x00007FFF423B0000 0xc000 -- .reload  TTDLoader.dll=0x00007FFF423B0000,0xc000

Injection by thread is complete.
RecordingEngine initialization successful.
RecordVcpu initialization successful.
Loader initialization successful.
Guest Process is x64 binary.
Tracing started at: Tue May  9 00:07:16 2023 (UTC) Mon May  8 17:07:16 2023 (Local)

Guest process exited with exit code 0
Simulation time of '' (x64): 18781ms.
Tracing completed at: Tue May  9 00:07:34 2023 (UTC) Mon May  8 17:07:34 2023 (Local)
Most of the .out file content is used internally by the time travel debugging team to troubleshoot recording errors. The following information can be helpful to others that are working with the trace file.
- Some error messages are only displayed in the .out file and might help you determine the specifics of the failure.
- Indication of wall clock time the recording started and stopped
- How long the recording session lasted (simulation time)
- Whether the recording is a launch (with command line) or attach recording
- The OS version
Related content
- Getting started: Time Travel Debugging - Overview - Learn the fundamentals of TTD.
- Recording with WinDbg: Time Travel Debugging - Record a trace - Use the WinDbg UI to record traces.
- Analyzing traces: Time Travel Debugging - Replay a trace - Debug your recorded traces in WinDbg.
- Troubleshooting: Time Travel Debugging - Troubleshooting - Solve common recording issues.