Note
Access to this page requires authorization. You can try signing in or changing directories.
Access to this page requires authorization. You can try changing directories.
![]()
This article provides information on what's new in WinDbg. Earlier versions were released as WinDbg Preview.
1.2606.22001.0
New features
- Added secure-kernel (
-s) KDNET configuration support inkdnet.exe. - Improved ASAN debugging workflows in WinDbg (no more AV flood at startup!).
- Added richer disassembly instruction hints and local markdown-backed help content.
- Added keyboard navigation support in connect-to-device workflows.
- Added the ability to attach directly to WSL processes.
- Added basic APX register support in debugger register views.
Debugging Engine Improvements
- Expanded Linux register and context support with SVE/SME and XSTATE handling, including signal-frame unwind support.
- Improved source download behavior through srcsrv, including better secure-mode handling and diagnostics.
- Improved extension gallery reliability.
- Improved symbol troubleshooting with additional diagnostics and better source-link fallback behavior.
- Improved reliability for register context retrieval from KD and plug-in register contexts.
- Added support for
char8_t, improved PE/DWARF handling with separate debug packages, and improved diagnostics for!heapimage-backed data cases. - Expanded KDNET device coverage and reliability, including Intel E800/E2500/10G/40G and other NIC path fixes.
- Fixed EXDI register-set failures and corrected handling for larger (>256-bit) vector register cases.
General UI Improvements
- Improved error presentation in launch and attach flows with clearer user-facing diagnostics.
- Improved Hex Editor and Data Model interactions, including context menus, DML highlighting, and focus stability in DMO grids.
- Improved accessibility in command and input surfaces, including automation names, high-contrast focus visibility, and keyboard focus cues.
- Improved handling of remote-launch start directories to avoid invalid initial-path failures.
- Added a Copy log file path command in the Logs tool window.
- Added disassembly click-navigation undo and improved floating-window bookmark and script-save behavior.
- Added configurable source-encoding fallback and an opt-out for local-dump configuration prompts.
Time Travel Debugging (TTD)
- Updated TTD from 1.11.592 to 1.11.610 across the 2603-to-2606 payload.
- Fixed a crash when running
.cxrin TTD traces and prevented invalid register editing while debugging TTD traces. - Improved handling for WinDbg
-recordenginescenarios with process-Windows Subsystem for Linux (-pwsl) targets.
Bug Fixes
- Fixed engine architecture auto-detection for executable paths without extensions, preventing x86/x64 mismatch at launch.
- Fixed live Linux debugging with the GDB plug-in.
- Fixed WOW64 debugging issues when an x64 engine targets an x86 process.
- Fixed Linux heap-walk failures in some dump scenarios.
- Fixed false breakpoint-restore failures by skipping entries that can't generate valid restore commands.
- Fixed recurring UI issues in floating and auto-hide windows and command-window layout behavior.
- Fixed empty-automation-property regressions and related accessibility label issues.
- Fixed
symsrv2VPack manifest parsing failures and improved cancellation behavior for symbol and source download operations. - Fixed
kdnet.exeVerifiedNICList lookup for execution-alias installs.
1.2603.20001.0
New features
- Added initial support for ARM64 Scalable Vector Extensions (SVE), laying the groundwork for debugging ARM64 targets that use SVE registers
- Added Open Workspace and Save Workspace buttons for easier session management
- Added System Theme Mode — WinDbg now follows the Windows system light/dark theme setting
- Significantly improved help text for CPU instructions in the disassembly view, providing better inline documentation
- Improved KDNET reverse-protocol reconnection reliability when the target reboots unexpectedly
kdnet.execonfiguration tool is now included with WinDbg- Added command-line options
-Qand-WFto WinDbg
Debugging engine improvements
- Improved register state handling (XSTATE) across diverse target configurations
- SIMD vector registers can now be displayed in multiple views (byte, word, dword, float, etc.), making it easier to inspect packed data in different formats
- Long integers are now printed using the default radix in the data model
- Added an API for manually opening target composition symbols
- Improved performance of symbol name lookups, particularly for DWARF and other plug-in symbol providers
General UI improvements
- Updated .NET SDK to 10.0.103 (security update)
- Updated Command Window ribbon menu icons and added more actions
- Pasting into the Command Window input now strips trailing whitespace
Time Travel Debugging (TTD)
- Updated TTD to version 1.11.592
- Improved indexer robustness when indexing large (tens to hundreds of GB) traces. This required a change to the index format, so existing traces will need to be re-indexed.
@$cursession.TTD.Calls()now reports more accurate parameter information for 32-bit assembly stubs- Fixed an issue where an executable entry point's exit code was not properly returned by the recorded process
Bug fixes
- Fixed incorrect x64 Parity Flag displayed in the Registers window
- Fixed an issue where the embedded PDB path in the debug directory was not tried when a mismatched PDB was found first in the search path
- Fixed a hang in CLR stack walks when the DBI stack walker entered a loop
- Fixed a crash caused by a null pointer returned from
GetSymbolByIdin CLR composition - Fixed Command Window prompt not appearing when opened late in a session
- Fixed Command Window input and history bugs
- Fixed an issue where script error hints were not appearing in the Script Editor
- Fixed a crash during tool window docking operations
- Fixed an issue where some registry reads were not reflecting the latest values
- Fixed an issue where Command Window input text "bounced" when moving the cursor
- Fixed an issue where Alt+Space did not invoke the System Menu for floating windows
- Fixed an issue where expanding items in the Locals window would scroll the item out of view
1.2601.12001.0
General UI Improvements
- Upgraded to .NET 10
- Upgraded Script Window to use the latest Monaco editor (0.55.1)
- Added Undo/Redo buttons to Script ribbon tab
- Improved focus during keyboard navigation between tool windows
- Fixed minor issues with scrolling and selection in Disassembly window
- Fixed issue where registers window would show different values than register command
- Fixed several high DPI issues
- Check and report debugger age with warning if "too old"
- Fixed a crash when graph mode selected in Model window opened for a blank query
- Implemented crash-safe logs for WinDbg
Debugging Engine Improvements
- Improved performance of symbol name lookups that are not present (particularly for DWARF and other plug-ins)
- Added null check on OnTargetCompositionEvent handlers
- Enabled pointer-tag mask reading
Time Travel Debugging (TTD)
- TTD version 1.11.567 -> 1.11.584
- Several improvements to increase performance and robustness of indexing including 5x speed up for large (100+ GB) traces.
- Fixed customer-reported issue: accessing the TEB via segment register, using 32-bit addresses, works. (1.11.572)
- More accurate callstacks around syscalls. (1.11.582)
Bug Fixes
- Fixed "type information not found" errors due to improperly handled complex locations
- Resolved console debugger line termination issues with redirected I/O and non-Unicode characters
- Fixed CPR/EPR event filtering on Linux
- Fixed missing function labels in disassembly view for Linux
- Fixed import functions resolution on Linux binaries compiled with CET
- Fixed unresolved breakpoints causing live Linux debug sessions to become unusable after module load
- Fixed thread local variables not viewable on Linux when connected via GDBServer
- Fixed ELF Image page overlay crash when underlying target's memory service doesn't implement memory information
- Fixed variadic print functions crash in debugger due to improper format parameter usage
- Fixed inconsistency in handling long, unsigned long, and wchar_t on UNIX variant OSes (LLP64 v. LP64)
- Fixed deadlock when waiting on cleanup thread during debugger shutdown
1.2511.21001.0
New features
- Enhanced file selection with priority-based handling extended to CAB files and folders for better dump file targeting
- Improved ELF, DWARF, and Mach-O symbol file downloads with enhanced logging and status messages
- DBGHELP_DIA_PATH environment variable now takes precedence over currently loaded modules for better symbol handling control
- Member name indexing improvements for better symbol navigation and lookup performance
Bug fixes
- Resolved issue where memory writes to live Linux targets would fail
- Fixed DAC and SOS extension loading and functionality when connected to live debugging targets
- Resolved problem where attached process executables appeared as 'imageXXXXXXXX' instead of actual names
- Fixed NuGet.exe download code that was broken by negative cache implementation
- Fixed UI delays when using exdigdbsrv
- Handled WMI exceptions from USB 3.1 workaround compatibility checker
- Removed incorrect warnings (C6518) from wdbgexts.h SAL annotations
- Fixed type information display for
char16_tandchar32_ttypes on Linux platforms
General UI improvements
- Add new Simplified Ribbon option, which reduces the Ribbon's vertical footprint
- Enabled graphics hardware acceleration when running in Remote Desktop Protocol (RDP) sessions
- Improved refresh performance in Disassembly window
- Fixed DPI scaling for tool window context menus across different monitor configurations
- Made version information selectable on About page for easier copying
- Removed support for obsolete IDNA (Internationalized Domain Names in Applications) technology
- Cleaned up debugger log to exclude early application startup entries from extension gallery and other internal operations
Time travel debugging (TTD)
- 1.11.553 -> 1.11.567
1.2510.7001.0
User Interface & Experience Improvements
- Open Any Memory Window Instance from Ribbon
Debugging & Performance Enhancements
- Prevented stealing of process instrumentation callbacks to improve debugging reliability
- Enhanced Time Travel Debugging (TTD) variable history with tabular format preference for better data visualization
- Fixed crash in variable history when reusing generators by ensuring proper function captures
- Enhanced evaluator for ambiguous breakpoints to handle more complex debugging scenarios
- Fixed empty Publisher column display for store applications and PLM processes
TTD & Replay API Updates
- Updated
!ttcommand to provide one-line help and current position when called without arguments instead of moving to trace beginning - Added experimental Replay API SDK availability for external integration
- Enhanced variable history data model methods for improved programmatic access
- Fixed various TTD replay operation optimizations and callback support improvements
Bug Fixes & Stability
- Fixed error reporting that incorrectly showed "error: The operation completed successfully"
- Addressed host URL processing issues in fasttfgitview commands
- Improved error text around symbol resolution to provide clearer feedback
- Fixed issues with loading PDBs for flat mapped .NET assemblies on Linux
- Resolved uninitialized read bug in debugging components
- Fixed extension gallery file search issues with short file names
1.2508.27001.0
New features
- Added an option to disable graphics hardware acceleration for WinDbg.
- Added a new
.AlternateFunctionsproperty on<frame>.Attributes.SourceInformation.
Bug fixes
- Fixed an issue where the Start Debugging page wouldn't refresh after it opened a dialog.
- Fixed an issue with tab menu items that connect to devices that weren't accessible to UI automation.
- Fixed an issue where the uncommitted command input was lost when you explored command history.
- Fixed mouse wheel handling to properly smooth scrolling (mice with smooth wheels and trackpads).
- Fixed misleading recursive step-over behavior in 32-bit x86 debugging when function prologues called
__SEH_prolog4. - Fixed a bug in the
.AllowNugetExeUpdatesetting for NuGet-based extension galleries. - Fixed a bug when reading DWARFv5 symbols around
.debug_namestables and name indices. - Corrected step-in behavior for source lines with multiple step-filtered calls.
- Fixed crash caused by invalid
natvisversion string. - Fixed environment block transmission for
CreateProcessWin remote debugging. - Fixed
!percpuand!allpercpucommands for CPU pointers dynamically allocated viaalloc_percpuin the Linux kernel. - Fixed an issue with CPU numberings in Linux kernel debug sessions.
- Fixed missing Disassembly window function labels for non-program database (PDB) symbol targets.
- Fixed handling of placeholder relocations in ELF binaries.
- Fixed double free in DWARF symbols' handling of
DW_OP_fbreg. - Fixed regression in dump collection code that prevented full memory dump collection for x64-on-ARM64 emulated processes.
General UI improvements
- Made improvements to how WinDbg restores window position when you change monitors of different resolutions. WinDbg also now saves and restores snapped positions.
- Implemented horizontal scrolling by using the mouse wheel while you hold down the Shift key.
- Updated the Open Folder picker to use the modern dialog.
1.2506.12002.0
New features
WinDbg now ships with the console mode debuggers (cdb.exe / ntsd64.exe / kd.exe). To disambiguate the binaries from each other, and to not interfere with existing copies of the tools, the binaries include the architecture name:
- cdbARM64.exe / cdbX64.exe / cdbX86.exe
- kdARM64.exe / kdX64.exe / kdX86.exe
- ntsdARM64.exe / ntsdX64.exe / ntsdX86.exe
More features:
- Data model tool window title can be customized via the
$OpenDmoToolwindowcommand and can also be changed via the title bar context menu. - New debugger setting to enable parallel HTTP downloads of symbol files. This option is enabled by default.
Bug fixes
- Fixed how the target path is saved for dump files opened via the command line (
-z) so that you can open it successfully from the Recents menu. - Fixed a crash in the Script Editor window.
- Fixed how WinDbg handles inconsistent line endings in source files that were opened in the Source window to provide a more consistent view of source files.
- Fixed an issue where credentials weren't renewed for HTTP symbol servers when you use the new parallel downloads feature.
- Fixed an issue where the properties of data model objects weren't enumerated properly in JavaScript extensions.
- Fixed an issue where column text disappeared when reordered via dragging.
- Fixed an issue where setting event filtering via command-line options weren't applied to the debug target at startup.
- Fixed an issue where sometimes undocking a tool window resulted in blank content.
- Fixed an issue where minidumps of X64 emulated processes on ARM64 machines couldn't be debugged.
- Fixed an issue where ambiguous breakpoints crashed the debugger.
- Fixed an issue where GDBServer crashed at process exit when debugging a live Linux process.
- Fixed multiple issues related to debugging JavaScript extensions (
.scriptdebug), including better enumeration of properties and fixing a crashing issue.
General UI improvements
- Aligned the Command suggestion pop-up to the cursor. It now shows only suggested completions instead of everything before the cursor.
- Provided more detail to the opening debug target error dialog. For open dump failures, provided a hyperlink to a TSG file that failed to open.
- Gave tool window title bars the same context menu as their docked tab.
- Made visual improvements to Locals, Watch, and Model windows.
- Updated Time Travel Debugging (TTD) to version 1.11.532. For more information, see TTD release notes.
1.2502.25002.0
New features
Command window IntelliSense
The command input prompt automatically shows suggested completions when the first typed character is . (dot), ! (bang), or $ (dollar sign).
Suggestions can also be invoked with the command shortcut Ctrl+Spacebar.
Snapshot debugging
When WinDbg debugs live processes locally, it can also take snapshots of the process. To switch between snapshots and the live process, use the icons on the Extensions tab.
Similarly, WinDbg can attach to a process snapshot of a process without suspending it via a snapshot:pid=<process pid in hex> protocol string in Connect to remote debugger.
New data model APIs
Debugger.Utility.Symbols.GetTypeInformationReturns the type information associated with any object passed in. An optional argument allows for automatic dereferencing (one level) of pointers if you want the type underneath any pointer (or ref).
Debugger.Utility.Control.CreateStepFilter(<Type>, <Pattern>)Creates a new step filter located in the namespace next to all the breakpoint creation APIs.
Debugger.State.StepFiltersReturns the list of step filters that have the properties
Id,Description,Type,Pattern, andIsEnabled. There's a.Remove()method on step filter objects.
Improved CLR debugging experience without clrcomposition.dll
The redistributable component dbgeng.dll improves stack walking support for common language runtime (CLR) frames without the need for clrcomposition.dll to be present.
Random improvements
- Improved support for Linux kernel debugging (especially for 6.11+ kernels).
- Added support for ZSTD compressed KDUMP pages.
Bug fixes
- Updated server operating system (SOS) to version 9.0.557512.
- Fixed a performance regression in checking for revoked signatures when loading msdia140.dll.
- Fixed a crash when reading the XSTATE context.
- Fixed disabled breakpoint highlighting in the Disassembly window to differentiate from an enabled breakpoint.
- Fixed a crash when you close a floating tool window.
- Fixed an issue where the current position of the Timelines window didn't always populate after opening a recent trace.
- Fixed an issue in the Disassembly and Memory windows, which didn't always update after a new value was entered.
- Fixed the title bar color scheme in the dark theme.
- Fixed the presentation of deferred breakpoints in the Breakpoints window where Location showed
0x0instead of the original expression entered when it was created. It also has a distinct icon, which indicates that it isn't bound. - Fixed an issue in the Locals and Watch windows where right-clicking on a visible item caused the view to scroll up.
- Fixed issues with
natvis. For more information, see the original bug report. - Fixed
kddebugger spam with messageError getting port connector information. For more information, see the original bug report. - Fixed an issue with
gctriggering conditional breakpoints when the condition was false. - Fixed an issue so that YMM and ZMM registers can now be viewed when you debug a TTD trace.
Accessibility fixes
- Improved keyboard navigation for Locals, Watch, and Breakpoints windows.
- Improved visual readability of the ribbon and Locals, Watch, and Breakpoints windows.
- Improved screen reader usability of Locals, Watch, and Breakpoints windows.
- Maintained previous keyboard focus, selection, and scroll, when possible, for editing items in Locals, Watch, and Breakpoints windows.
- Improved general support for Windows text scaling.
General UI improvements
- Added a command to move focus from a command input text box to a command output pane as Toggle Mark mode (like a command prompt). The shortcut is Ctrl+M.
- Added a Go to Disassembly context menu item to the Breakpoints window.
- Added a context menu to the Disassembly window for Run to Instruction, Set Instruction Pointer, Go to Source, Toggle Breakpoint, and Toggle Breakpoint states.
Time Travel Debugging
- Updated to version 1.11.481.
- For more information, see TTD release notes.
1.2410.11001.0
Breaking change
Now dbghelp.dll dynamically links to msdia140.dll. This change should affect only tools that redistribute dbghelp.dll without also including msdia140.dll. NuGet packages that include dbghelp.dll also include msdia140.dll.
Bug fixes
- Fixed an issue where extension gallery function aliases weren't bound to the load triggers.
- Fixed an issue where the symbol store is no longer defunct when an
ERROR_INTERNET_SECURITY_CHANNELerror is received. - Fixed an issue where a backslash couldn't be typed in the Command window for non-English keyboard layouts.
- Fixed an issue where the edit text box in Locals, Watch, and Breakpoints windows wouldn't scroll to the cursor when text was longer than the column in which it was hosted.
- Prioritized *.dmp (single period) over *.*.dmp (double periods) for CAB or ZIP dumps.
Accessibility fixes
- Fixed column resizing via the keyboard for Locals and Watch windows.
- Improved keyboard navigation throughout WinDbgX.
1.2409.17001.0
Accessibility fixes
Fixed several issues when you interact with WinDbg by using a screen reader.
Bug fixes
- Fixed an issue where uninstalling WinDbgX prevents the opening of WinDbg (Classic).
- Fixed an issue where WinDbgX would resize after it appeared during opening.
Time Travel Debugging
- Updated to version 1.11.429.
- For more information, see TTD release notes.
1.2407.24003.0
New features
New JavaScript scripting provider
We're now shipping a new backward-compatible JavaScript provider based on V8. As a result, ARM64 hosts can now use JavaScript extensions. The ARM64 UI also now defaults to the ARM64 engine.
The new provider is enabled by default on all architectures. On x86 and x64, it can be turned on or off via the .veighton and .veightoff commands. In the future, we plan to remove these commands and the legacy JavaScript provider.
UI extensibility via the extension gallery and data model
Debugger extensions with extension gallery manifests can now add icons to the new Extensions tab on the WinDbg ribbon. Selecting these icons triggers a visualization of a specific data model query. Extensibility is accomplished by adding views to the extension gallery manifest. A view binds a coupling of a name and an icon to a data model query and view kind. For documentation, see Extension gallery manifest documentation.
Added exception parameters to the extension gallery exception load trigger
A gallery extension can now be conditionally loaded based on specific exception parameter values. For more information, see Extension gallery manifest documentation.
Configuration option to never download specific symbols
You can now skip downloading symbols for specified images.
In the Symbols section of your DbgX.xml configuration file, you can add a list of symbols:
<Namespace Name="DisabledSymbolsDownload">
  <Setting Name="MSEdge.dll" Type="VT_BSTR" Value=""></Setting>
</Namespace>
In the debugger, you can run dx Debugger.Settings.Symbols.DisabledSymbolsDownload to view the current list of symbols not being downloaded.
You can also change the list directly from the debugger:
dx @$curprocess.Modules[1].DisableSymbolDownload()
dx @$curprocess.Modules[1].EnableSymbolDownload()
New command to display SourceLink information
To aid debugging issues with downloading sources based on embedded SourceLink, you can now use the command !lmsourcesinfo module to display the contents of SourceLink that the debugger uses.
General UI improvements
Made small improvements to windows such as the Modules and Stack windows:
- The header column is used to sort grid views.
- More right-click actions are available.
- The Stack window shows frames as inlined when appropriate.
Bug fixes
- Fixed an issue where PDBs larger than 4 GB wouldn't download over HTTP. Edge is an example of such a PDB.
- Fixed a caching issue in the debugger credential provider. (Now it caches credentials per site.)
- Fixed bugs during evaluation of the extension gallery load triggers.
- Fixed a bug with
!addressthat could cause a crash. - Fixed
!heap -a -aso that it works now.
TTD
See TTD release notes for version 1.11.410.
1.2402.24001.0
New features
Live Linux debugging
You can now debug a Linux process live. For more information, see these articles:
For the foreseeable future, the WinDbg client requires Windows because WinDbg doesn't run on Linux.
Record a subset of execution with Time Travel Debugging
You can now specify a list of modules to record to focus TTD on the modules that you care about. This functionality can reduce recording overhead. To use it, in the Configure and Record dialog, select Record subset of execution. Then specify the modules that you want recorded. (For more information, see Known issues.)
For finer control, you can precisely record your program by using a new in-process recording API. To learn how to record your program, see our sample code and documentation.
Compact register window
The new register window looks like the output from the r command. Editing from the new register window isn't yet supported.
New parameters for e (Enter Values) into memory commands
The e (Enter Values) into memory commands now support physical addresses like the d (Display Memory) commands. These options are supported only in kernel mode.
| Option | Description |
|---|---|
/p |
Uses physical memory addresses for the display. The range specified by Range is taken from physical memory rather than virtual memory. |
/p[c] |
Same as /p, except that cached memory is read. The brackets around c must be included. |
/p[uc] |
Same as /p, except that uncached memory is read. The brackets around uc must be included. |
/p[wc] |
Same as /p, except that write-combined memory is read. The brackets around wc must be included. |
For more information, see e, ea, eb, ed, eD, ef, ep, eq, eu, ew, eza (Enter Values).
Bug fixes
- Added support for Rust name demangling in Linux debugging.
- Made improvements to CLR debugging:
- Added the ability to force mixed-mode stack walking CLR frames.
- Added
ForceMixedModeStackWalkersetting toconfig.xmlorDbgX.xml. - Added
!forceclrmixedmodeunwindcommand for one-off investigations or if you can't change the configuration setting.
- Added
- Added the ability to force mixed-mode stack walking CLR frames.
- Made general improvements of CLR debugging on Linux.
- Fixed several issues with respect to
LinuxKernel.jsand per-CPU variables:- Added the
!runqcommand toLinuxKernel.jsto be able to dump the per-CPU kernel scheduler run queues (similar in form to the Linux crash utility'srunqcommand). - Fixed various commands in
LinuxKernel.jsto correspond to kernel changes. In more recent kernels, timer tree uses cached RB nodes instead of raw RB nodes. In more recent kernels, theall_bdevslist is gone, so block devices are now walked from the superblock instead (blockdev_superblock).
- Added the
- Made various
natvisfixes to work more like recent versions of Visual Studio. - Preferred
sourcelinkversus legacysourceinfo.- Added the
!lmsourcesinfo <module>command to displaysourcelinkstreams from PDBs (to aid debugging issues withsourcelink).
- Added the
Known issues
When you specify a list of modules to record with TTD, specifying more than one module doesn't work in this release.
1.2308.2002.0
Made many bug fixes and small improvements.
1.2306.12001.0
Made many bug fixes and small improvements.
1.2303.30001.0
Note
The debugger was renamed from WinDbg Preview to WinDbg.
The legacy debugger released with Debugging Tools for Windows is now known as WinDbg (Classic).
Time Travel Debugging on ARM64
WinDbg runs natively on ARM64, and we also enabled TTD of native ARM64 processes. You can now record native ARM64 processes (and x86 and ARM32 processes) and debug them easily, even on your x64 machine. Support for x64 or x64-enabled (ARM64EC) processes on ARM64 devices isn't yet available.
Overall TTD performance was also improved, with recording overhead substantially reduced for processes that use common SIMD instructions. In total, 65 new instructions were optimized, which range from MMX through SSE 4.2, AVX, and AVX2.
Ambiguous breakpoint resolution
Ambiguous breakpoints allow for the debugger to set breakpoints in certain scenarios where a breakpoint expression resolves to multiple locations. For more information, see Ambiguous breakpoint resolution.
1.2107.13001.0
Regex search
WinDbg Preview search now includes the option to search by using regular expressions, known as regex. To enable regex in the window that you want to search, select Ctrl+F. Then toggle the button labeled .* next to the search box.
Restricted mode
Restricted mode is an optional setting that can limit the type of debugging sessions that WinDbg Preview can start to remote debugging sessions and dump files only. For more information, see WinDbg: Restricted mode.
Shadowed variable support
In past versions, WinDbg throws "Ambiguous Symbol" errors when trying to evaluate (??) or display (dx) a variable that shares its name with another variable in scope. WinDbg now disambiguates variables that share the same name by appending @n to the variable name. Examples include foo@0 and foo@1
This change is also reflected in the Locals window. Previously, only the nearest variable in scope appeared.
1.2104.13002.0
Smart number selection and search
A convenient productivity feature of WinDbg Preview is the ability to detect patterns in the Command window. To detect patterns, select any text, and all other instances of that text are highlighted. This highlighting is useful when you look at memory patterns. Now, it also highlights equivalent numbers in other radixes, no matter how the number is formatted in hex, decimal, or scientific notation. For more information about numbering schemes, see n (Set Number Base).
Example:
When you select 0x000001e2fb3f6160, all other instances are highlighted no matter the format.

This feature also works with semi-temporary highlights. Select Ctrl and double-click a number to highlight all its instances. You can keep track of multiple important numbers throughout your command history this way. (To clear the highlight, select Ctrl and double-click the number again.) Finally, this feature also works when you search numbers by selecting Ctrl+F.
Source code extended access
The source path command .srcpath, .lsrcpath (Set Source Path) was updated to include the new tag DebugInfoD. For more information, see Source code extended access.
Host and guest states of WOW processes in the data model
When you debug a 32-bit WOW process from a 64-bit context, you can now access both the host and guest states within the data model.
32-bit guest state examples:
dx @$curprocess.Environmentdx @$curthread.Environmentdx @$curthread.Stack
64-bit host state examples:
dx @$curprocess.NativeEnvironmentdx @$curthread.NativeEnvironmentdx @$curthread.NativeStack
JavaScript debugging improvements
JavaScript loaded in the UI now uses the .scriptdebug command for direct debugging within the console. For more information, see JavaScript debugger scripting: JavaScript debugging.
Accessibility improvements
With WinDbg Preview, we committed to building a debugger that's inclusive for engineers with disabilities. We made the following accessibility improvements:
- Made Command window links clickable via the keyboard (select Shift+Enter).
- Improved keyboard navigation of the main menu.
- Improved keyboard navigation of the ribbon.
- Increased contrast on UI elements.
New Overwrite data access type for Time Travel Debugging
Time Travel Debugging now provides an Overwrite data access type. Memory queries such as dx @$cursession.TTD.Memory() now have another column that shows the old values of writes.
Other fixes, improvements, and updates
- Added a feature to automatically detect and apply a workaround for a USB 3.1 hardware issue when both the kernel debugging host and target are USB 3.1 controllers.
- Added a new UI shortcut: Ctrl+Shift+select over a DML link copies it to the clipboard.
1.0.2007.01003
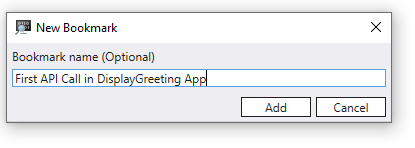
Timeline bookmarks
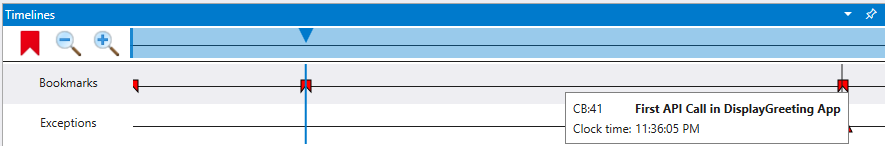
Bookmark important time travel positions in WinDbg instead of manually copying and pasting the position to Notepad. Bookmarks make it easier to view at a glance different positions in the trace relative to other events and to annotate them.
You can provide a descriptive name for bookmarks.
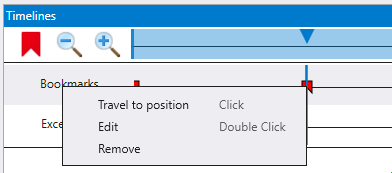
Access bookmarks via the Timelines window available in View > Timeline. When you hover over a bookmark, the bookmark name appears.
You can select and hold (or right-click) the bookmark to travel to that position, rename, or delete the bookmark.
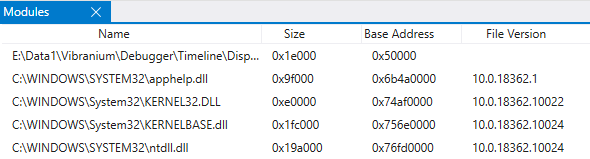
Modules window
A new window shows modules and their related information that's available via the View ribbon. The Modules window shows:
- The name of the module, including the path location.
- The size in bytes of the loaded module.
- The base address where the module is loaded.
- The file version.
Thread names/descriptions available in live debugging
Thread names that are set from SetThreadDescription are now available when doing live user-mode debugging. Thread names are available by using the ~ command or the debugger data model.
0:000> ~
   0  Id: 53a0.5ffc Suspend: 1 Teb: 000000b1`db1ed000 Unfrozen "Hello world!"
   7  Id: 53a0.9114 Suspend: 1 Teb: 000000b1`db1ef000 Unfrozen
   8  Id: 53a0.2cc4 Suspend: 1 Teb: 000000b1`db1f1000 Unfrozen
   9  Id: 53a0.5c40 Suspend: 1 Teb: 000000b1`db1f3000 Unfrozen

0:000> dx @$curthread
@$curthread                 : ConsoleTestApp!ILT+25(mainCRTStartup) (00007ff7`fac7101e)  [Switch To]
    Id               : 0x5ffc
    Name             : Hello world!
    Stack
    Registers
    Environment
Portable PDB support
Portable PDB support was added. The PDB format describes an encoding of debugging information produced by compilers of CLI languages and consumed by debuggers and other tools. For more information, see Portable PDB symbols.
Other changes and bug fixes
- Provided support for AMD64 and Linux kernel dump debugging for WinDbg.
- Made time travel recording enhancements and other fixes.
1.0.1912.11001
- TTD timelines: A new window displays a visual representation of important events in your trace: exceptions, breakpoints, function calls, and memory accesses. Timelines automatically open and display exceptions (if present) and breakpoints. For more information, see WinDbg Preview: Timeline.
- Switched to default window chrome: The custom window chrome that we used caused some scaling and resizing issues, so we removed it for now.
- File menu improved keyboard navigation: The file menu is easier to navigate with only a keyboard.
Other changes and bug fixes
- Disabled the Stack and Locals windows when your target is running so that it doesn't show "Unspecified error" when there's no target.
- Added a Services column to the Attach dialog to help you easily find which services are running.
- Fixed a bug that caused architecture detection to not work when applications are opened with arguments.
- Improved disassembly for the Disassembly window when private symbols are loaded.
- Removed the Load JSProvider button from the scripting ribbon because jsprovider.dll is now loaded automatically.
1.0.1908.30002
- Improvements to TTD calls objects: Calls queries now include parameter names, types, and values. When you query across traces for function calls, you can get fully typed parameters and their values. This capability makes it easy to filter down results by parameters.
- Support for Open Enclave: WinDbg Preview can now debug Open Enclave applications. For more information, see Open Enclave debugging).
- ELF core dumps: As part of supporting Open Enclave, WinDbg can open ELF core dumps and binaries and also DWARF symbols (DWARF 5 isn't currently supported) from both enclaves and Linux applications. When you open a core dump from a non-Windows application, basic windows and commands should all work properly, but most extensions and Windows-specific commands don't work. ELF and DWARF files are downloaded from symbol servers following the key conventions that are defined in SSQP key conventions. Enclaves are the only supported scenario, but we welcome feedback on opening other Linux core dumps.
- TTD file format change: A major update to the file format for TTD traces breaks forward compatibility. Previous versions of WinDbg Preview can't open traces recorded with this version and future versions of WinDbg Preview. This version and future versions will be able to open both new and old traces.
Other changes
- TTD now uses the 64-bit engine for indexing and the appropriate debugger engine bitness for replays. Potential memory issues when indexing and SOS issues when replaying are minimized.
- Running
dxwithout any parameters now shows the root namespace for easier browsability. - The Settings menu now has options to modify the default symbol and source cache location.
- Support for recording AVX-512 (recording of AVX-512 causes a larger-than-normal slowdown) is improved.
- Offline licensing is enabled.
1.0.1905.12001
Improvements to SymSetDiaSession error mitigation: The fix to mitigate the error caused by applications injecting DbgHelp into our process wasn't working in some scenarios. We made improvements to it and continue to monitor feedback on this error.
Accent color customization: Often, scenarios need several instances of WinDbg open. Moving back and forth between them can be confusing and take some time to figure out which one is the "right" one. We added the ability to change the blue accent color to help visually distinguish sessions and make it easier to swap between them.
Select the View ribbon and select an accent color option in the last section. When future sessions are opened from recent targets, the accent color persists as part of the target's workspace.
Source tokenization improvements: The Source window now has basic support for tokenizing Rust source files and C++ SEH __try/__except/__finally/__leave.
Coroutine improvements: We improved support for coroutine local variables and certain optimized variables.
Default symbol and source cache setting: We added an option to the Settings menu under Debugging settings to change the cache location for symbols. There's a known issue that making this setting blank causes source loading to fail. We plan to add validation to prevent this issue from happening in a future release.
-pv fixes: We fixed a bug that might have prevented
-pv(noninvasive attach) from working in some circumstances.
1.0.1904.18001
- Fix for SymSetDiaSession error: We had reports of an error that prevents WinDbg Preview from opening in some situations. A few external applications attempt to inject a version of DbgHelp into our process before we load it. Some of them are using a version of DbgHelp with missing functionality, which causes this error when we attempt to use those features. We added a fix for this issue and plan to track it to determine if there are scenarios in which it still occurs.
- Font control: We added settings for controlling font and font size. There are two different settings: one is for text windows (mono-spaced windows like Disassembly, Source, and Command), and one is for tool windows (like Locals and Stack). These options don't affect a few areas. We plan to update them in the future.
- Highlighting improvements: Persistent highlighting of text in the Command window now also highlights text in the Source and Notes windows.
- Source loading improvements: We changed how loading source files works. Previously, when you opened a source file, engine operations like running more commands weren't possible or were unpredictable. We changed where the loading occurs to enable better parallelism and more reliable cancellation of source opening operations.
Other changes and bug fixes
- Added Go to Disassembly to the context menu of the Source window.
- Added a Follow current instruction checkbox in the Disassembly window.
- Fixed a bug that caused the Command window to perform slowly when it outputs large amounts of text.
- Changed Page up and Page down keys to perform similarly to Visual Studio.
- Made changes so that when an ASM file is opened in the Source window, it now has basic comment, string, and directive highlighting.
1.0.1812.12001
This version includes the following updates:
- Debugger data model C++ header: There's a new C++ header,
DbgModel.h, included as part of the Windows SDK for extending the debugger data model via C++. For more information, see Debugger data model C++ overview. This release includes a new extension that adds more API-style features to the debugger data model that can be accessed through thedxcommand, JavaScript, and the newDbgModel.hheader. This extension extends the data model to include knowledge about assembly and code execution through the Debugger.Utility.Code namespace and the local file system through the Debugger.Utility.FileSystem namespace. - Synthetic types extension: With this new API extension, we have a new sample up on our GitHub repo. This JavaScript extension reads basic C header files and defines synthetic type information for the structures and unions defined in the header. Through the
dxcommand, memory can then be viewed structured as if you had a PDB with type information for those types.
Other changes and bug fixes
- WinDbg Preview now more intelligently handles bringing Source windows or the Disassembly window to the foreground when stepping.
- The WinDbg Preview window title was rearranged to have more important information at the start when kernel debugging.
- The alternating background contrast in the Command window should be slightly more noticeable.
1.0.1810.2001
This version includes these updates:
- Added a new Settings dialog that you can access from the File menu or the Home ribbon.
- Added an events and exceptions settings dialog. This menu changes how the debugger handles events and exceptions, the equivalent of the
sxcommands or WinDbg's event filters dialog. On the Home ribbon, select Settings. Then on the left menu, select Events and Exceptions to manage events and exceptions. - Improved the TTD indexer with better performance. This improvement increases the performance of indexing TTD trace files, which makes the indexing process faster (between 2 times and 10 times) while making index files smaller (~50% smaller). The performance improvements are most noticeable for traces over 4 GB in size, or when you use a machine with many CPU cores (8+). The new indexer makes it more feasible to debug large traces (50 GB+).
- Added a new
debugArchlaunch flag for specifying architecture. WinDbg Preview attempts to launch the debugger engine with the correct bitness to the target to better support debugging managed code. There are circumstances where it can't determine the right bitness, or you might want to override what it decides. Use-debugArchx86|amd64 to control the architecture of the debugger engine.
Other changes and bug fixes
- Fixed a bug that caused black bars to appear on a full screen debugger with a floating window open.
- Fixed a bug that caused symbol options to be cleared unintentionally.
- Preserved command history now when opening from recent targets.
- Supported editing in the data model window where you can now edit values.
- Made TTD traces clearer because they're unindexed.
- Improved the performance of the Locals window.
- Added a ribbon button to save the Command window logs to a file.
- Added
. SelectMany(\<projection\>)to the default set of LINQ methods.
1.0.1807.11002
This version includes the following updates:
- Automatic saving and loading of breakpoints: This step is the first step to replace workspaces. You can now save and load breakpoints. Launching something that you debugged previously from the Recents tab on the File menu now loads the breakpoints from that session. The plan is to expand this functionality to preserve more information across sessions. Hardware breakpoints (
ba) and other various properties on breakpoints like thread and process-specific contexts and conditions aren't currently being saved.
Minor changes and bug fixes
- Added command-line options
-x,-xe,-xd,-xn, and-xifor controlling the handling of exceptions and events. These command-line options behave like their command counterparts. - Added support in the Notes window for bold, underline, and italic formatting.
- Fixed some zoom and scrolling issues.
- Added support so that selecting text in the Command, Memory, Source, or Disassembly windows now highlights other instances of the selected text.
- Fixed a bug where interrupting symbol loading caused symbol loading to fail for the rest of the session.
- Fixed a bug so that NatVis now reloads properly when a session restarts.
1.0.1805.17002
This version includes the following updates:
New Disassembly window: The window now includes:
- Scrolling up or down now continuously loads more disassembly whenever possible.
- Highlighting is used to identify syntax for numbers, code addresses, and operation codes.
- Selecting a code symbol jumps the Disassembly window to that location.
- Hovering over numbers shows a tooltip that converts that number to other bases.
- Using headers signifies the start of a function.
Faster Source window: The Source window was updated to be faster and more resource efficient.
Minor changes and bug fixes
- Fixed issues around symbol caching.
- Fixed some cases where toggle initial break wasn't usable when the target wasn't broken in.
- Added support so that if you select a tab in the Command window with nothing available, the cursor now stays in the input field.
- Added support so that WinDbg Preview now autodetects bitness when it opens CAB files.
1.0.1804.18003
This version includes the following updates:
Symbol status and cancellation improvements: There are times where the debugger displays BUSY loading symbols, and it's difficult to determine what it's doing and why without having
!symnoisy enabled. We updated WinDbg Preview to have some better communication around what it's doing when loading symbols to help troubleshoot any issues.In addition to changes that let you see what's happening, we also made some changes that make canceling symbols more reliable. The Logs window contains some of the details that are normally output when
!symnoisy is enabled. If you select View > Logs, you get the full noisy symbol loading output without having to turn it on and attempt to reload the symbols.Experimental Notes window: WinDbg Preview now has a window for taking notes. Select View > Notes to open it. If you copy/paste into it, DML links are preserved and still work as if it was the Command window. You can also save and load notes files from the Notes ribbon when the window is open.
Experimental faster Source window: To help improve the performance of WinDbg Preview, an experimental new Source window is more efficient. A few gaps exist around context menus and syntax highlighting, but we want to give everyone the option of trying it out before we finish it to give us early feedback. Run
$UseFastSourceWindowto use it. If you want to go back to the old one, run$UseMonacoSourceWindow. The setting preserves across sessions. You need to close and reopen Source windows to get the new version.JSProvider API version 1.2: For JavaScript extensions that declare support for API version 1.2:
- Any object with a
.compareTomethod that exits the script has a custom comparator on it. (Comparison operators work in the DX evaluator and elsewhere. An example isIModelObject::Compare.) - Any object with a
.equalsmethod that exits the script has a custom equality operator on it. (The==and!=operators work in the DX evaluator and elsewhere. An example isIModelObject::IsEqualTo.) - Native or data model objects that enter the script have
.compareToand.equalson them, which allows access to any custom comparator or custom equality implementations.
- Any object with a
Minor changes and bug fixes
- Added support so that
.servernow lists a fully qualified domain name for easier use when there are domain issues around short names. - Added support so that Ctrl+G now works in the Source window.
- Added an address bar to the Disassembly window.
- Added support so that WinDbg Preview now handles
_NT_SYMBOL_PATHin a more expected way. - Added the
-servercommand-line option. - Added support so that TTD data model queries are now displayed progressively. If you interrupt it, you still see some results. This feature is experimental and optional. Run
dx @$cursession.TTD.AsyncQueryEnabled = 1to enable it. - Added support so that the
dpscommand now has links to the source files to which it refers.
1.1801.19001.0
This version includes the following updates:
- Text highlighting: You can now highlight all instances of selected text directly in the debugger. To use this feature, select some text in the Command window and then select Highlight on the Command ribbon. You can also select Ctrl+Alt+H. If you use one of those options on already highlighted text, the highlighting is removed.
If you prefer to use commands, you can use the $hl command:
$hl ["someValueHere"]: Highlight gives text (or clear highlighting if already highlighted).
$hl clearAll: Clear all highlighted entries.
$hl caseSensitive [1|0]: Set highlight matching to case sensitive or case insensitive. (The default is case insensitive.)
This release also includes some minor bug fixes.
1.1712.15003.0
This version includes the following updates:
TTD memory queries: You can now query TTD for memory accesses in a similar manner to how you query for calls today. You can now find all the reads, writes, and executions that access a specific range of memory.
- Read and write example:
dx @$cursession.TTD.Memory(startAddress, endAddress, "rw") - Unique execution example:
dx @$cursession.TTD.Memory(startAddress, endAddress, "ec")
- Read and write example:
Settings changes: WinDbg Preview now automatically saves settings between sessions, including your symbol path and source path.
JavaScript improvements
- The 64-bit numbers and numerics in JavaScript now contain a modulo method, which allows a true 64-bit modulo operation.
- Objects defined in JavaScript can now implement a custom comparable or equitable notion. It works in
dxby using standard C++ operators or in LINQ operations. To use this functionality, the script must declare in theinitializeScriptarray that it supports a new version of the host API by inserting a recordnew host.apiVersionSupport(1, 2). Afterward, you can use these functions in anydxor Data Model Window LINQ query. If the method implements.compareTo(other), it's comparable (comparison operators work indxand LINQ). If the method returns a negative value, thenthis < other. If the method returns zero, thenthis == other. If the method returns a positive value, thenthis > other. If the method implements.equals(other), it's equitable (==works indxand LINQ). The method must return either true or false.
Minor changes and bug fixes
- Fixed a bug where the Stack and Locals windows weren't working during boot debugging.
- Updated the output of LM to more accurately report
ProductVersionand similar fields. - Enabled the Step Out Back button during TTD sessions.
- Added support for
-lsrcpath. - Fixed the headers in the Locals, Watch, and Model windows so that they don't disappear when you scroll down.
- Added support so that when you use Alt+Tab to go back to WinDbg Preview, the Command window properly preserves the cursor location.
- Added the Ctrl+Alt+V shortcut for toggling verbose mode.
- Added support so that you can now disable autoscrolling of the Command window by selecting and holding (or right-clicking) the Command tab and selecting Turn off auto scrolling.
- Added support so that you can now debug child processes through the launch executable advanced page.
1.0.14.0
This version includes the following updates:
- Improved process server experience: A new notification on the File menu shows what process server you're connected to and interacting with. As part of these changes, when a debugging session is ending, the process server connection persists and you can disconnect on the File menu.
- New preset layout options on the View ribbon: A new Layouts option is available on the View ribbon. There are currently three layouts: the default, one focused on disassembly, and one minimal.
- Time Travel Debugging ribbon: An enhanced Time Travel ribbon appears when you debug a TTD trace.
- Metadata from JavaScript scripts: JavaScript extensions can now return metadata for properties and other constructs. The extension can now provide help strings, indicate the display radix for values, and more. Metadata is provided by placing a metadata descriptor on an object via either the presence of
Symbol.metadataDescriptoror an explicit call tohost.metadata.defineMetadata. Function returns, iterated values, and other value contexts can return metadata for their value viahost.metadata.valueWithMetadata. - JavaScript API updates: Some potentially source-level breaking changes were made to the APIs within the JavaScript provider (including new projected methods and properties on native objects). Existing extensions won't see any of the potentially breaking changes without indicating that they support a new version of the JsProvider API. Support for the new API version is indicated by placing a
host.apiVersionSupportrecord in the array returned byinitializeScriptwith a claim of supporting version 1.1.
Changes in API version 1.1
- The
host.getModuleSymbolandhost.getModuleTypefunctions return null if they can't find the symbol instead of throwing an exception. - All native objects have the address property on them in addition to
.targetLocation. If the object doesn't have an address, an exception is thrown when accessing the property. - All native objects have new
.getObjectValueand.setObjectValuemethods on them to access properties on the object, which might conflict with names that JavaScript places on the object (for example,address).
More JavaScript changes
- JavaScript extensions can now add and remove properties on data model objects via
Object.definePropertyand the delete operator. Adding or registering a JavaScript class as a parent model or type signature is still the preferred way of manipulating the object model. - JavaScript extensions can now modify global variables within modules in the debug target through a new
host.setModuleSymbolAPI. - All the math functions that are on the 64-bit library type (for example,
.add,.subtract,.multiply, and.divide) are also present on JavaScript numbers. - JavaScript functions and properties can now return values, which are enums through custom marshaling. A function or property accessor can return
host.typeSystem.marshalAs(value, type…)to evoke such custom marshaling. - The breakpoint command in the script debugger can now break on function names in addition to line/column positions.
- Type objects in JavaScript extensions have access to their containing module through the
.containingModuleproperty.
Minor changes and bug fixes
- Fixed formatting of conditional ribbon tabs to be less confusing.
- Reworked DML to be stricter in parsing to improve performance.
- Made various fixes with the performance and behavior of Ctrl+F.
- Added a warning when running unelevated before trying to use TTD.
- Added the option to override automatic target bitness detection.
- Disabled various File menu and ribbon options when they can't be used (like Go when in a dump file).
Known issues
SOS doesn't work on x86 traces.
1.0.13.0
This version adds time travel tracing. With Time Travel Debugging, you can record a process and then replay it later both forward and backward. TTD can help you debug issues easier by letting you "rewind" your debugger session instead of having to reproduce the issue until you find the bug. For more information, see Time Travel Debugging: Overview.
1.0.12.0
This version was the first release of WinDbg Preview. For general information on the features that are available in WinDbg Preview, see Major features of WinDbg.