Note
Access to this page requires authorization. You can try signing in or changing directories.
Access to this page requires authorization. You can try changing directories.
The Network Monitor tool (NetMon.exe) is an archived Windows-based application that you can use to view traces from WPD components. The Network Monitor tool replaced WpdMon.exe.
Installing and configuring NetMon.exe
To install and configure the Network Monitor tool, complete these steps:
Download and install NetMon.exe.
Download and install the Windows Driver Kit (WDK).
Install the WPD parsers on your development machine by starting an instance of Powershell.exe with Administrator permissions and running the following sequence of commands.
PowerShell -ExecutionPolicy RemoteSigned
cd C:\Program Files (x86)\Windows Kits\10\Tools\10.0.22621.0\x86\Network Monitor Parsers\usb..\NplAutoProfile.ps1
cd ..\wpd
..\NplAutoProfile.ps1
The WPD parsers are included in the Windows Driver Kit (WDK).
Configure the NetMon.exe options by using the Tools/Options dialog:
- In the General tab, select the Use fixed width font in Frame Summary box.
- In the Color Rules tab, select Open and then select
C:\Program Files (x86)\Windows Kits\10\Tools\10.0.22621.0\x86\Network Monitor Parsers\wpd\wpd.nmcr. Select Open, followed by OK.
After you complete these steps, NetMon.exe is ready to examine WPD trace files. Follow the instructions in the Collecting traces section.
Collecting traces
To generate traces, create a command script. Copy the following to a text file and save it with the .cmd file name extension.
echo off
@REM ---------------------------------------------------------------------------------------
@REM UNCOMMENT THE LOGMAN COMMANDS FOR THE FOLLOWING PROVIDERS AS REQUIRED
@REM Microsoft-Windows-WPD-API                 To log API traffic
@REM Microsoft-Windows-WPD-MTPClassDriver      To log MTP command, response and datasets
@REM Microsoft-Windows-WPD-MTPUS               To log USB traffic at WpdMtpUS layer
@REM Microsoft-Windows-WPD-MTPIP               To log IP traffic at WpdMtpIP layer
@REM Microsoft-Windows-WPD-MTPBT               To log BT traffic at WpdMtpBt layer
@REM Microsoft-Windows-USB-USBPORT             To log USB core layer traffic
@REM Microsoft-Windows-USB-USBHUB              To log USB core layer traffic
@REM ---------------------------------------------------------------------------------------

@REM Start Logging

logman start  -ets WPD -p Microsoft-Windows-WPD-API            -bs 100 -nb 128 640 -o wpd_trace.etl
logman update -ets WPD -p Microsoft-Windows-WPD-MTPClassDriver -bs 100 -nb 128 640
logman update -ets WPD -p Microsoft-Windows-WPD-MTPUS          -bs 100 -nb 128 640
logman update -ets WPD -p Microsoft-Windows-WPD-MTPIP          -bs 100 -nb 128 640
logman update -ets WPD -p Microsoft-Windows-WPD-MTPBT          -bs 100 -nb 128 640
logman update -ets WPD -p Microsoft-Windows-USB-USBPORT        -bs 100 -nb 128 640
logman update -ets WPD -p Microsoft-Windows-USB-USBHUB         -bs 100 -nb 128 640
logman update -ets WPD -p Microsoft-Windows-Kernel-IoTrace 0 2
echo.
echo Please run your scenario now and
pause

@REM Stop logging
logman stop -ets WPD
After you create the command file, run it from an Administrator mode command prompt.
If you used the contents of the sample command file, your traces are stored in the file wpd_trace.etl.
Viewing traces
To view your traces, launch NetMon.exe, select the File/Open/Capture menu, and open the collected wpd_trace.etl file. When you open a trace file, NetMon.exe displays the traces at various layers:
- WPDAPI – Displays information from WPD API level with WPD commands and responses
- WPDMTP – Displays information from Media Transfer Protocol (MTP) level with MTP commands and responses
- Transport (WPDMTPUS or WPDMTPIP or WPDMTPBT) – Shows transport level packets
The following image shows a WPDAPI request at API level. The request travels through WPDMTP in the form of MTP requests that reach a transport and then bubble up.
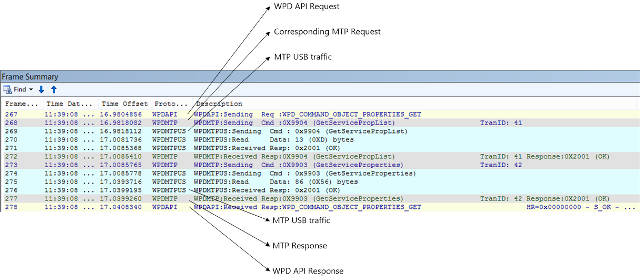
- The transport-level logging doesn't log the actual data during the data phase. Examine the WPDMTP Response message for the datasets that were sent or received during commands like GetDeviceInfo or SendObjectPropList.
- If you select a WPDMTP Response line in the Frame Summary window, the corresponding item expands in the Frame Details window.
- Select the "+"s in the Frame Details window to expand further and explore. If an MTP operation has a dataphase, the dataset received from the device is available under the DataSetOfDataPhase field of a WPDMTP Response item.
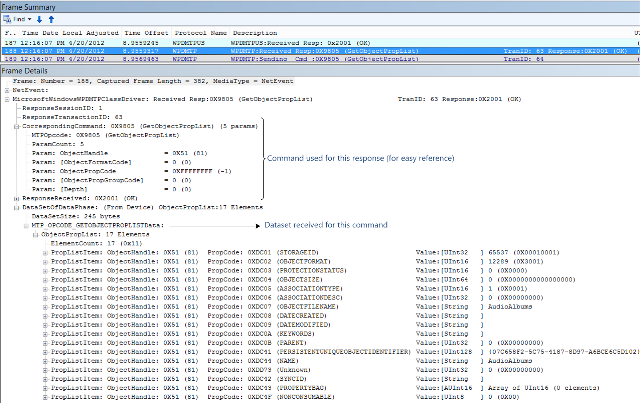
- You can select to expand the items and see that the Frame Details window displays WPD/MTP friendly messages. The convention followed when writing the WPD parsers is that you can see summary of the details at the header level. For example, in a GetServiceCapabilities call, the DataSetOfDataPhase field shows next to it, the number of formats in that dataset.
- You can remove the Source and Destination columns in the Frame Summary window to improve clarity
- When you select a field in Frame Details window, the corresponding value is highlighted in the Hex Details window.
Filtering with NetMon.exe
The Network Monitor tool provides several filtering capabilities.
To show only the MTP traces, enter
!wpdmtpin the Display Filter window and select Apply.To filter for cases where the driver returned an error:
- Enter wpderror != 0 in the Display Filter window and select Apply.
You can filter for all of the method calls for a given scenario. For example, the following filter would retrieve all of the calls to GetServiceProperties:
WPDMTP.CorrespondingCommand.MTPOpcode == 0x9304
Similarly, the following filter would retrieve the same method calls:
WPDMTP.CorrespondingCommand.MTPOpcode == MTP_OPCODE_GETSERVICEPROPERTIES