Note
Access to this page requires authorization. You can try signing in or changing directories.
Access to this page requires authorization. You can try changing directories.
SensorExplorer is an app available on the Microsoft Store and the app package can be accessed through GitHub. SensorExplorer offers tests to quickly verify the installation of supported sensors such as orientation sensors (accelerometer, simple orientation sensors, etc.) and provide detailed tables and plots that enable monitoring different sensors. SensorExplorer also provides logging that can be reviewed for debugging.
There are five modes available via the menu bar on the left-hand side in SensorExplorer:
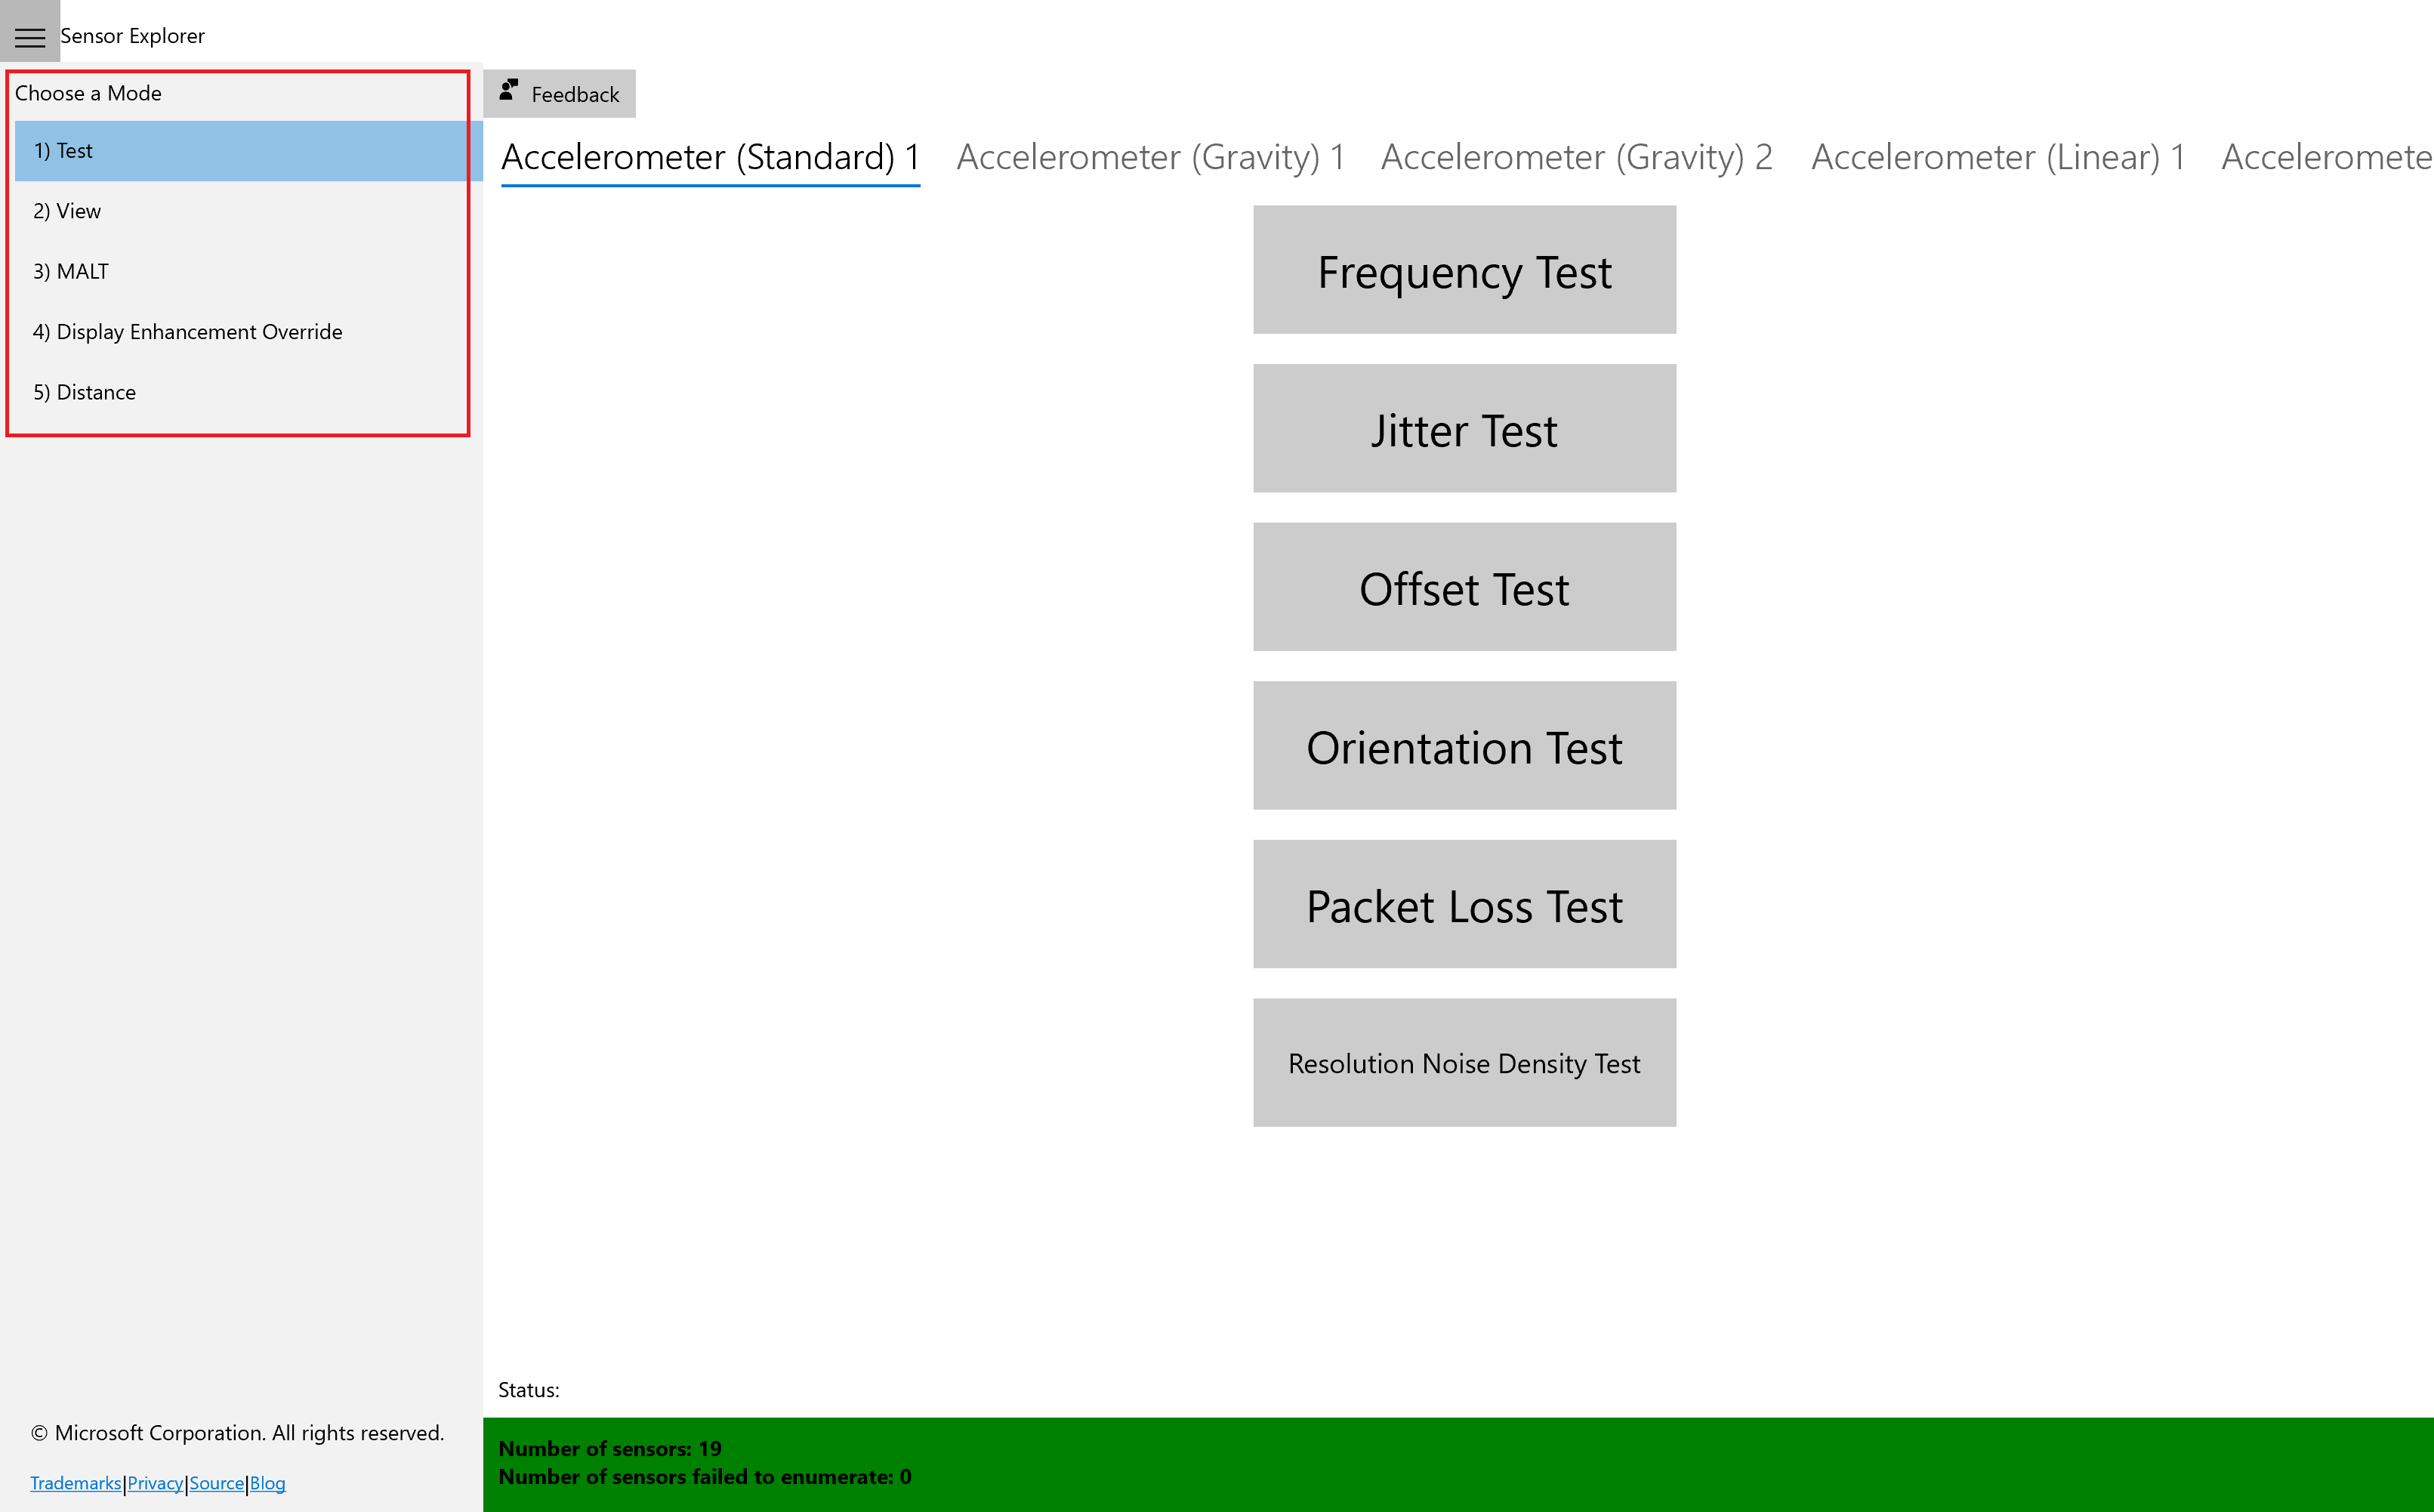
Test: Used for manual testing of supported sensors. The orientation test verifies orientation sensors are installed in the correct position and the sensor data is as expected. Other tests such as frequency, offset, and jitter, are also available. The sensor data is read using the UWP Sensors API.
View: Used for viewing sensor data and properties. In this mode, the app displays a data visualization from various sensors such as accelerometer, compass, gyrometer, inclinometer, light sensor, and orientation sensor and shows detailed sensor information in tabular format. This mode provides monitoring of any abnormal behaviors of the sensors, and can also be used to set the report interval of sensors.
MALT: Used for connecting to and controlling a MALT (Microsoft Ambient Light Tool), a simple low-cost light testing apparatus. The tool combines a microcontroller, light sensors, and a controllable light panel to calibrate light sensors and visually measure a panel's light curve.
Display Enhancement Override: Used for overriding display settings. In this mode, sliders and scenario buttons are exposed to set display brightness in various ways. To override the display given your settings, select the Override Requested slider.
Distance: Used for manual and automatic testing of supported human presence sensors. To determine the accuracy of the human presence sensor, the manual test uses predefined distances. The automatic test uses the sensor, a front-facing camera with facial detection, and bounding boxes.
Utilities
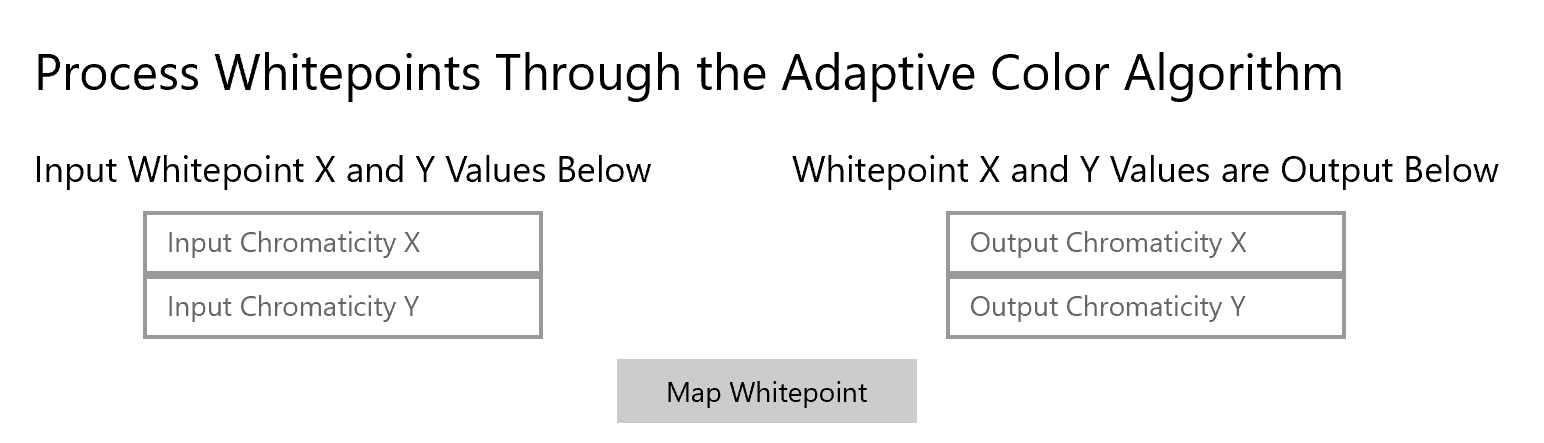
Inside of the view pane, if you select a Light Sensor, a whitepoint calculation utility is exposed. By selecting Manually Calculate Whitepoint, this utility allows for running X and Y chromaticities through Microsoft's Adaptive Color algorithm. The input should be an ambient light and the output is Windows' mapped value.
How to test your sensors with SensorExplorer
Tests available for each sensor can be explored by scrolling the top menu bar, highlighted in this screenshot as a red box:
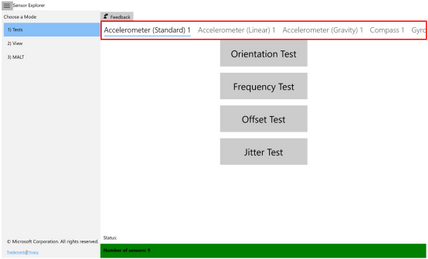
SensorExplorer orientation test
This test asks you to orient the device in different directions and then checks the sensor reading accordingly. A pass or fail result is displayed at the end of the test.
Before beginning orientation tests
Under the test mode, if the display rotates when the device is rotated, turn off autorotation on the device. Search for "Rotation Lock" in Settings and turn it on. Otherwise, autorotation doesn't need to be turned off. For more information on orientation and reference frame, see Device Reference Frame.
Starting the tests
Select the Start button to begin the tests. For each test, you have 10 seconds to orient the device so that the arrow on the screen is pointing down toward the ground.
- You can select the icon (highlighted in the screenshot as a red box) to hide the menu bar during the test.
- The menu bar is disabled during the test. It's re-enabled when the test finishes.
- For the Simple Orientation Sensor the four directions tested are face-up, face-down, left, and right. For all other sensors, the four directions tested are up, down, left and right.
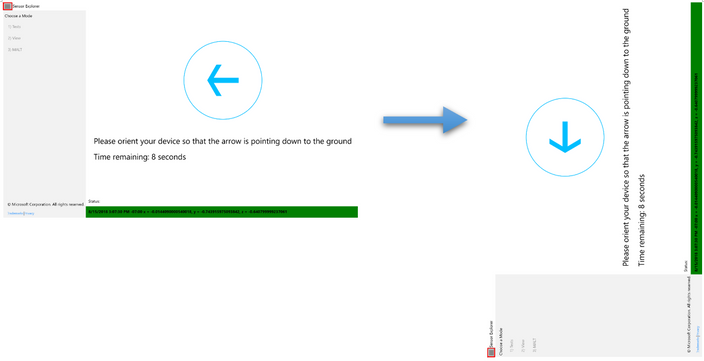
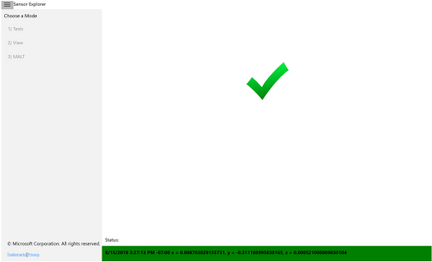
Once the sensor data reflects that your device is indeed in the desired orientation, a green checkmark is displayed. Then, you automatically move on to the next test.
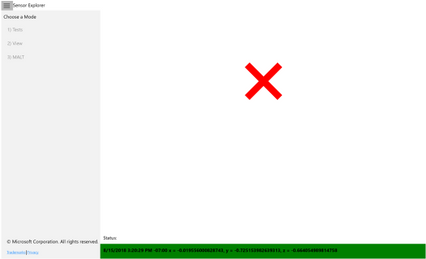
Otherwise, after 10 sec, a red 'X' is displayed, indicating that this round of tests failed.
After the tests
Select the Save Log button to save the log file. Data for all rounds of tests is saved. Select the Restart button to start another test.
Frequency Test
Calculates the number of sensor readings received/60 seconds. A numeric value is displayed at the end of the test.
Offset Test
Calculates the average error in sensor readings compared with the expected value. A numeric value is displayed at the end of the test.
Jitter Test
Calculates the maximum difference in sensor readings during a period of time, compared with the initial reading. A numeric value is displayed at the end of the test.
Resolution Noise Density Test
This test checks actual sensor resolution and noise of the physical accelerometer sensor in the device. A numeric value is displayed at the end of the test.
How to monitor your sensors
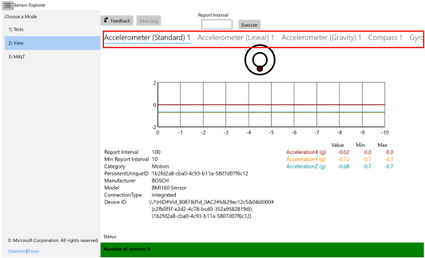
The View mode automatically detects any sensors that are attached to or embedded in the platform and displays the information read from the sensors. To change the sensor being displayed, scroll the top menu bar (highlighted in the screenshot as a red box). For each sensor, the current data and properties are shown in a table and plotted as moving waveforms. The report interval of a specific sensor can be changed here.
Additional information on logging
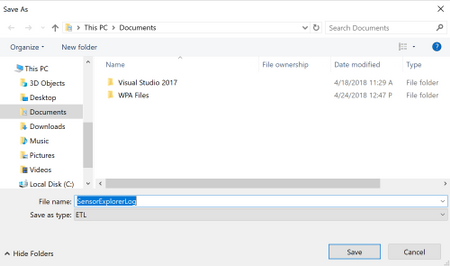
The Save Log button prompts for the name and location of the Event Trace Log (ETL) file, with the default name SensorExplorerLog. To view the ETL file, use the tracerpt command.
The following data is logged:
Properties of the selected sensor
Information about each test
For orientation tests:
- The sensor reading when a test is passed
- The last sensor reading before the countdown ends when a test fails
For other tests:
- All sensor readings collected during the test
- The final result