Note
Access to this page requires authorization. You can try signing in or changing directories.
Access to this page requires authorization. You can try changing directories.
The methodology used to analyze the data can take several approaches and differs based on the circumstances under which the investigation was started. This exercise discusses and presents some example methodologies along with the different views presented by various column arrangements.
The data referred to as the Resident Set is the set of pages that currently reside in physical memory (RAM). The Resident Set is a snapshot of the current memory state at the end of a trace capture with Windows Performance Recorder (WPR) or the Assessment Toolkit Memory assessment. It is not possible to collect multiple snapshots in a single trace.
Resident Sets provide a holistic and instantaneous snapshot of the memory composition on the system. Investigations into Resident Set analysis are typically done for the following reasons:
To understand physical memory usage, especially when physical memory usage is higher than expected.
To understand the sources of process private working set, especially when the process private working set is larger than expected.
System responsiveness issues due to paging activity.
Step 1: Collect data using the Assessment Toolkit
The Windows Assessment Toolkit contains a test to measure the memory footprint after boot. You can use the Memory Footprint assessment results to gather a baseline of the image software preload. Many processes and services are always in use and take up memory. This assessment helps you to see how drivers and applications (that always run) impact the boot process.
Open Windows Assessment Console (WAC) from the Start menu.
Open the Options menu and select New Job…
Enter MemoryTest as the job name.
Select Create a custom job.
Click on Add Assessments.
- Add the Memory Footprint assessment by clicking on the “+” symbol
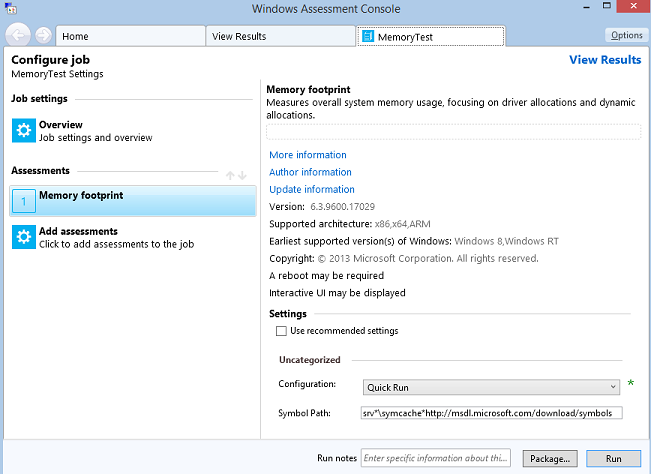
Click on the newly added Memory Footprint assessment to enter the test configuration.
Unselect Use recommended settings and select Quick Run for the configuration.
- Quick Run allows the test to complete in a shorter amount of time at the expense of data accuracy.
With Quick Run selected, you have two options:
Package the job in order to create a folder that has all the test resources and copy it to another test system. (Click on the Package… button in the bottom right corner to choose this option.)
Run the job directly on the system. (Click on the Run button in the bottom right corner to choose this option.)
This restarts the system to gather a trace.
This test can take some 15-20 minutes to complete.
We want the Run option.
Step 2: Visualize the Memory Footprint assessment results using WAC
Once the assessment is done, you can open the results XML file that contains a summary of the memory usage on the system.
Step 2.1: Open the memory report
In WAC, open the Options menu and select Open Results…
- You can also press CTRL+R on the keyboard.
Click on the Browse… button.
Navigate to the folder where you stored the assessment you created in Step 1.
Open the assessment you created in Step 1.
The report contains different categories to help you understand the driver and process contributions to the overall memory footprint.
The report should look something like this.
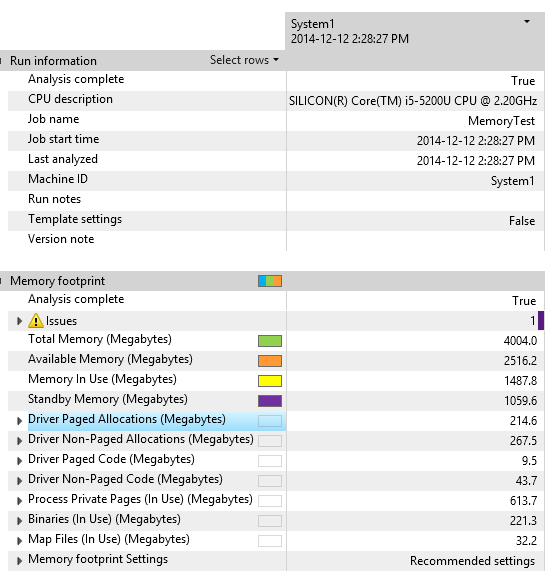
Take the time to familiarize yourself with the report by looking at the Driver and Process Private Pages categories.
In the preceding example, 1487 MB of memory is used out of 4 GB of physical RAM.
Memory In Use = Process working sets + non-paged memory + modified pages
Available memory = Standby memory + free memory
In the preceding example, the biggest consumers of memory usage are driver allocations with 267 MB for non-paged, and 613 MB for process private pages (private working sets).
For more information about the metrics, see the Results for the Memory Footprint Assessment topic on MSDN.
Step 2.2: Review driver non-paged allocations
This metric is similar to the paged allocations except that these allocations use physical memory that cannot be paged out. This reflects physical memory that is pinned and therefore unavailable for paged memory or use by other processes and services. Acquiring too much non-paged memory reduces the amount of memory that backed memory can use.
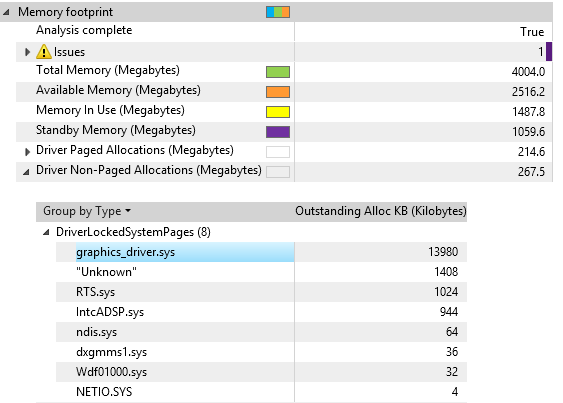
Expand the Driver Non-Paged Allocations category by clicking on the arrow on the left.
Expand the DriverLockedSystemPages category.
- This is memory loaded in from paged memory and then locked by the driver until it is no longer useful.
Identify the driver with the biggest memory usage.
You can influence this metric by swapping out hardware or software drivers that have lower memory requirements.
The driver vendor has the most influence over this metric by the way the driver is designed. Look for large memory allocations in the results presented in WAC. In addition, the driver vendors can be given performance traces (stored in the same directory as the assessment results and can be analyzed with WPA) of this assessment to find areas of heavy memory allocation that are candidates for investigations into reducing memory use.
Step 2.3: Review process private working sets
The largest users of the overall memory footprint are apps that may always be running in the background without the user’s knowledge. To view the amount of memory that processes use, you can use the Process Private Pages category in the report.
Expand the Process Private Pages category by clicking on the arrow on the left.
Expand the Active category. The list shows the binaries and their usage of active memory.
Your view should look something like this:
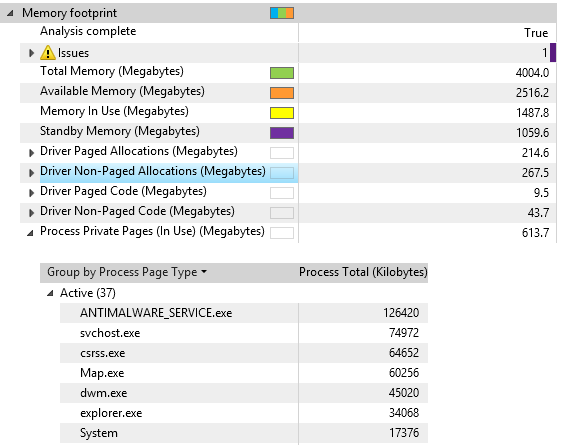
Identify the process that uses the most memory.
You can influence this metric by reducing the number of “run always” applications, which are applications in the Run registry key or Startup folder. Analyze the impact of added apps.
Driver and software vendors have the most influence over this metric by the way their code is designed. Look for large memory allocations in the results presented in the WAC. In addition, software vendors can be given performance traces (stored in the same directory as the assessment results) of this assessment to find areas of heavy memory allocations that are candidates for investigations into reducing memory use. Careful analyses of allocations, even small ones, can help the developer to find allocations that add up.
Step 3: Collect Resident Set data using WPR
In steps 1 and 2, you learned how to gather memory traces using the Assessment Toolkit Memory Footprint assessment. This assessment can solely capture a trace for the boot scenario. You can capture traces for any scenario (app launch, web browsing, etc.) using the Windows Performance Recorder (WPR)
Follow these steps to gather a trace with Resident Set data.
Open Windows Performance Recorder from the Start menu.
Select the "First Level Triage" and "Resident Set analysis" recording profiles, but keep the default values for the other options.
Click Start and wait a few seconds.
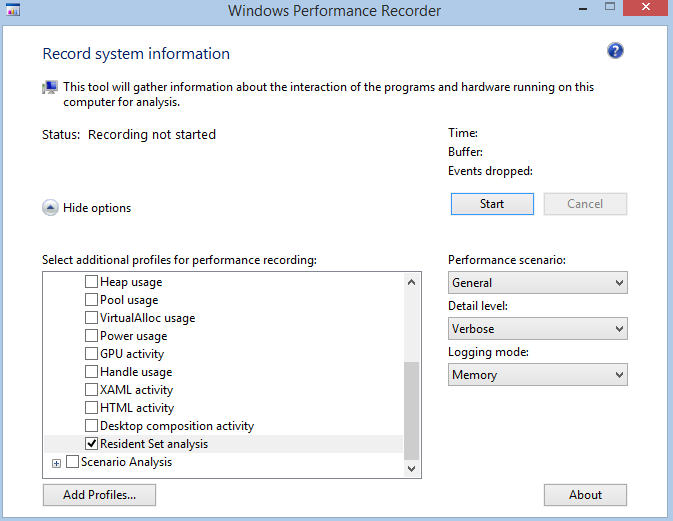
Click Save and save the ETL trace to disk.
You now have a snapshot of the system memory composition.
Step 4: Interpret Resident Set data using WPA
Follow this procedure:
Launch Windows Performance Analyzer from the Start menu.
Open the ETL trace you just gathered (File menu, Open…).
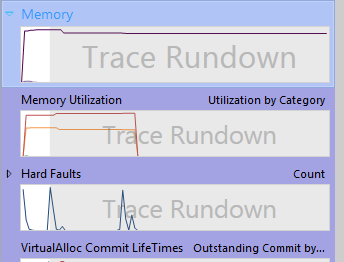
Expand the Memory set in the Graph Explorer.
Drag and drop the Resident Set graph into the Analysis tab.
Your view should look something like this:
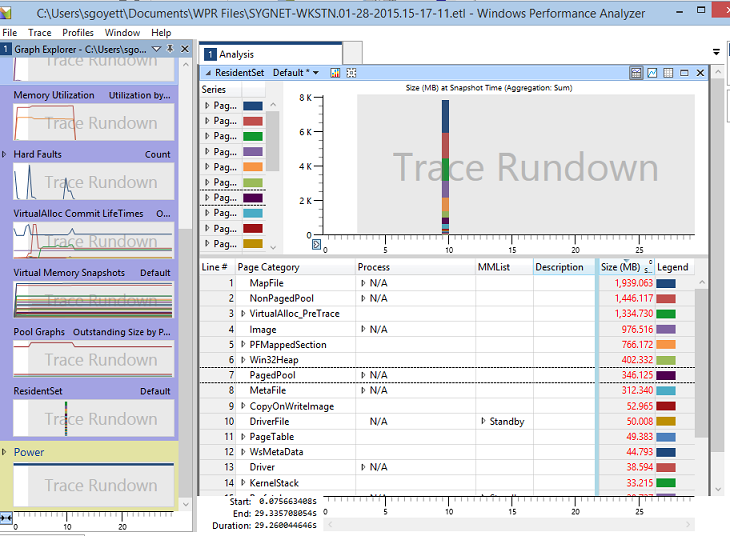
Review how the data is presented. Here are some definitions of the most helpful columns to perform top level analysis:
| Column | Definition |
|---|---|
| MMList | The memory management list that contains the pages.
|
| Process | The name of the process that is the owner of the pages. This information is available only for process private pages. Even if they are not shared, all shareable pages are associated with the “Unknown” (-1) process. |
| Description | The value represented varies depending on the page category. For example:
|
| Page Category | The type of data contained within the page as defined below. Some of the possible categories are:
|
| Size (MB) | The total size of the pages aggregated in each category. |
Step 6: Identify process working sets that impact the memory footprint
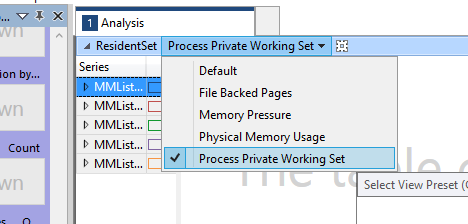
Resident Set data can be displayed in many different ways based on the column arrangements in the summary table. The summary table has several pre-defined column arrangements that you can use as starting points for an investigation.
Select the Process Private Working Set preset.
Expand the Active MMList group.
Focus on the Active category as it is what’s currently impacting memory usage.
Standby pages could be freed under memory pressure.
Modified pages could be written to disk and freed.
Sort by size by clicking on the Size (MB) column header.
Identify the processes with the largest usage. You might see N/A and “Unknown (-1)” as process names.
N/A contains pages not associated to any processes such as driver pool memory.
“Unknown (-1)” contains shareable pages.
Expand the processes to look at Page Category.
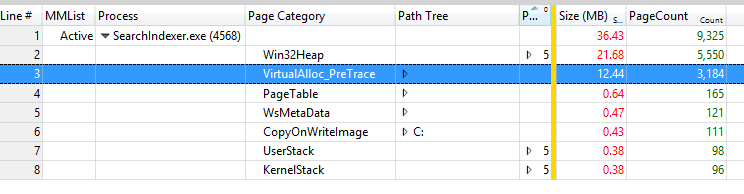
You can now see the composition of the process working set in the following figure.
Top categories should be VirtualAlloc or Win32Heap, which we’ll analyze in Exercise 2.
In the example below, SearchIndexer.exe uses 21.7 MB of active memory through Heap allocations, and 12.4 MB through VirtualAlloc API calls.
Focus on 3rd-party processes and determine if they need to be launched on boot as part of the preloaded software. As a developer, you should analyze the dynamic allocations your process is making to understand where optimizations can be made.