Note
Access to this page requires authorization. You can try signing in or changing directories.
Access to this page requires authorization. You can try changing directories.
This article explains how to monitor DNS over HTTPS (DoH) activity on DNS Server using event logs and performance counters.
When you enable DoH on your DNS Server, you need visibility into encrypted DNS traffic for capacity planning, performance analysis, and operational awareness. Because DoH traffic is encrypted, traditional network monitoring tools can't inspect the DNS queries. The DoH-specific events and performance counters described in this article help you track encrypted query activity, measure throughput, and identify potential problems with your DoH service.
DoH encrypts DNS traffic by encapsulating DNS messages within HTTPS. To learn more about how DoH works, see DNS encryption using DNS over HTTPS.
Prerequisites
Before you begin, make sure you have:
- Windows Server 2025 with the 2026-06 Security Update (KB5094125) or later installed.
- DNS over HTTPS enabled and configured on your DNS Server (see Enable DNS over HTTPS in DNS Server).
- Administrator or equivalent access to the Windows Server hosting the DNS Server service.
- Basic understanding of Windows Event Viewer and Performance Monitor.
View server logs
The system enables audit logs by default. These logs don't significantly affect DNS server performance. DNS server audit events enable startup, shutdown, and change tracking on the DNS server. To view DoH logs:
Select the Start button, type Event viewer, and open Event viewer from the best match list.
In Event Viewer, go to Applications and Services > DNS Server.
To filter for DoH-specific events, right-click DNS Server, select Filter Current Log, and in the filter dialog, enter the following DoH event IDs in the All Event IDs field:
597, 598, 599, 600, 601, 602, 603. Select OK to apply the filter.
Server events
The following table summarizes DoH audit events.
| Event ID | Type | Category | Level | Event text |
|---|---|---|---|---|
| 822 | DoH URL registered | DNS over HTTPS | Informational | Successfully started HTTP server for DNS-over-HTTPS (DoH) server. The DoH server is listening on following URL(s): %1 |
| 823 | DoH initialization failed | DNS over HTTPS | Error | The DNS server could not initialize the HTTP server for DNS-over-HTTPS (DoH) and failed with error code %1. |
| 824 | DoH sessions failed | DNS over HTTPS | Error | The DNS server could not create the HTTP server session for DNS-over-HTTPS (DoH) and failed with error code %1. |
| 825 | DoH create URL failed | DNS over HTTPS | Error | The DNS server could not register the URL: %1 for the DNS-over-HTTPS (DoH) server and failed with error code %2. |
| 826 | DoH create request queue failed | DNS over HTTPS | Error | The DNS server could not create the HTTP request queue for DNS-over-HTTPS (DoH) and failed with error code %1. |
| 827 | DoH configuration | DNS over HTTPS | Informational | The configuration for DNS-over-HTTPS (DoH) server are: %1 |
| 828 | DoH shut down | DNS over HTTPS | Informational | The DNS-over-HTTPS (DoH) server has shut down gracefully. |
| 829 | DoH shut down error | DNS over HTTPS | Error | The DNS-over-HTTPS (DoH) server has shut down due to an error and failed with error code %1. |
View analytical events
Analytical events aren't enabled by default, you need to enable them to view DoH-specific analytical events. DoH analytical events provide detailed information about encrypted DNS query and response activity, such as query names, types, response codes, and processing times. You can view DoH-specific events that track encrypted query and response activity using the following steps:
To enable DNS diagnostic logging:
From the Applications and Services Logs > Microsoft > Windows > DNS-Server node, right-select DNS-Server, select View, and then select Show Analytic and Debug Logs. The Analytical log is displayed.
Right-click Analytical and then select Properties.
If you want to query and view the logs from event viewer, choose When maximum event log size is reached, select Do not overwrite events (Clear logs manually), select the Enable logging checkbox, and then select OK when asked whether you want to enable this log.
If you want to enable circular logging, choose Overwrite as needed (oldest events first) and select Enable logging. After selecting OK, a query error displays. Logging takes place even though this error is displayed. The error only means you can't view the events that are currently being logged in event viewer.
Select OK to enable the DNS Server Analytic event log.
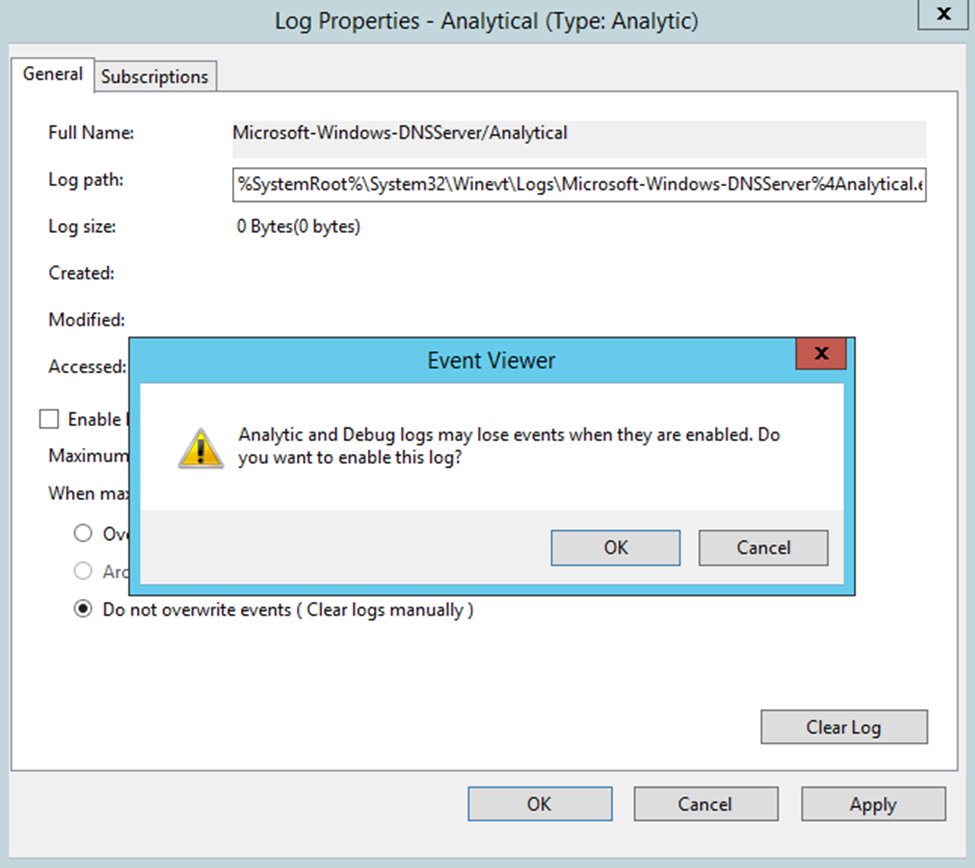
Analytic logs are by default written to the file %SystemRoot%\System32\Winevt\Logs\Microsoft-Windows-DNSServer%4Analytical.etl. The next section explains the DoH events displayed in the DNS server audit and analytic event logs.
DNS over HTTPS analytical events
DoH analytical events are similar to standard DNS analytical events, but they only track encrypted queries and responses. For more information about the logs available for the DNS Server service, see Enable DNS Logging and Diagnostics.
The following table describes DoH analytical events:
| Event ID | Type | Category | Event text |
|---|---|---|---|
| 597 | Encrypted query received | Lookup | QUERY_RECEIVED: Channel=%1; %2; InterfaceIP=%3; Source=%4; RD=%5; QNAME=%6; QTYPE=%7; XID=%8; Port=%9; Flags=%10; PacketData=%12; AdditionalInfo = VirtualizationInstanceOptionValue: %13; GUID=%14; %15 |
| 598 | Encrypted response sent | Lookup | RESPONSE_SUCCESS: Channel=%1; %2; InterfaceIP=%3; Destination=%4; AA=%5; AD=%6; QNAME=%7; QTYPE=%8; XID=%9; DNSSEC=%10; RCODE=%11; Port=%12; Flags=%13; Scope=%14; Zone=%15; PolicyName=%16; PacketData=%18; AdditionalInfo= %19; DataTag=%20; ElapsedTime=%21; GUID=%22; %23; %24; |
| 599 | Encrypted response failure | Lookup | RESPONSE_FAILURE: Channel=%1; %2; InterfaceIP=%3; Reason=%4; Destination=%5; QNAME=%6; QTYPE=%7; XID=%8; RCODE=%9; Port=%10; Flags=%11; Zone=%12; PolicyName=%13; PacketData=%15; AdditionalInfo = VirtualizationInstance: %14; ElapsedTime=%17; GUID=%18; %19 |
| 600 | Encrypted query rejected | Lookup | IGNORED_QUERY: Channel=%1; %2; InterfaceIP=%3; Source=%4; Reason=%5 |
| 601 | Encrypted response channel failure | Lookup | IGNORED_QUERY: Channel=%1; %2; InterfaceIP=%3; Source=%4; Reason=%5 |
| 602 | Encrypted DDNS update request received | Dynamic update | DYN_UPDATE_RECV: Channel=%1; %2; InterfaceIP=%3; Source=%4; QNAME=%5; XID=%6; Port=%7; Flags=%8; SECURE=%9; PacketData=%11 |
| 603 | Encrypted DDNS update response sent | Dynamic update | DYN_UPDATE_RESPONSE: Channel=%1; %2; InterfaceIP=%3; Destination=%4; QNAME=%5; XID=%6; ZoneScope=%7; Zone=%8; RCODE=%9; PolicyName=%10; PacketData=%12 |
The TCP field isn't applicable for DoH. The Channel field (%1) replaces it and carries the value of 2 for DoH traffic. Complementary information (%2) about the request or response follows the Channel field. Each event includes detailed information such as HTTP version, request ID, and status codes. For query events, the complementary information follows this format:
HTTP=Version:HTTP/2; Verb:POST; RequestID:{4987238521587782}
For response events, the format includes the HTTP status:
HTTP=Version:HTTP/2; Verb:POST; RequestID:{4987238521587782}; Status:200
Monitor performance
The following table describes the available DoH performance counters:
| Counter name | Category | Description |
|---|---|---|
| DoH Requests Received/sec | DNS-over-HTTPS | Measures the number of DoH query packets the server receives each second |
| DoH Responses Sent/sec | DNS-over-HTTPS | Measures the number of DoH response packets the server successfully sends each second, including responses from authoritative data, cached data, forwarded responses, recursion results, and responses with HTTP or DNS error codes |
| DoH Requests Dropped/sec | DNS-over-HTTPS | Measures the number of incoming DoH queries dropped by the server each second before normal processing, due to server resource limits, packet parsing errors, rate limiting, network congestion, or security policies |
Note
Performance counters reset when the DNS Server service restarts.
DoH performance counters measure encrypted DNS query activity separately from traditional DNS traffic. To monitor DoH performance, select your preferred method in the following section.
To monitor DoH performance counters using Performance Monitor, follow these steps:
Select Start, type Performance Monitor, and then select Performance Monitor from the results.
In Performance Monitor, select the Add button (green plus sign) to add counters.
In the Available counters list, expand DNS over HTTPS.
Select the DoH counters you want to monitor:
- DoH Requests Received/sec
- DoH Responses Sent/sec
- DoH Requests Dropped/sec
Select Add to add the selected counters to the monitoring graph.
Select OK to start monitoring the counters.