Note
Access to this page requires authorization. You can try signing in or changing directories.
Access to this page requires authorization. You can try changing directories.
The Packet Monitoring extension allows you to operate and consume Packet Monitor through Windows Admin Center. The extension helps you diagnose your network by capturing and displaying network traffic through the networking stack in a log that is easy to follow and manipulate.
What is Packet Monitor (Pktmon)?
Packet Monitor (Pktmon) is an in-box, cross-component network diagnostics tool for Windows. It can be used for packet capture, packet drop detection, packet filtering and counting. The tool is especially helpful in virtualization scenarios, like container networking and SDN, because it provides visibility within the networking stack.
What is Windows Admin Center?
Windows Admin Center is a locally-deployed, browser-based management tool that lets you manage your Windows Servers with no Azure or cloud dependency. Windows Admin Center gives you full control over all aspects of your server infrastructure and is particularly useful for managing servers on private networks that are not connected to the Internet. Windows Admin Center is the modern evolution of "in-box" management tools, like Server Manager and MMC.
Before you start
- To use the tool, the target server needs to be running Windows Server 2019, version 1903 or later.
- Install Windows Admin Center.
- Add a server to Windows Admin Center:
- Click + Add under All Connections.
- Choose to add a Server Connection.
- Type the name of the server and, if prompted, the credentials to use.
- Click Submit to finish.
The server will be added to your connection list on the Overview page.
Getting started
To get to the tool, navigate to the server that you created in the previous step, then go to the "Packet monitoring" extension.
Applying filters
It's highly recommended to apply filters before starting any packet capture, because troubleshooting connectivity to a particular destination is easier when focusing on a single stream of packets. On the other hand, capturing all the network traffic can make the output too noisy to analyze. Accordingly, the extension guides you to the filters pane first before starting the capture. You can skip this step by clicking Next to start capturing without filters. The filters pane guides you to add filters in 3 steps.
Filtering by networking stack components
If you want to capture traffic that passes through only specific component(s), the first step of the filters pane shows the networking stack layout so you can select the component(s) to filter by. This also is a great place to analyze and understand the layout of your machine's networking stack.

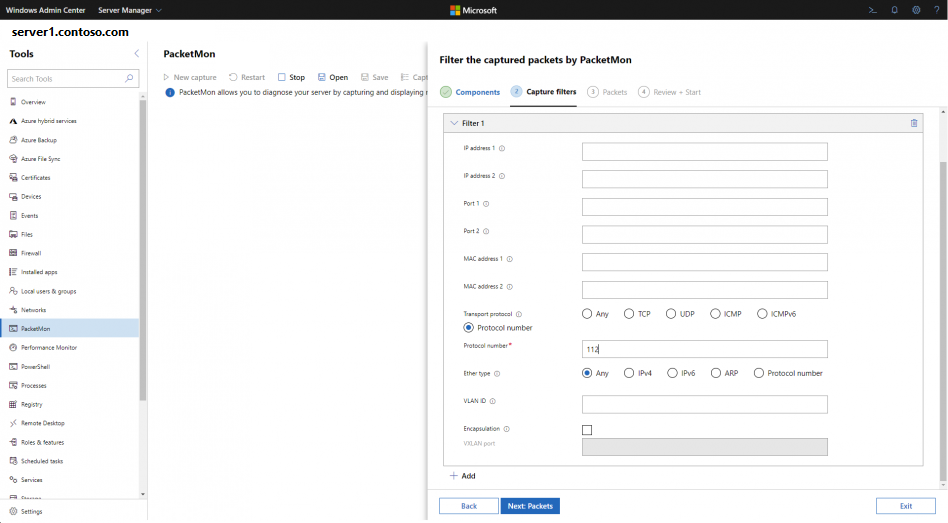
Filtering by packet parameters
For the second step, the pane allows you to filter packets by their parameters. For a packet to be reported, it must match all conditions specified in at least one filter; up to 8 filters are supported at once. For each filter, you can specify packet parameters like MAC Addresses, IP Addresses, Ports, Ethertype, Transport Protocol, VLAN ID.
- When two MACs, IPs, or ports are specified, the tool will not distinguish between source or destination; it will capture packets that have both values, whether as a destination or source. However, display filters can make that distinction; see the Display filters section below.
- To further filter TCP packets, an optional list of TCP flags to match can be provided. Supported flags are FIN, SYN, RST, PSH, ACK, URG, ECE, and CWR.
- If the encapsulation box is checked, the tool applies the filter to encapsulated inner packets, in addition to the outer packet. Supported encapsulation methods are VXLAN, GRE, NVGRE, and IP-in-IP. Custom VXLAN port is optional, and defaults to 4789.
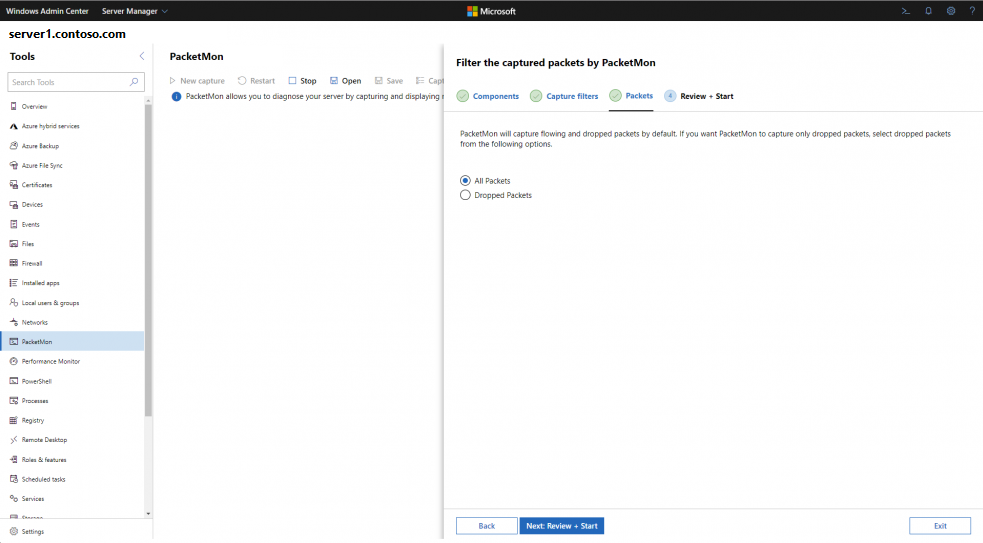
Filtering by packet flow status
Packet Monitor will capture flowing and dropped packets by default. To capture only on dropped packets, select Dropped Packets.
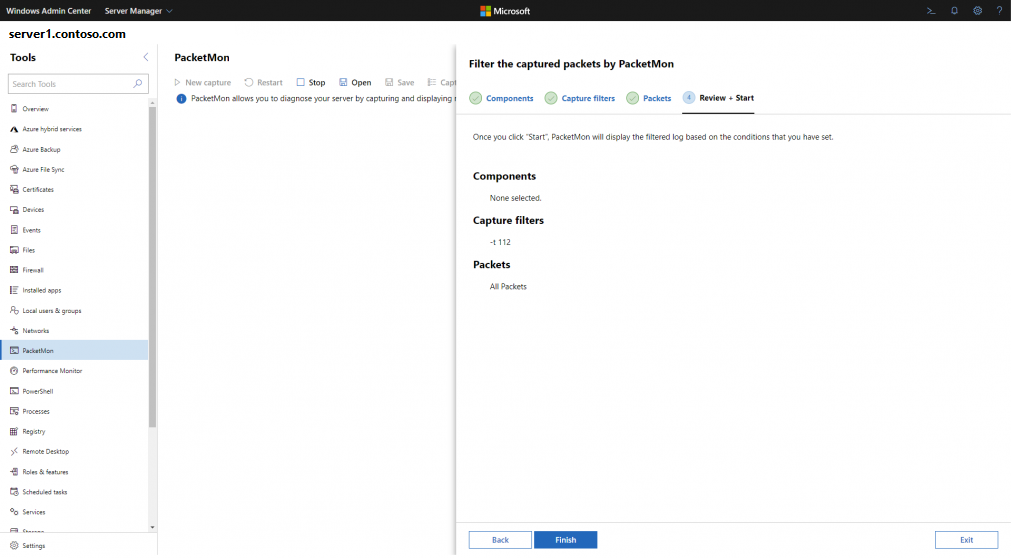
Afterwards, a summary of all the selected filter conditions are displayed for review. You will be able to retrieve that view after starting the capture through the Capture Conditions button.


Capture log
The results are displayed in a table that shows the main parameters of the captured packets: Timestamp, Sources IP Address, Source Port, Destination IP Address, Destination Port, Ethertype, Protocol, TCP Flags, whether the packet was dropped, and the drop reason.
- The timestamp for each of these packets is also a hyperlink that will redirect you to a different page where you can find more information about the selected packet. See the Details Page section below.
- All dropped packets have a “True” value in the Dropped tab, a drop reason, and are displayed in red text to make them easier to pinpoint.
- All the tabs can be sorted ascending and descending.
- You can search for a value in any column in the log using the search bar.
- You can restart the capture with same chosen filters using the Restart button.

Details page
This page presents a snapshot of the packet as it flows by each component of the local networking stack. This view shows you the packet flow path and allows you to investigate how the packets change as they get processed by each component they pass by.
- The packet snapshots are grouped by each adapter/switch stack; i.e. packet snapshots captured by an adapter/switch, its filter drivers, and its protocol drivers will be grouped under the name of the adapter/switch. This will make it easier to follow the packet’s flow from one adapter to the other.
- When a snapshot is selected, more details about this specific snapshot are shown, including the raw packet headers.
- All dropped packets have a “True” value in the Dropped tab, a drop reason, and are displayed in red text to make them easier to pinpoint.

Display filters
The display filters allow you to filter your log after capturing the packets. For each filter, you can specify packet parameters like MAC Addresses, IP Addresses, Ports, Ethertype, and Transport Protocol. Unlike capture filters:
- Display filters can distinguish between the source and the destination of IP Addresses, MAC Addresses, and Ports.
- Display filters can be deleted and edited after applying them to change the view of the log.
- Display filters are reversed in the saved logs.

Save feature
The save button allows you to save the log on your local machine, your remote machine, or both. Display filters will be reversed in the saved log.
- If the log is saved on your local machine, you will be able to save it in various formats:
- Etl format which can be analyzed using Microsoft Network Monitor. Note: Check this page for more information.
- Text format which can be analyzed using any text editor like TextAnalysisTool.NET.
- Pcapng format which can be analyzed using tools like Wireshark.
- Most of the Packet Monitor metadata will be lost during this conversion. Check this page for more information.

Open feature
The open feature will allow you to reopen any of the five last saved logs to analyze through the tool.
