Use performance counters to diagnose app performance problems on Remote Desktop Session Hosts
Applies to: Windows Server 2022, Windows Server 2019, Windows 10
Poor application performance is one of the most difficult problems to diagnose, especially for slow or nonresponsive applications. Traditionally, you start your diagnosis by collecting CPU, memory, disk input/output, and other metrics. You then use tools like Windows Performance Analyzer to try to figure out what's causing the problem. Unfortunately, in most situations this data doesn't help you identify the root cause because resource consumption counters have frequent and large variations. This situation makes it difficult to read the data and correlate it with the reported issue.
Note
The User Input Delay counter is only compatible with:
- Windows Server 2019 or later
- Windows 10, version 1809 or later
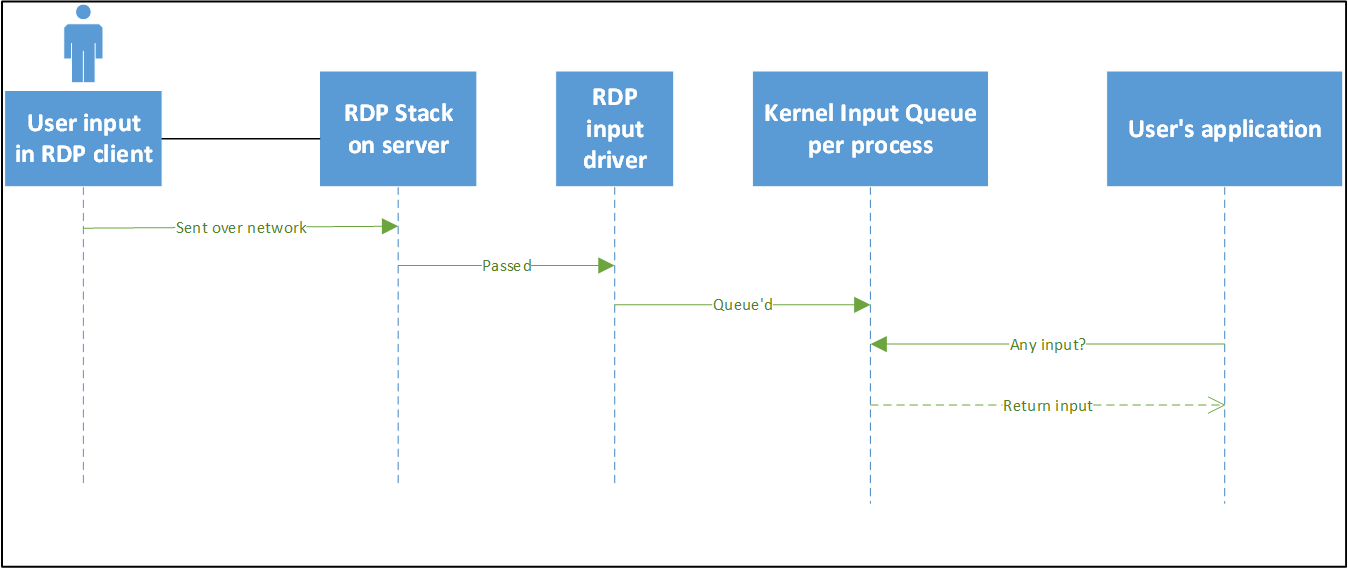
The User Input Delay counter can help you quickly identify the root cause for bad end user Remote Desktop performance experiences. This counter measures how long any user input, such as mouse or keyboard usage, stays in the queue before a process picks it up. The counter works in both local and remote sessions.
The following image shows a rough representation of user input flow from client to application.
The User Input Delay counter measures the max delta within an interval of time between the input being queued and when the app in a traditional message loop picks it up. A traditional message loop is shown in the following flow chart:
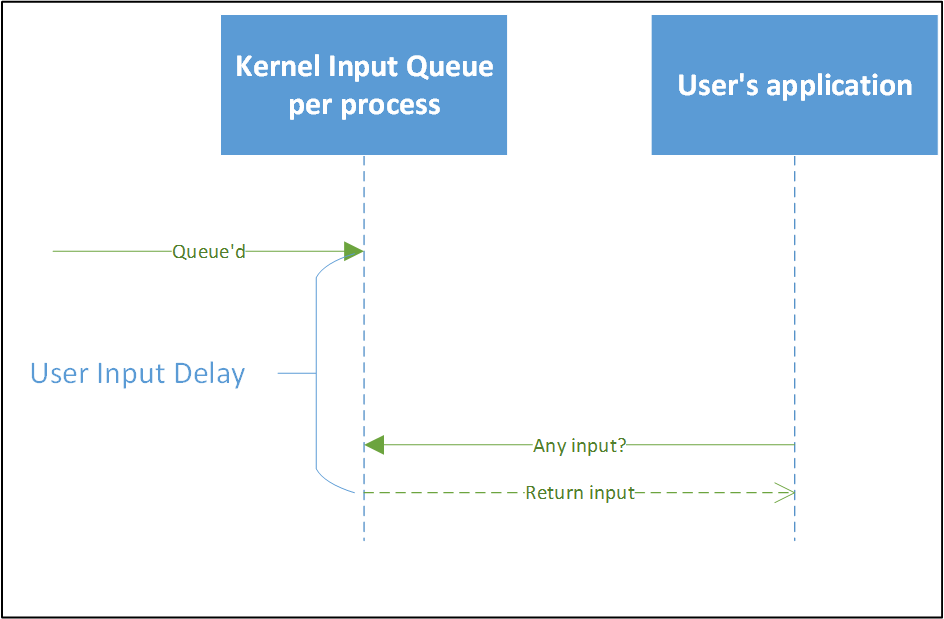
One important detail of this counter is that it reports the maximum user input delay within a configurable interval. This delay is the longest time it takes for an input to reach the application, which can affect the speed of important and visible actions like typing.
For example, in the following table, the user input delay would be reported as 1,000 ms within this interval. The counter reports the slowest user input delay in the interval. The counter reports this delay because the user's perception of "slow" is determined by the slowest input time (the maximum) they experience and not the average speed of all total inputs.
| Number | 0 | 1 | 2 |
|---|---|---|---|
| Delay | 16 ms | 20 ms | 1,000 ms |
Enable and use the new performance counters
To use these new performance counters, you must first enable a registry key by running this command:
reg add "HKLM\System\CurrentControlSet\Control\Terminal Server" /v "EnableLagCounter" /t REG_DWORD /d 0x1 /f
Note
If you use Windows 10, version 1809 or later or Windows Server 2019 or later, you won't need to enable the registry key.
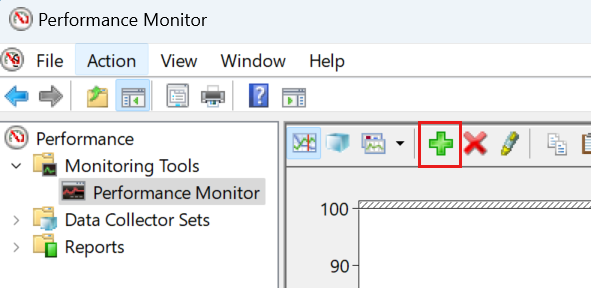
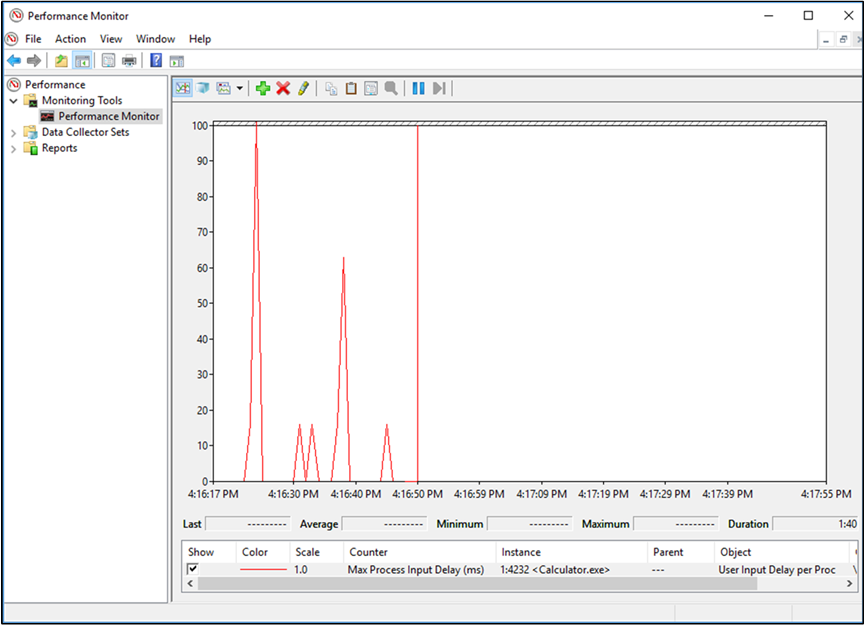
Next, restart the server. Then, open the Performance Monitor, and select the plus icon (+), as shown in the following screenshot:
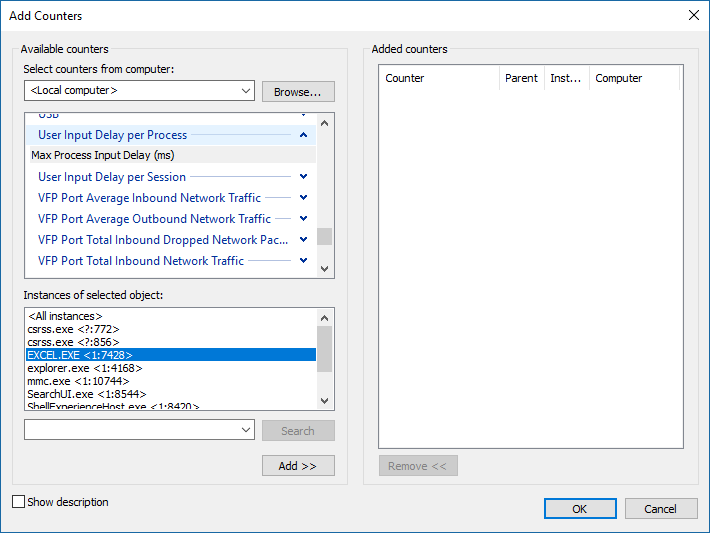
Next, you should see the Add Counters dialog, where you can select User Input Delay per Process or User Input Delay per Session.
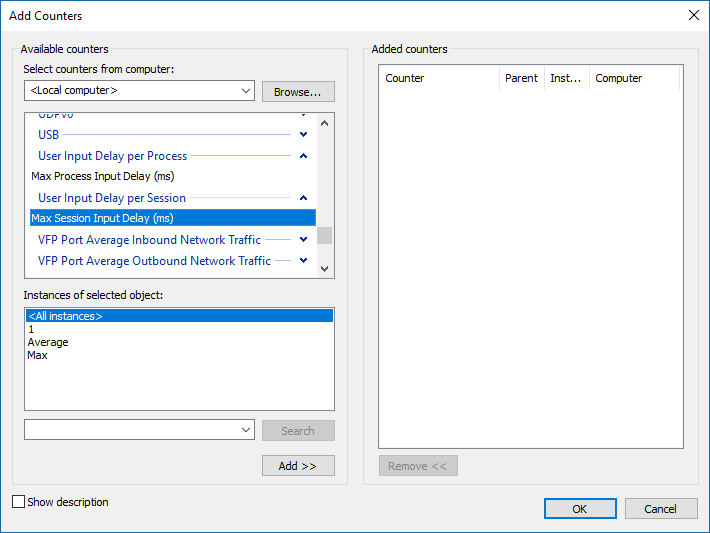
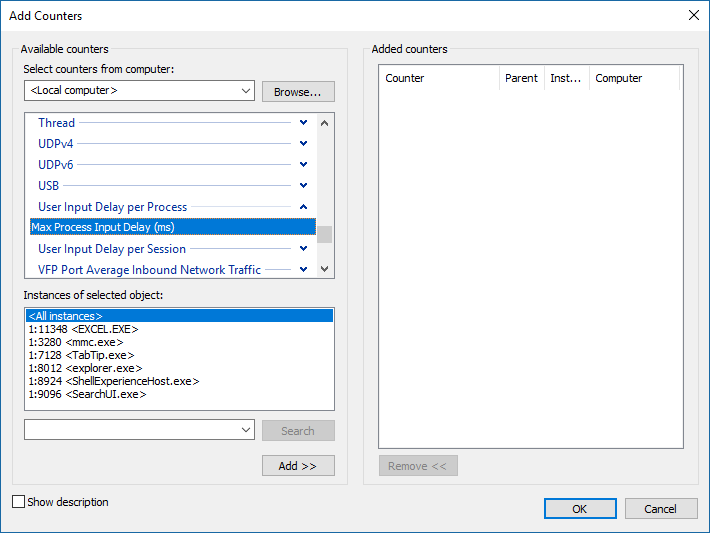
When you select User Input Delay per Process, you see the Instances of the selected object, in other words, the processes in SessionID:ProcessID <Process Image> format.
For example, if the Calculator app is running in a Session ID 1, you see 1:4232 <Calculator.exe>.
Note
Not all processes are included. You won't see any processes that are running as SYSTEM.
The counter starts reporting user input delay as soon as you add it. The maximum scale is set to 100 (ms) by default.
Next, see the User Input Delay per Session. There are instances for each session ID, and their counters show the user input delay of any process within the specified session. In addition, there are two instances called "Max" (the maximum user input delay across all sessions) and "Average" (the average across all sessions).
This table shows a visual example of these instances. You can get the same information in Perfmon by switching to the Report graph type.
| Type of counter | Instance name | Reported delay (ms) |
|---|---|---|
| User Input Delay per process | 1:4232 <Calculator.exe> | 200 |
| User Input Delay per process | 2:1000 <Calculator.exe> | 16 |
| User Input Delay per process | 1:2000 <Calculator.exe> | 32 |
| User Input Delay per session | 1 | 200 |
| User Input Delay per session | 2 | 16 |
| User Input Delay per session | Average | 108 |
| User Input Delay per session | Max | 200 |
Counters used in an overloaded system
Now let's look at what you see in the report if performance for an app is degraded. The following graph shows readings for users working remotely in Microsoft Word. In this case, the performance degrades over time as more users sign in remotely.
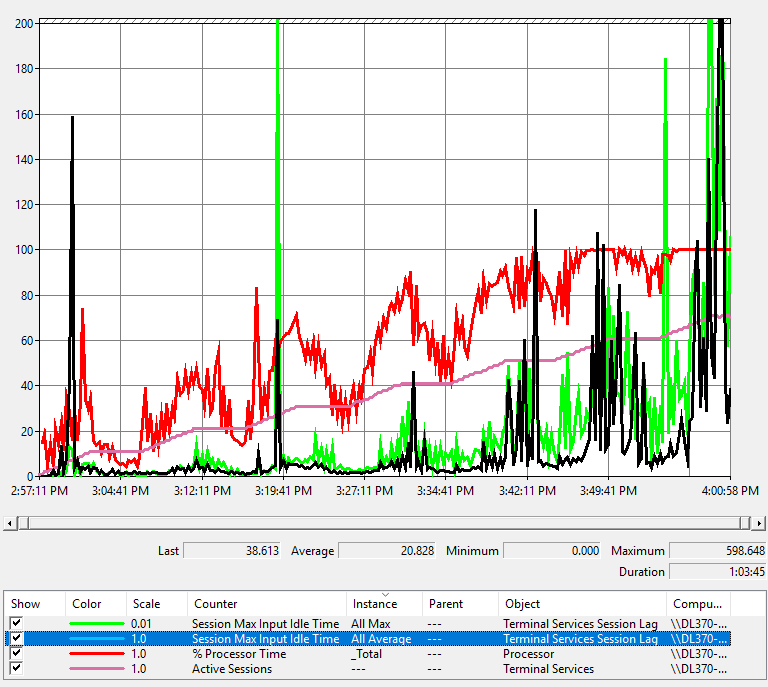
Here's how to read the graph's lines:
- The pink line shows the number of sessions signed in on the server.
- The red line is the CPU usage.
- The green line is the maximum user input delay across all sessions.
- The blue line, displayed as black in this graph, represents average user input delay across all sessions.
There's a correlation between CPU spikes and user input delay. As the CPU gets more usage, the user input delay increases. Also, as more users get added to the system, CPU usage gets closer to 100%, leading to more frequent user input delay spikes. While this counter is useful in cases where the server runs out of resources, it can also track user input delay related to a specific application.
Configuration Options
An important thing to remember when you use this performance counter is that it reports user input delay on an interval of 1,000 ms by default. If you set the performance counter sample interval property, as shown in the following screenshot, to anything different, the reported value will be incorrect.
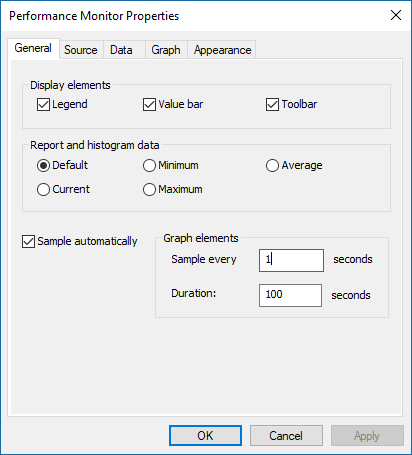
To fix this issue, you can set the following registry key to match the interval (in milliseconds) that you want to use. For example, if you change Sample every 1 second to Sample every 5 seconds, you need to set this key to 5000 ms.
[HKEY_LOCAL_MACHINE\SYSTEM\CurrentControlSet\Control\Terminal Server]

"LagCounterInterval"=dword:00005000
Note
If you use Windows 10, version 1809 or later or Windows Server 2019 or later, you don't need to set LagCounterInterval to fix the performance counter.
We've also added a couple of keys you might find helpful under the same registry key:
LagCounterImageNameFirst—set this key to DWORD 1 (default value 0 or key doesn't exist). This key changes the counter names to "Image Name <SessionID:ProcessId>" for example, "explorer <1:7964>". This change is useful if you want to sort by image name.
LagCounterShowUnknown—set this key to DWORD 1 (default value 0 or key doesn't exist). This key shows any processes that are running as services or SYSTEM. Some processes show up with their session set as "?".
The following image shows what it looks like with both keys on:
Use the new counters with non-Microsoft tools
Monitoring tools can consume this counter by Using Performance Counters.
Share your feedback
You can submit feedback for this feature through the Feedback Hub. Select Apps > All other apps and include "RDS performance counters—performance monitor" in your post's title.
Feedback
Coming soon: Throughout 2024 we will be phasing out GitHub Issues as the feedback mechanism for content and replacing it with a new feedback system. For more information see: https://aka.ms/ContentUserFeedback.
Submit and view feedback for