Note
Access to this page requires authorization. You can try signing in or changing directories.
Access to this page requires authorization. You can try changing directories.
Quality is essential to the success of your app or game on Microsoft Store. To help you monitor and address quality issues more effectively, we have introduced significant updates to the Health report in Partner Center. These enhancements are designed to make it easier to identify and analyze failures impacting your customers.
To learn more about the improvements in the Health report, watch the following video.
For more details, refer to the details below.
Dashboard focused on key metrics

The updated dashboard will bring the most important information to the forefront with key metrics being displayed at the top of the page, making it easier to track quality at a glance. In the sections below the main dashboard, you’ll find additional metrics and trends over time. You will also be able to compare how your quality metrics evolve with each app update, helping you identify performance improvements or regressions.
New quality metrics
To provide better visibility into customer impact, we’re introducing following new metrics:
Devices affected
This metric will show the number of unique devices per day experiencing crashes, hangs, or other failures like memory failures. If multiple failures occur on the same device in a single day, it will be counted as one device—helping you gauge the breadth of the issue across your user base.
Crash rate
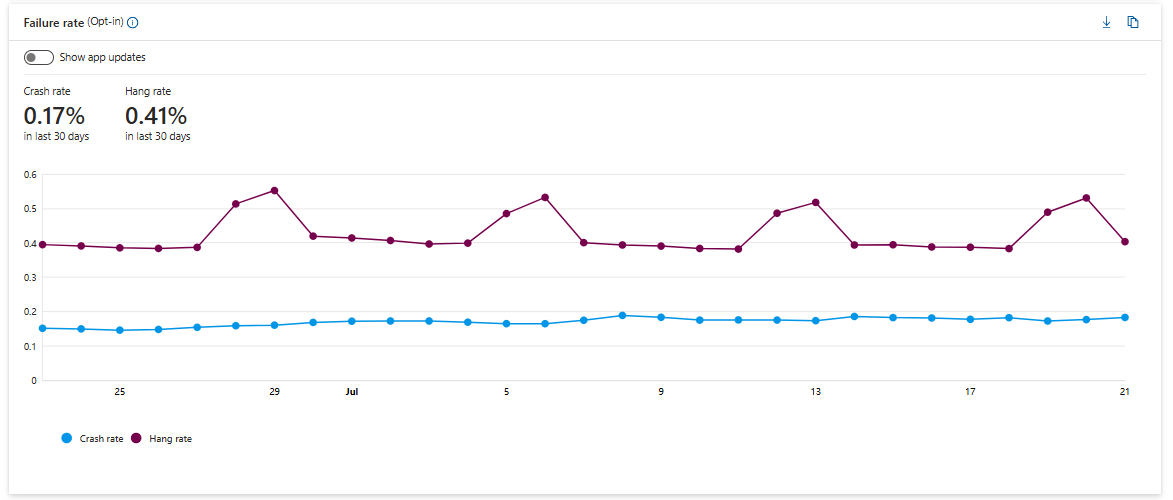
The crash rate metric will represent the percentage of daily unique devices that experienced at least one crash. It is calculated by taking the number of unique devices affected by crash divided by the total number of active devices that day. This metric is calculated based on the data collected from devices who have opted in to share optional diagnostic data.
Hang rate
Similar to crash rate, the hang rate metric will indicate the percentage of daily unique devices that experienced at least one hang (when app or game is unresponsiveness). This is also calculated using data from devices that have opted in to share optional diagnostic data.
Together, crash rate and hang rate metrics will help you understand the severity of failures affecting your customers.
Anomaly alerts for health metrics
To help you stay ahead of app quality issues, Partner Center now includes Anomaly Alerts for Health Metrics. This new feature proactively notifies you when critical health signals in your app, such as crash rate or hang rate, experience unexpected spikes or changes. By catching potential problems early, you can improve app stability, reduce customer impact, and maintain a great user experience.
How it works
Anomaly alerts use advanced statistical models to analyze your app’s recent health data and flag unusual behavior. When an anomaly is detected, you’ll receive an email alert with key details about the issue and a direct link to your Partner Center Health dashboard for quick investigation.

A warning banner will also appear at the top of the Health tab under Insights in Partner Center to ensure visibility.
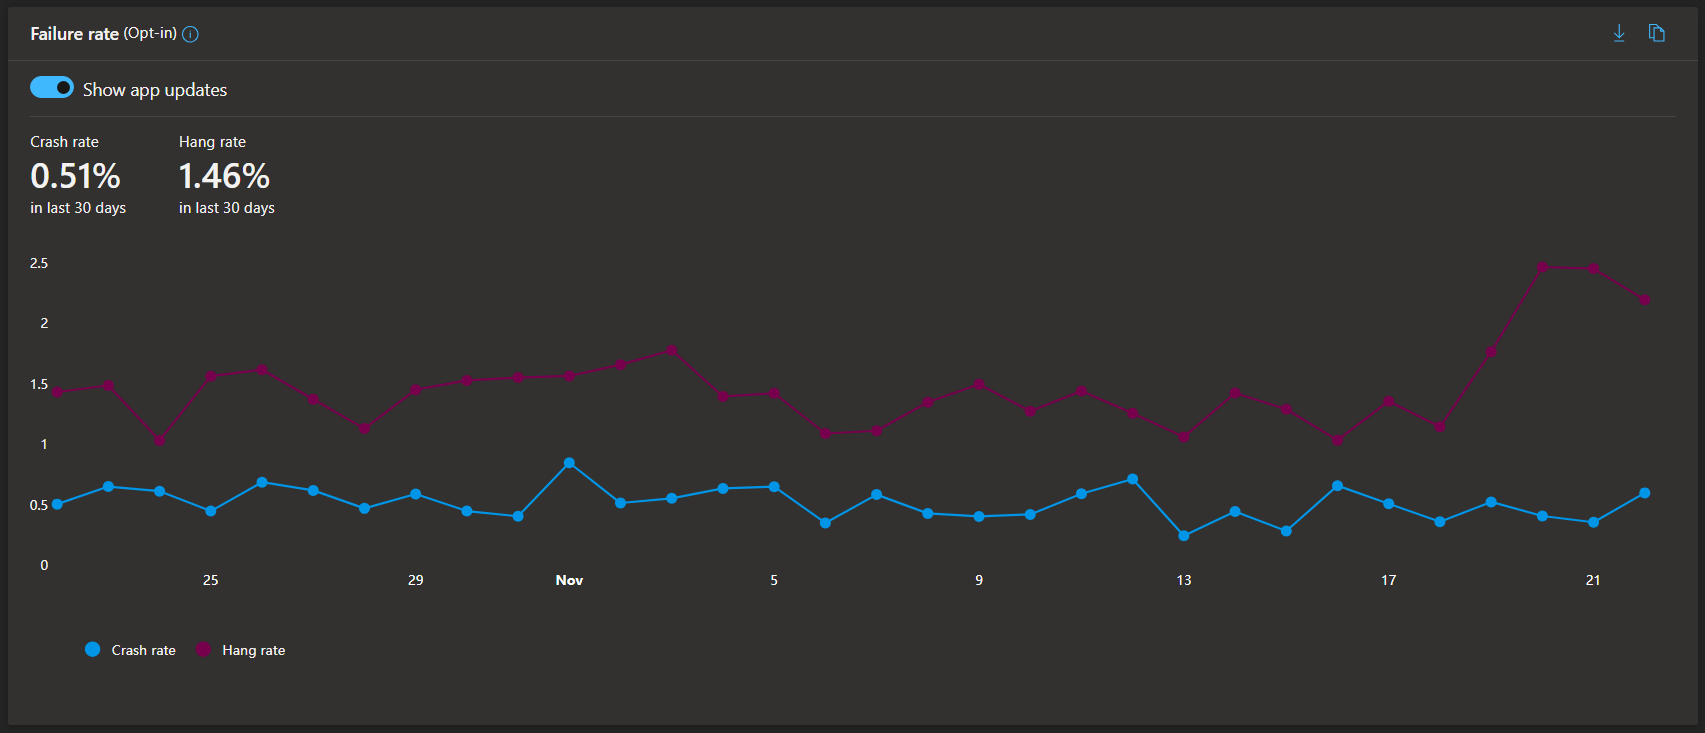
Alerts are initially focused on two essential health metrics: crash rate and hang rate. The feature will expand to cover more metrics in future releases. Alerts are sent regardless of recent app updates, recognizing that issues can arise from factors like OS changes or new device configurations.
Why it matters
Previously, developers had to manually check analytics or rely on user reports to identify quality problems, which could delay resolution. With Anomaly Alerts, you get timely, actionable insights delivered directly to your inbox and prominently displayed as banners in Partner Center, helping you fix issues faster and maintain high customer satisfaction.
Alert frequency and controls
To minimize alert fatigue:
- You will receive no more than one alert per app per day.
- There is a mandatory three-day cooldown period before a new alert can be sent for the same app.
- Alerts are mandatory in the initial rollout phase but will become configurable in upcoming updates, including options to tailor notifications or opt-out.
New tools for deeper analysis
To help you investigate and resolve issues more efficiently, we’ve added several new tools to the Health report:
New visualization for comparison by app version
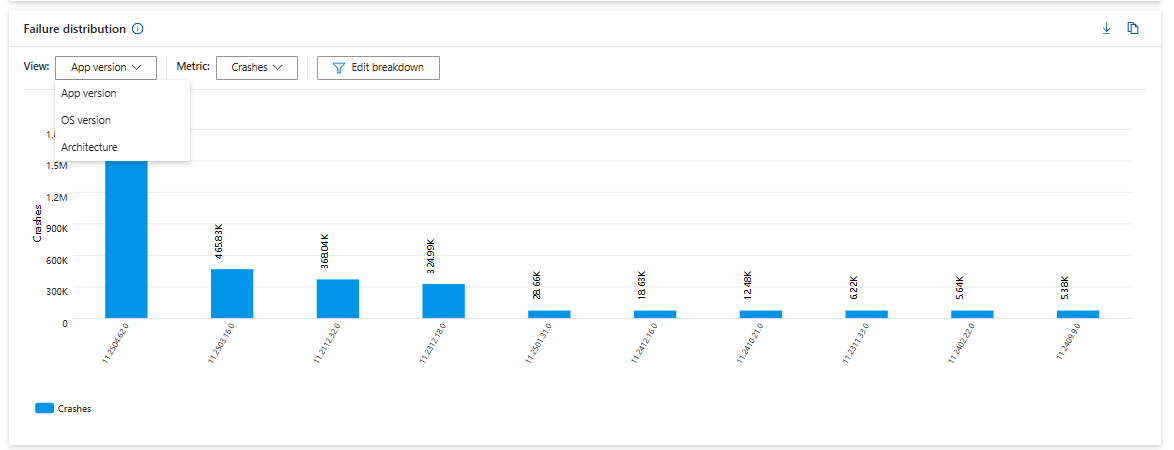
You can now compare failure metrics across different versions of your app to track if there are any performance improvements or regressions between releases. You can also compare your failure metrics across different architectures and operating systems to detect patterns and identify the root causes of issues faster.
Multi-filter support
The simultaneous use of multiple filters is now supported, including multiple app versions, OS versions, device types and more, allowing for more precise and targeted analysis.
Collaborate with us on GitHub
The source for this content can be found on GitHub, where you can also create and review issues and pull requests. For more information, see our contributor guide.

Windows developer