Note
Access to this page requires authorization. You can try signing in or changing directories.
Access to this page requires authorization. You can try changing directories.
Applies to
- Windows 11, version 21H2 and later
- Windows 10, version 1803 and later
The Diagnostic Data Viewer is a Windows app that lets you review the Windows diagnostic data your device is sending to Microsoft, grouping the info into simple categories based on how it's used by Microsoft.
Install the Diagnostic Data Viewer
You must download the app before you can use the Diagnostic Data Viewer to review your device's diagnostic data. You can download the app from the Microsoft Store Diagnostic Data Viewer page.
Note
It's possible that your Windows device doesn't have the Microsoft Store available (for example, Windows Server). If this is the case, see Diagnostic Data Viewer for PowerShell.
Turn on data viewing
Before you can use the app for viewing Windows diagnostic data, you must turn on data viewing in the Settings panel. Turning on data viewing lets Windows store your device's diagnostic data until you turn it off. Turning off data viewing stops Windows from collecting your diagnostic data and clears the existing diagnostic data from your device. This setting doesn't affect your data viewing or history for Microsoft 365 Apps or Microsoft Office.
Important
Turning on data viewing can use up to 1 GB (by default) of disk space on your system drive. We strongly recommend that you turn off data viewing when you're done using the Diagnostic Data Viewer. For info about turning off data viewing, see the Turn off data viewing section later in this article.
To turn on data viewing, do the following steps:
Go to Start, select Settings > Privacy & security > Diagnostics & feedback.
Under View diagnostic data, turn on the Turn on the Diagnostic Data Viewer option.
Turn off data viewing
When you're done reviewing your diagnostic data, you should turn off data viewing. This also removes your Windows data history. This setting doesn't affect your data viewing or history for Microsoft 365 Apps or Microsoft Office.
To turn off data viewing, do the following steps:
Go to Start, select Settings > Privacy & security > Diagnostics & feedback.
Under View diagnostic data, turn off the Turn on the Diagnostic Data Viewer option.
Start the Diagnostic Data Viewer
To start the Diagnostic Data Viewer, do the following steps:
Go to Start, select Settings > Privacy & security > Diagnostics & feedback.
(You can also go to Start and search for Diagnostic Data Viewer.)
Under View diagnostic data, select the Open Diagnostic Data Viewer button.
Close the Diagnostic Data Viewer. Use your device as you normally would for a few days. Then open the Diagnostic Data Viewer again to review the updated list of diagnostic data.
Use the Diagnostic Data Viewer
The Diagnostic Data Viewer provides you with the following features to view and filter your device's diagnostic data.
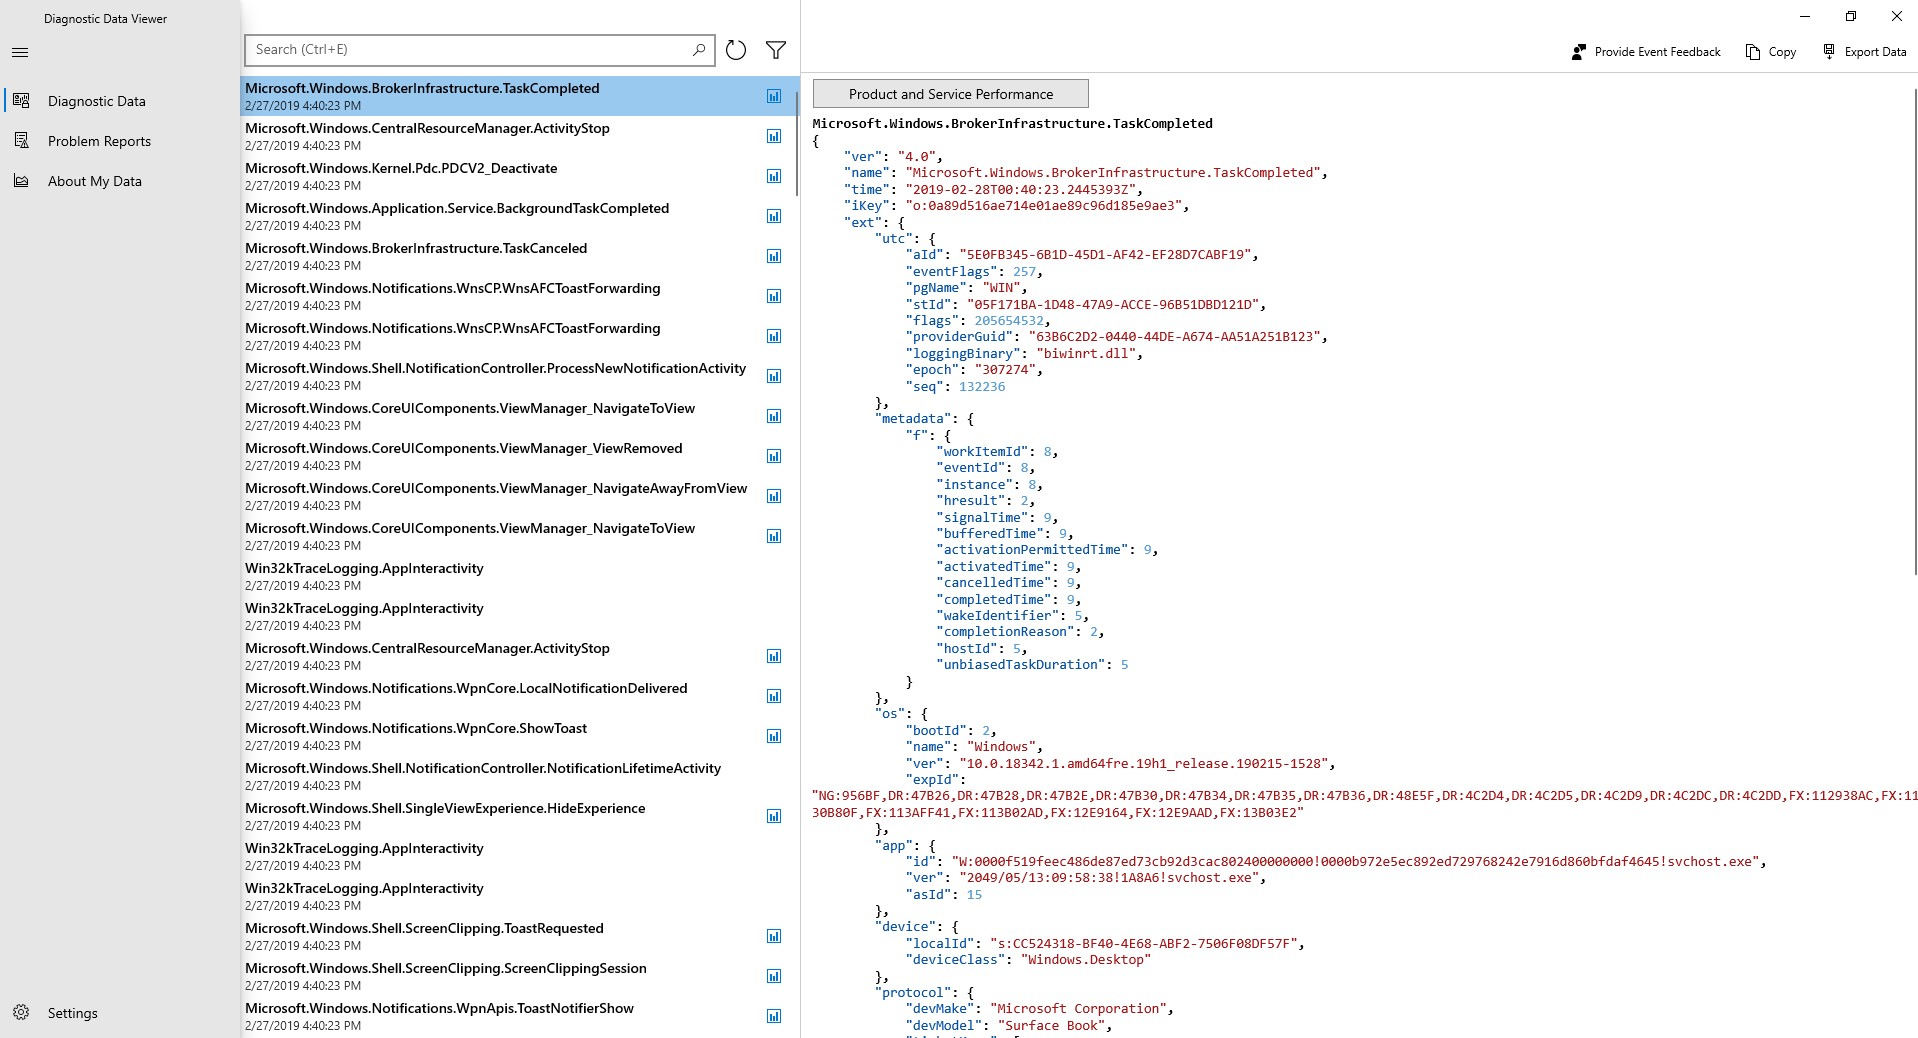
View your Windows diagnostic events
In the left column, you can review your diagnostic events. These events reflect activities that occurred and were sent to Microsoft.
Selecting an event opens the detailed JSON view, which provides the exact details uploaded to Microsoft. Microsoft uses this info to continually improve the Windows operating system.
Note
Seeing an event doesn't necessarily mean it has been uploaded yet. It’s possible that some events are still queued and will be uploaded at a later time.
Export your data
The Diagnostic Data Viewer allows you to export your data to a CSV file.
To export your data, do the following steps:
Go to Start, select Settings > Privacy & security > Diagnostics & feedback.
Under the View diagnostic data heading, select Open Diagnostic Data Viewer.
Select Export data.
Choose the path where the file should be saved, and then select Save.
Search your diagnostic events
The Search box at the top of the screen lets you search among all of the diagnostic event details. The returned search results include any diagnostic event that contains the matching text.
Selecting an event opens the detailed JSON view, with the matching text highlighted.
Filter your diagnostic event categories
The app's Menu button opens the detailed menu. In here, you can find a list of diagnostic event categories, which define how the events are used by Microsoft. Selecting a check box lets you filter between the diagnostic event categories.
Help to make your Windows experience better
Microsoft only needs diagnostic data from a small number of devices to make big improvements to the Windows operating system and ultimately, your experience. If you’re a part of this small device group and you experience issues, Microsoft collects the associated event diagnostic data, allowing your info to potentially help fix the issue for others.
To signify your contribution, you’ll see this icon ( ) if your device is part of the group. In addition, if any of your diagnostic data events are sent from your device to Microsoft to help make improvements, you’ll see this icon (
 ).
).
Provide event feedback
The Feedback icon in the upper right corner of the window opens the Feedback Hub app, letting you provide feedback about the Diagnostic Data Viewer and the diagnostic events.
Selecting a specific event in the Diagnostic Data Viewer automatically fills in the field in the Feedback Hub. You can add your comments to the box labeled, Give us more detail (optional).
Important
All content in the Feedback Hub is publicly viewable. Therefore, make sure you don't put any personal info into your feedback comments.
View a summary of the data you've shared with us over time
The About your data in the Diagnostic Data Viewer lets you see an overview of the Windows data you've shared with Microsoft.
Through this feature, you can see how much data you send on average each day, the breakdown of your data by category, the top components and services that have sent data, and more.
Note
This content is a reflection of the history of Windows data that the app has stored. If you'd like to have extended analyses, modify the storage capacity of the Diagnostic Data Viewer.

View Microsoft 365 Apps or Microsoft Office diagnostic data
By default, the Diagnostic Data Viewer shows you Windows data. You can also view Microsoft 365 Apps or Microsoft Office diagnostic data by enabling the feature in the app settings page. To learn more about how to view Microsoft 365 Apps or Microsoft Office diagnostic data, see Using the Diagnostic Data Viewer with Office.
Modifying the size of your data history
By default, the Diagnostic Data Viewer shows you up to 1 GB or 30 days of data (whichever comes first) for Windows diagnostic data. While the exact volume varies by user, the average device generates approximately 6 MB of Windows diagnostic data per day. Once either the time or space limit is reached, the data is incrementally dropped with the oldest data points dropped first.
Important
If you have diagnostic data viewing enabled for Microsoft 365 Apps or Microsoft Office, their data history is fixed at 1 GB and cannot be modified.
Modify the size of your data history
To make changes to the size of your Windows diagnostic data history, visit the app settings, located at the bottom of the navigation menu. Data is incrementally dropped with the oldest data points first once your chosen size or time limit is reached.
Important
Decreasing the maximum amount of diagnostic data viewable through the tool will remove all data history and requires a reboot of your device. Additionally, increasing the maximum amount of diagnostic data viewable by the tool may come with performance impacts to your machine.
View additional diagnostic data in the "View problem reports" tool
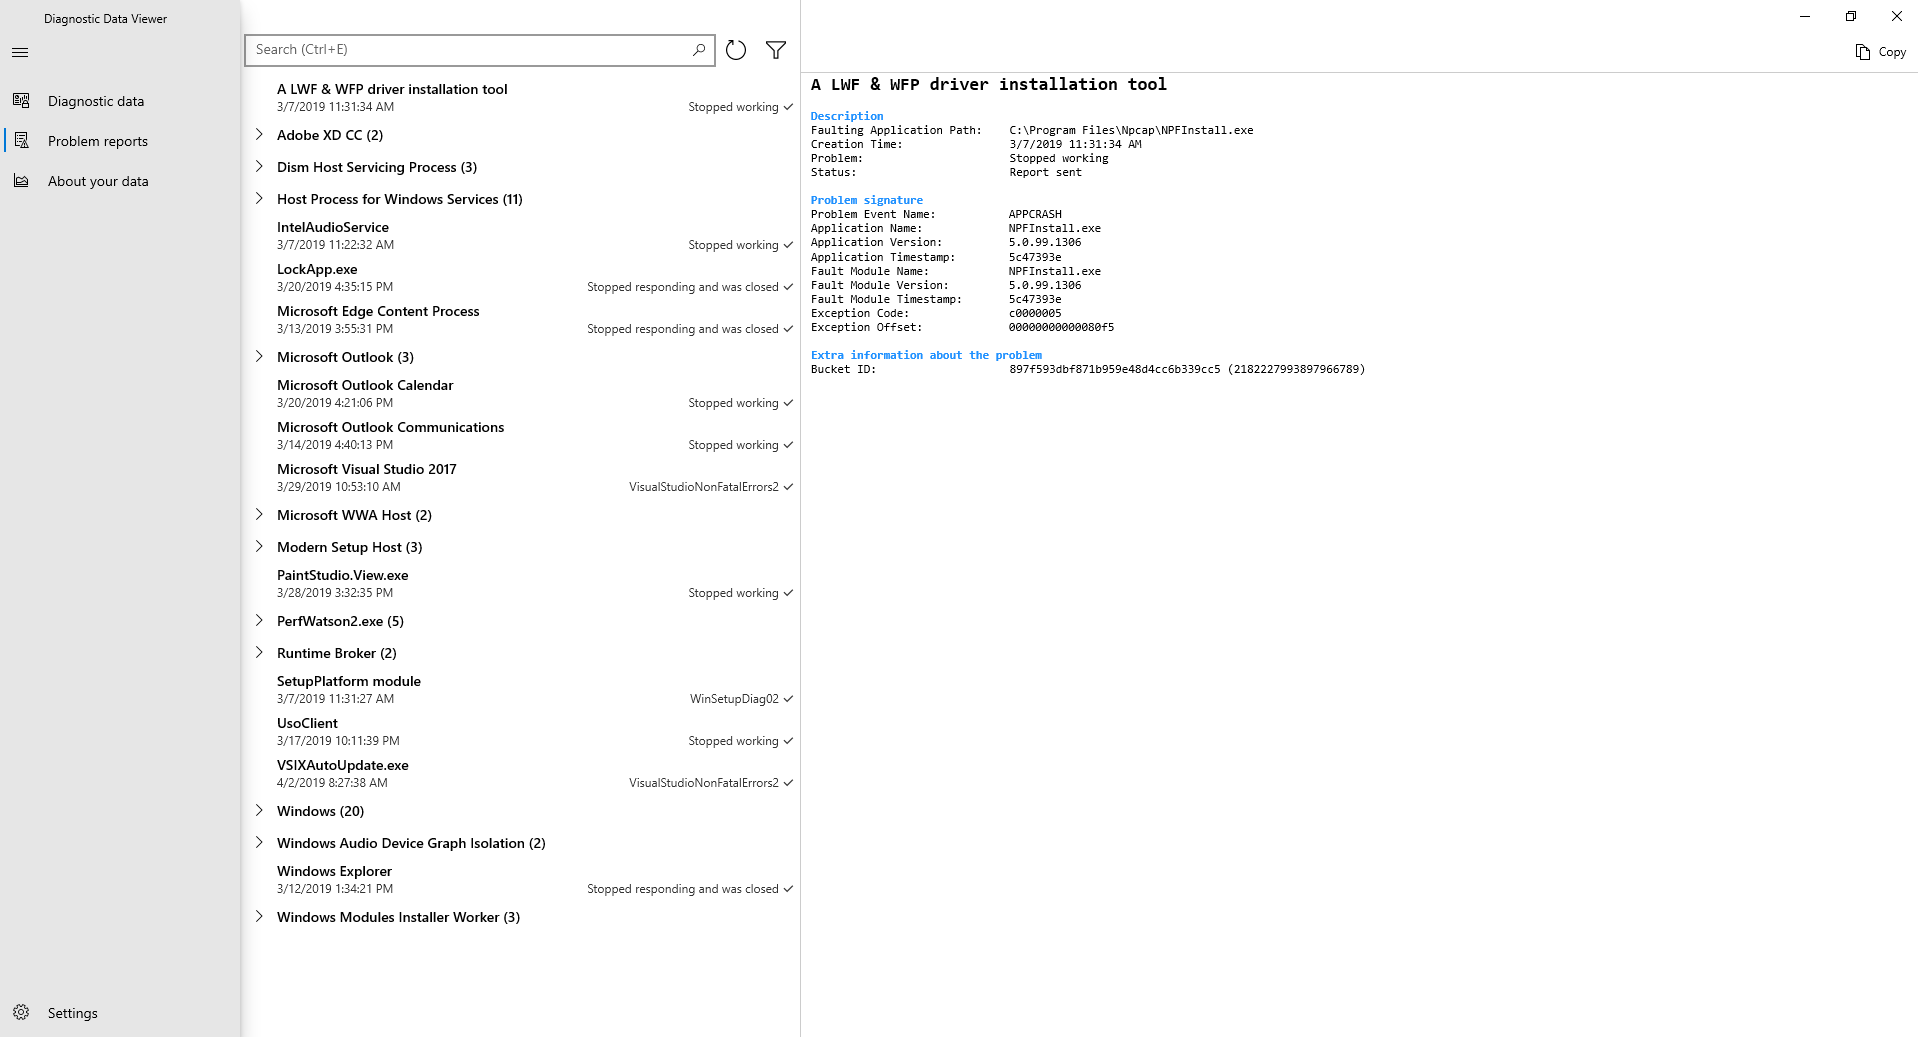
Available on Windows 10 (version 1809 and higher) and on Windows 11, you can review additional Windows Error Reporting diagnostic data in the View problem reports page within the Diagnostic Data Viewer.
This page provides you with a summary of various crash reports that are sent to Microsoft as part of Windows Error Reporting. We use this data to find and fix specific issues that are hard to replicate and to improve the Windows operating system.
You can also use the Windows Error Reporting tool available in the Control Panel.
To view your Windows Error Reporting diagnostic data using the Diagnostic Data Viewer
On Windows 10 (version 1809 and higher) and on Windows 11, you can review Windows Error Reporting diagnostic data in the Diagnostic Data Viewer.
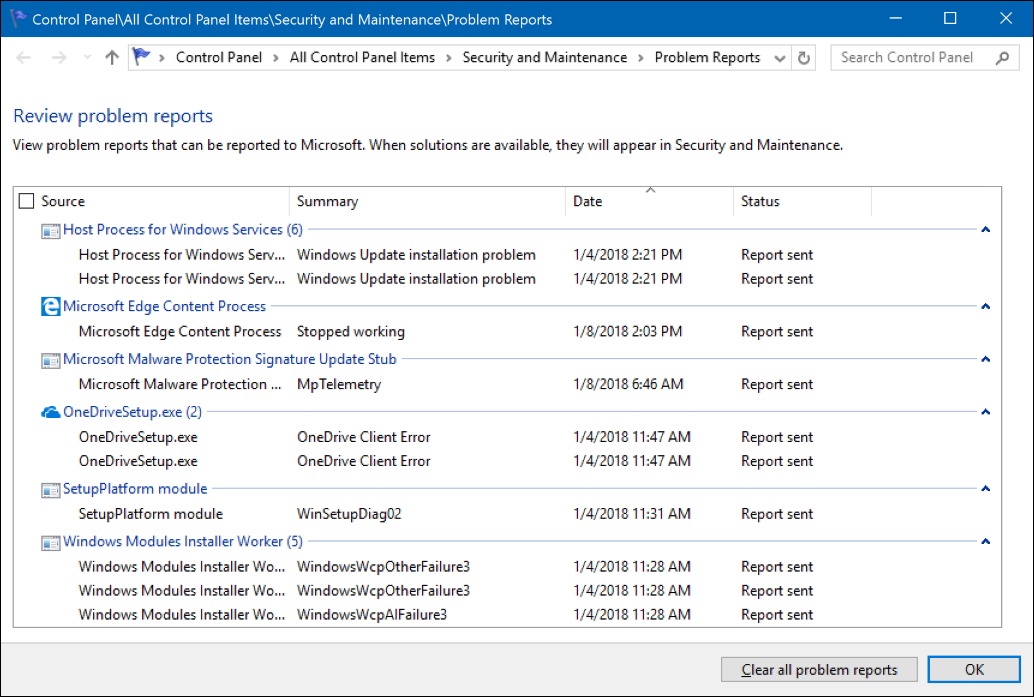
To view your Windows Error Reporting diagnostic data using the Control Panel
To use the Windows Error Reporting tool in the Control Panel, you can do either of the following steps:
- Go to Start, select Control Panel > All Control Panel Items > Security and Maintenance > Problem Reports.
- Go to Start and search for Problem Reports.
The Review problem reports tool opens, showing you your Windows Error Reporting reports, along with a status about whether it was sent to Microsoft.
Diagnostic Data Viewer for PowerShell
The Diagnostic Data Viewer for PowerShell is a PowerShell module that lets you review the diagnostic data your device is sending to Microsoft, grouping the info into simple categories based on how it's used by Microsoft. It is supported on the following versions of Windows and Windows Server:
- Windows 11, version 21H2 and later
- Windows 10, version 1803 and later
- Windows Server, version 1803
- Windows Server 2019
Note
You must have administrative privilege on the device in order to use this PowerShell module.
Install the Diagnostic Data Viewer for PowerShell
You must install the module before you can use the Diagnostic Data Viewer for PowerShell.
Open an elevated PowerShell session
Using the Diagnostic Data Viewer for PowerShell requires administrative (elevated) privilege. There are two ways to open an elevated PowerShell prompt. You can use either method.
- Go to Start > Windows PowerShell > Run as administrator
- Go to Start > Command prompt > Run as administrator, and run the command
C:\> powershell.exe
Install the Diagnostic Data Viewer for PowerShell
Tip
For more information on installing a PowerShell module, see Getting Started with the PowerShell Gallery.
To install the newest version of the Diagnostic Data Viewer PowerShell module, run the following command within an elevated PowerShell session:
PS C:\> Install-Module -Name Microsoft.DiagnosticDataViewer
For more information about the module, go to the Microsoft.DiagnosticDataViewer page in the PowerShell Gallery.
To turn on data viewing through PowerShell
Run the following command within an elevated PowerShell session:
PS C:\> Enable-DiagnosticDataViewing
Get started with using the Diagnostic Data Viewer for PowerShell
To see how to use the cmdlet, the parameters it accepts, and examples, run the following command from an elevated PowerShell session:
PS C:\> Get-Help Get-DiagnosticData
To start viewing Diagnostic Data, from an elevated PowerShell session, run the following command:
PS C:\> Get-DiagnosticData
If the number of events is large, and you'd like to stop the command, enter Ctrl+C.
Note
The preceding command might produce little to no results if you enabled data viewing recently. It can take several minutes before your Windows device can show diagnostic data it sent.
Working with the Diagnostic Data Viewer for PowerShell
The Diagnostic Data Viewer for PowerShell provides you with the following features to view and filter your device's diagnostic data. You can also use the extensive suite of other PowerShell tools with this module.
Tip
For more information about the PowerShell commands available, see the Microsoft.DiagnosticDataViewer module documentation.
View your diagnostic events
Running PS C:\> Get-DiagnosticData, you can review your diagnostic events. These events reflect activities that occurred and were sent to Microsoft.
Each event is displayed as a PowerShell Object. By default each event shows the event name, the time when it was seen by your Windows device, whether the event is Required, its diagnostic event category, and a detailed JSON view of the information it contains, which shows the event exactly as it was when sent to Microsoft. Microsoft uses this info to continually improve the Windows operating system.
View diagnostic event categories
Each event shows the diagnostic event categories that it belongs to. These categories define how events are used by Microsoft. The categories are shown as numeric identifiers.
To view the diagnostic category represented by each numeric identifier and what the category means, you can run the following command:
PS C:\> Get-DiagnosticDataTypes
Filter events by when they were sent
You can view events within specified time ranges by specifying a start time and end time of each command. For example, to see all diagnostic data sent between 12 and 6 hours ago, run the following command. Data is shown in order of oldest first.
PS C:\> Get-DiagnosticData -StartTime (Get-Date).AddHours(-12) -EndTime (Get-Date).AddHours(-6)
Export the results of each command
You can export the results of each command to a separate file such as a csv by using pipe |. For example:
PS C:\> Get-DiagnosticData | Export-Csv 'mydata.csv'
To turn off data viewing through PowerShell
Within an elevated PowerShell session, run the following command:
PS C:\> Disable-DiagnosticDataViewing
Modifying the size of your data history
By default, the tool shows you up to 1 GB or 30 days of data (whichever comes first). While the exact volume varies by user, the average device generates approximately 6 MB of Windows diagnostic data per day. Once either the time or space limit is reached, the data is incrementally dropped with the oldest data points dropped first.
Modify the size of your data history
Important
- Modifying the maximum amount of diagnostic data viewable by the tool might come with performance impacts to your machine.
- If you modify the maximum data history size from a larger value to a lower value, you must turn off data viewing and turn it back on in order to reclaim disk space.
You can change the maximum data history size (in megabytes) that you can view. For example, to set the maximum data history size to 2,048 MB (2 GB), you can run the following command.
PS C:\> Set-DiagnosticStoreCapacity -Size 2048
You can change the maximum data history time (in hours) that you can view. For example, to set the maximum data history time to 24 hours, you can run the following command.
PS C:\> Set-DiagnosticStoreCapacity -Time 24
Note
- You might need to restart your device for the new settings to take effect.
Reset the size of your data history
To reset the maximum data history size back to its original 1 GB default value, run the following command in an elevated PowerShell session:
PS C:\> Set-DiagnosticStoreCapacity -Size 1024 -Time 720
When resetting the size of your data history to a lower value, be sure to turn off data viewing and turn it back on in order to reclaim disk space.
Important
To inquire about Windows data access or interoperability related to the Digital Markets Act (DMA), submit this form. Besides filling out the form, customers may also raise any feedback with an appropriate competent authority.