Note
Access to this page requires authorization. You can try signing in or changing directories.
Access to this page requires authorization. You can try changing directories.
Important
Use the UWP Sensor API instead.
The COM-based Sensor API is deprecated and should not be used in new applications. No additional features or enhancements are planned, and support will be limited.
The primary sensor data type for ambient light sensors is illuminance in lux (lumens per square meter). The principles outlined in this topic are based on taking lux values as input and reacting to that data in a program.
Lux readings are directly proportional to the energy per square meter that is absorbed per second. Human perception of light levels is not so straightforward. Human perception of light is complicated because our eyes are constantly adjusting and other biological processes are affecting our perception. However, we can think of this perception from a simplified perspective by creating several ranges of interest with known upper and lower thresholds.
The following example data set represents rough thresholds for common lighting conditions, and the corresponding lighting step. Here, each lighting step represents a change in lighting environment.
Note
This data set is for illustration and may not be completely accurate for all users or situations.
| Lighting condition | From (lux) | To (lux) | Mean value (lux) | Lighting step |
|---|---|---|---|---|
| Pitch Black | 0 | 10 | 5 | 1 |
| Very Dark | 11 | 50 | 30 | 2 |
| Dark Indoors | 51 | 200 | 125 | 3 |
| Dim Indoors | 201 | 400 | 300 | 4 |
| Normal Indoors | 401 | 1000 | 700 | 5 |
| Bright Indoors | 1001 | 5000 | 3000 | 6 |
| Dim Outdoors | 5001 | 10,000 | 7500 | 7 |
| Cloudy Outdoors | 10,001 | 30,000 | 20,000 | 8 |
| Direct Sunlight | 30,001 | 100,000 | 65,000 | 9 |
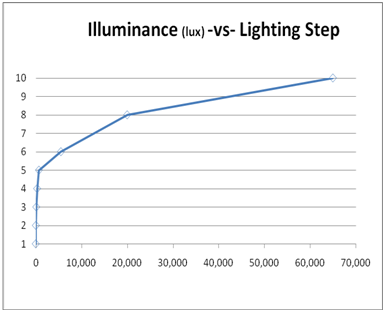
If we visualize this data by using the mean values from this table, we see that the lux-to-lighting-step relationship is not linear, as show in the following graph.
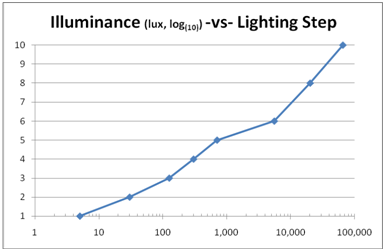
However, if we view this data by using a logarithmic scale on the x-axis, we can see that a roughly linear relationship emerges.
An Example Transform
Based on the sample data set for ambient light sensors previously provided, you could arrive at the following equation to map lux values to human perception. In this example, the expected values range from 0 lux to 1,000,000 lux.
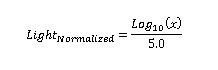
This equation results in values that vary in a roughly linear fashion between 0.0 and 1.0. This result indicates how human-perceived lighting changed based on the example data set that was shown previously.