Improve performance with Visual Success
Visual Success is a tool available on the Insertion Order Details and Line Item Details pages, designed to help campaign managers achieve better overall performance. It provides easy access to change history, performance, delivery, and other metrics for line items and campaigns. You can use these metrics to see how the campaigns under your line item or insertion order are performing as a group, and assess for possible trouble spots at the campaign, line item, and insertion order levels.
Tip
Visual Success Benefits
- View change history, flight progress, delivery, performance, and margin
- Scan for problems using easy-to-read data visualizations
- Keep track of how well line items are pacing to goals
- Hover over the visuals to see specific data for a single day
Viewing visual success data
Visual Success data appears on the Insertion Order and Line Item Details screens.
For insertion orders
To access the Insertion Order Details screen, go to Advertiser > Insertion Orders. Hover over the insertion order row for which you want to view advanced details. Click the linked insertion order name to go to the Insertion Order Details screen.
Visual Success features appear at the top of the screen.
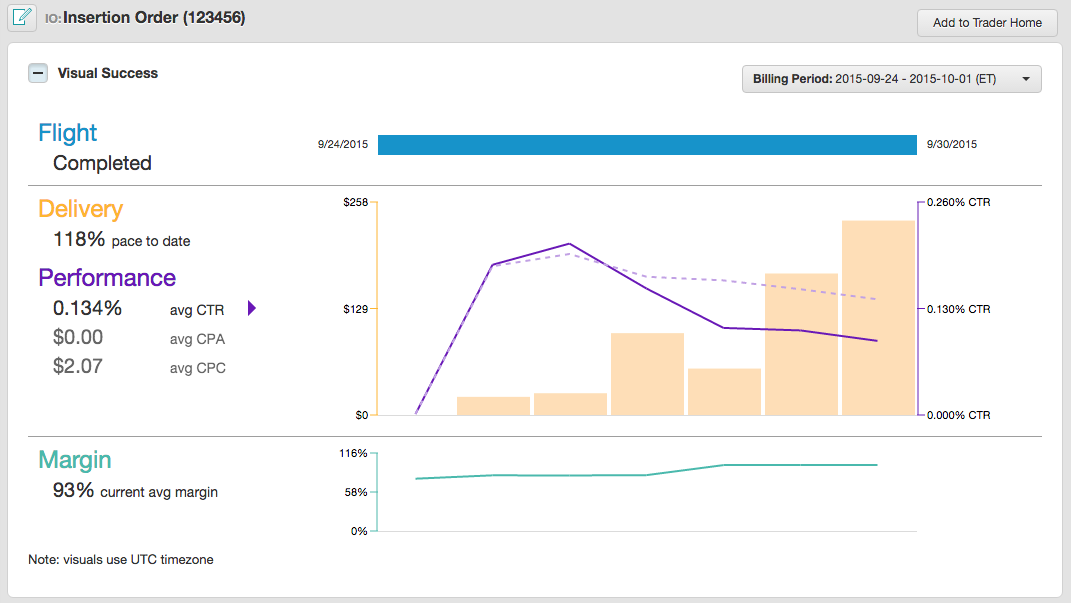
Select a quickstats interval to view the corresponding Visual Success data.
For line items
To access the Line Item Details screen, go to Advertiser > Line Items. Hover over the line item or insertion order row for which you want to view advanced details. A graph button and an edit button will appear in the row. Click the graph button to go to the Line Item Details screen.
Visual Success features appear at the top of the screen.
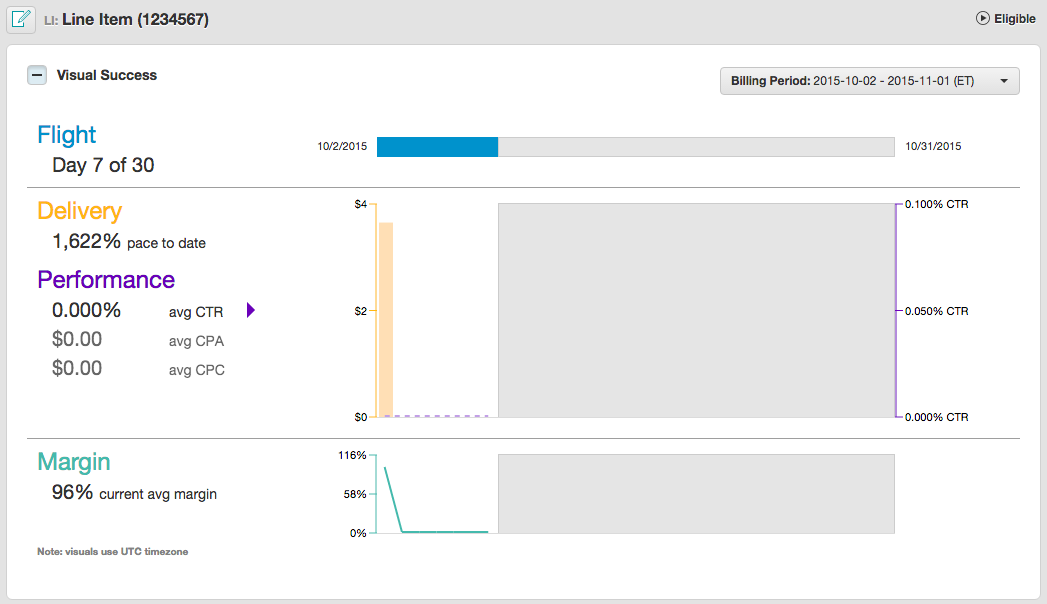
Select a quickstats interval to view the corresponding Visual Success data.
Change History
Within the line item Visual Success screen, you can also see the history of changes that were made to the line item. Each blue square indicates when a change was made. Click on any of the blue squares to view the Change History panel which contains a list of changes made on that day.
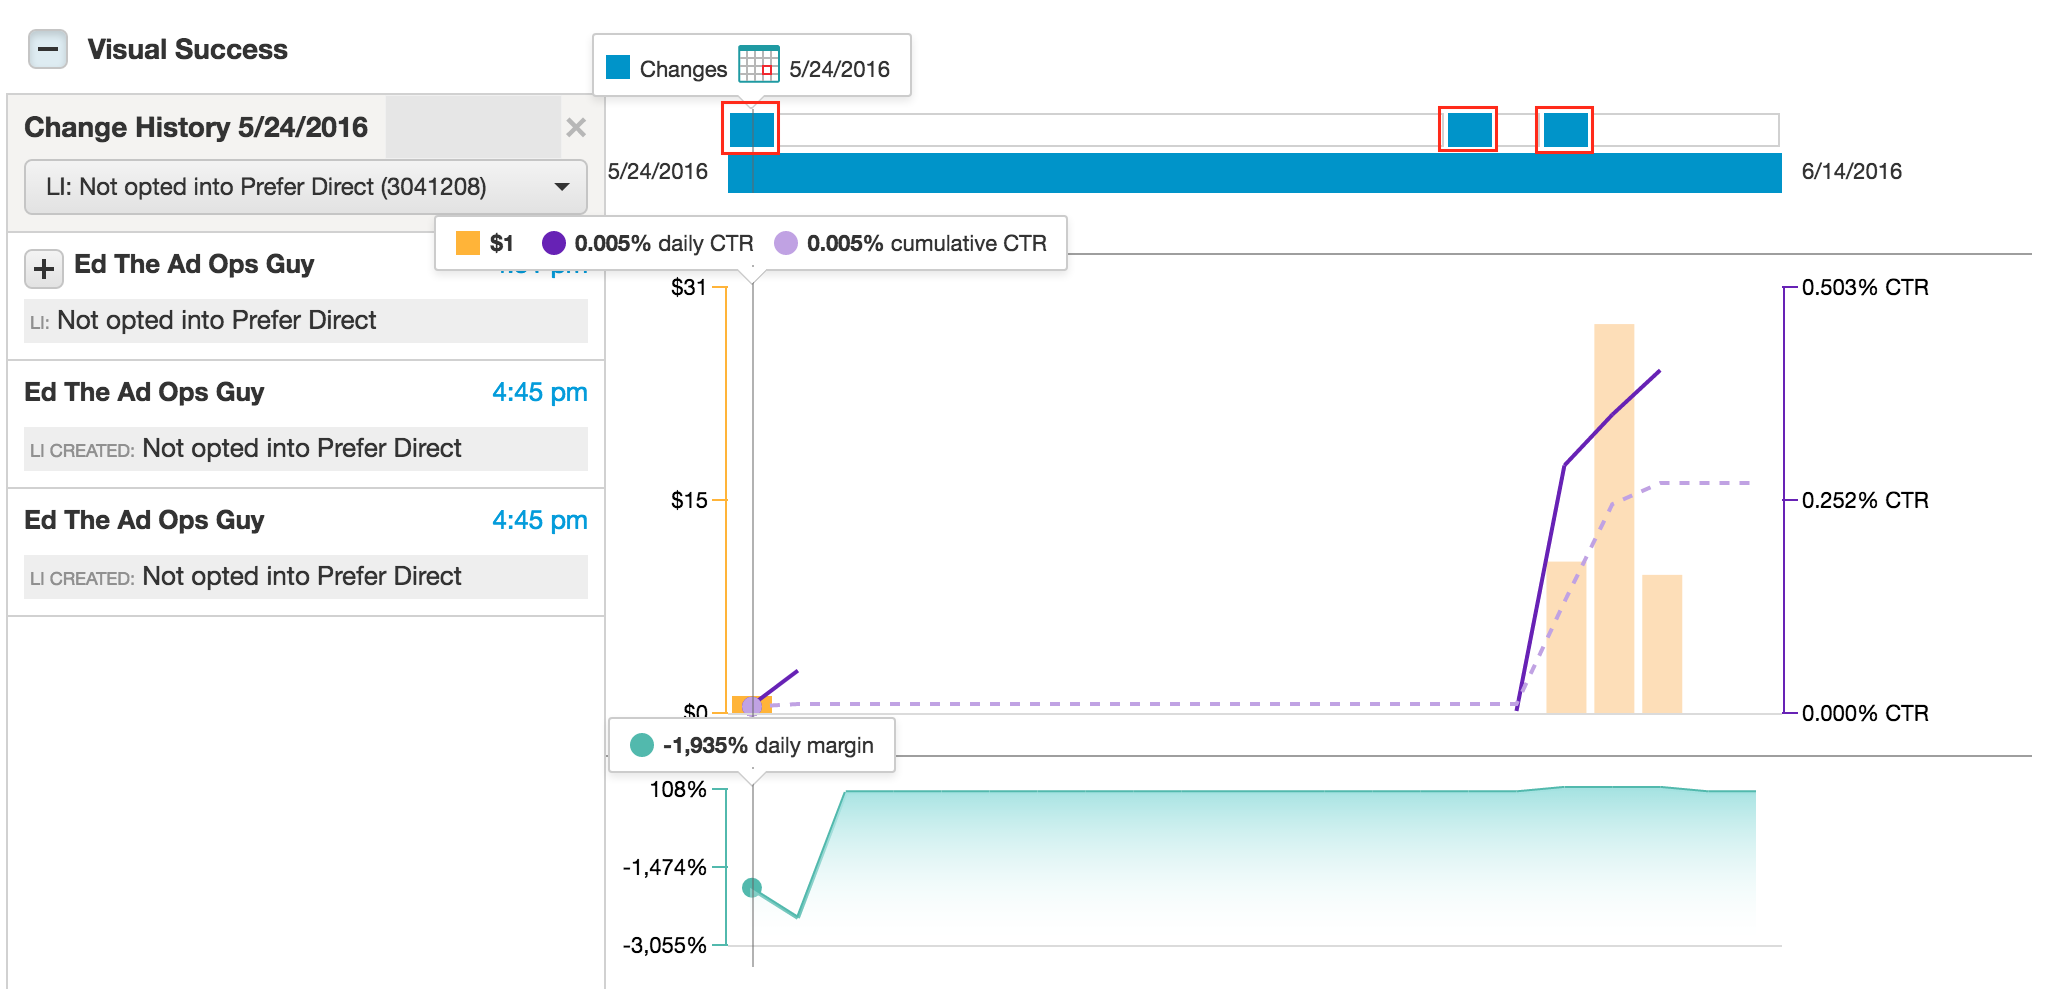
You can also expand each of the plus signs in the Change History panel to show details of what was changed.
Understanding Visual Success data
Visual Success data consists of four main categories:
- Flight
- Delivery
- Performance
- Margin
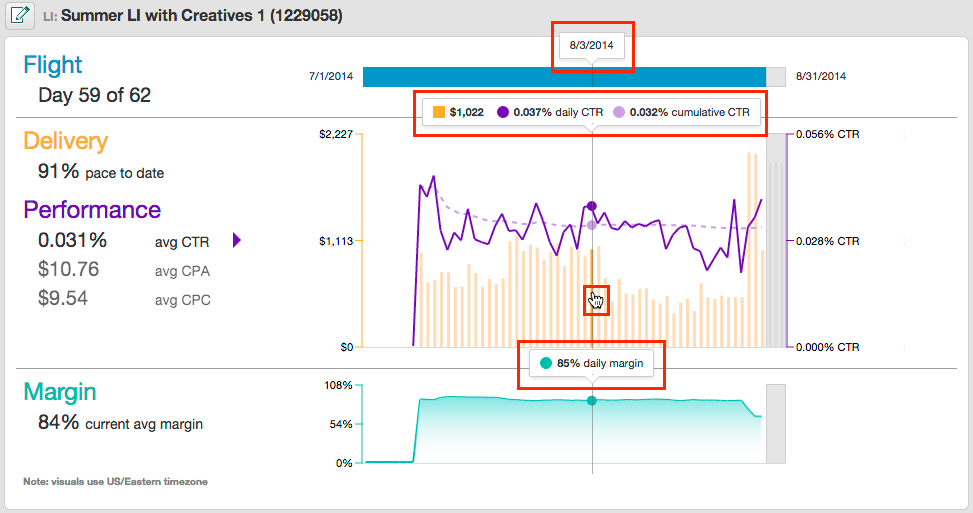
Flight
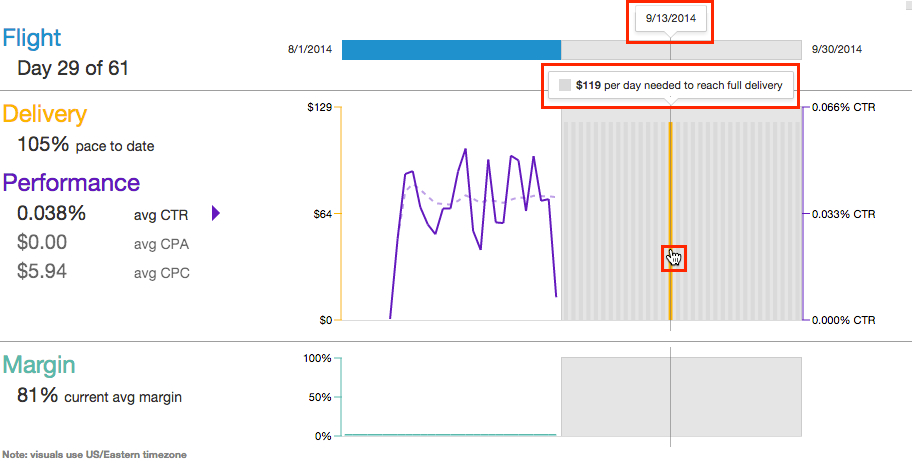
The Flight section has two horizontal bars. The first blue bar details the changes in your line item, or campaigns, on a given date. The second bar tells you how many days into your insertion order's or line item's flight you are. It shows the flight start and end dates and how much of your flight is completed.
If there are no flight dates, Visual Success will show the range of dates for which there was delivery on that insertion order or line item.
Delivery
The Delivery section shows whether your insertion order or line item is delivering on pace. It tells you how close you are to delivering on pace as a percentage of your delivery goal.
Performance
The Performance section shows how well your insertion order or line item has performed to date. The solid performance line shows daily performance while the dashed line shows cumulative performance.
You can select among average CTR, average CPC, or average CPA by clicking the metric of your choice.
Margin
The Margin section shows your average margin and daily margin to date. The percentage is the running average, and the graph shows the daily margin.
Troubleshoot with Visual Success
Using Visual Success, you can identify trouble spots with a quick visual scan.
Signs of under-delivery
If your delivery is below 100%, you may want to make changes to pacing settings to spend faster.
Similarly, if you are spending far above or below the needed daily budget for the remaining days, you may want to adjust your daily budget for the line item to keep spending on track.
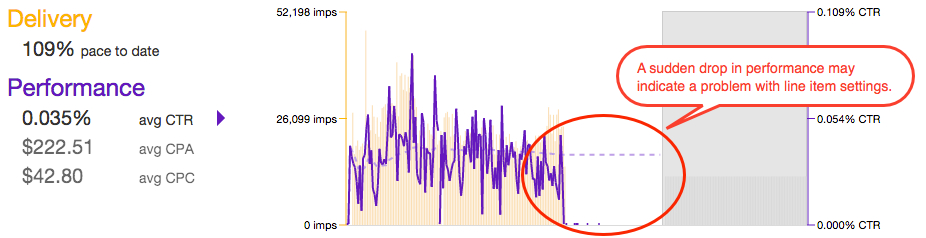
Big peaks or valleys in performance metrics
Sudden, sharp changes in average CTR, CPC, or CPA may indicate a problem. Check targeting, frequency capping, and other settings that limit the circumstances in which the line item can spend.
Tip
View Visual Success details
You can view specific details down to the day by hovering over one of the graphics to show exact flight, delivery, performance, and margin for that date.
View Daily Delivery recommendations
You can check how many imps or how much spend is needed per day remaining in the flight to ensure full delivery.