Monetize insights for total revenue
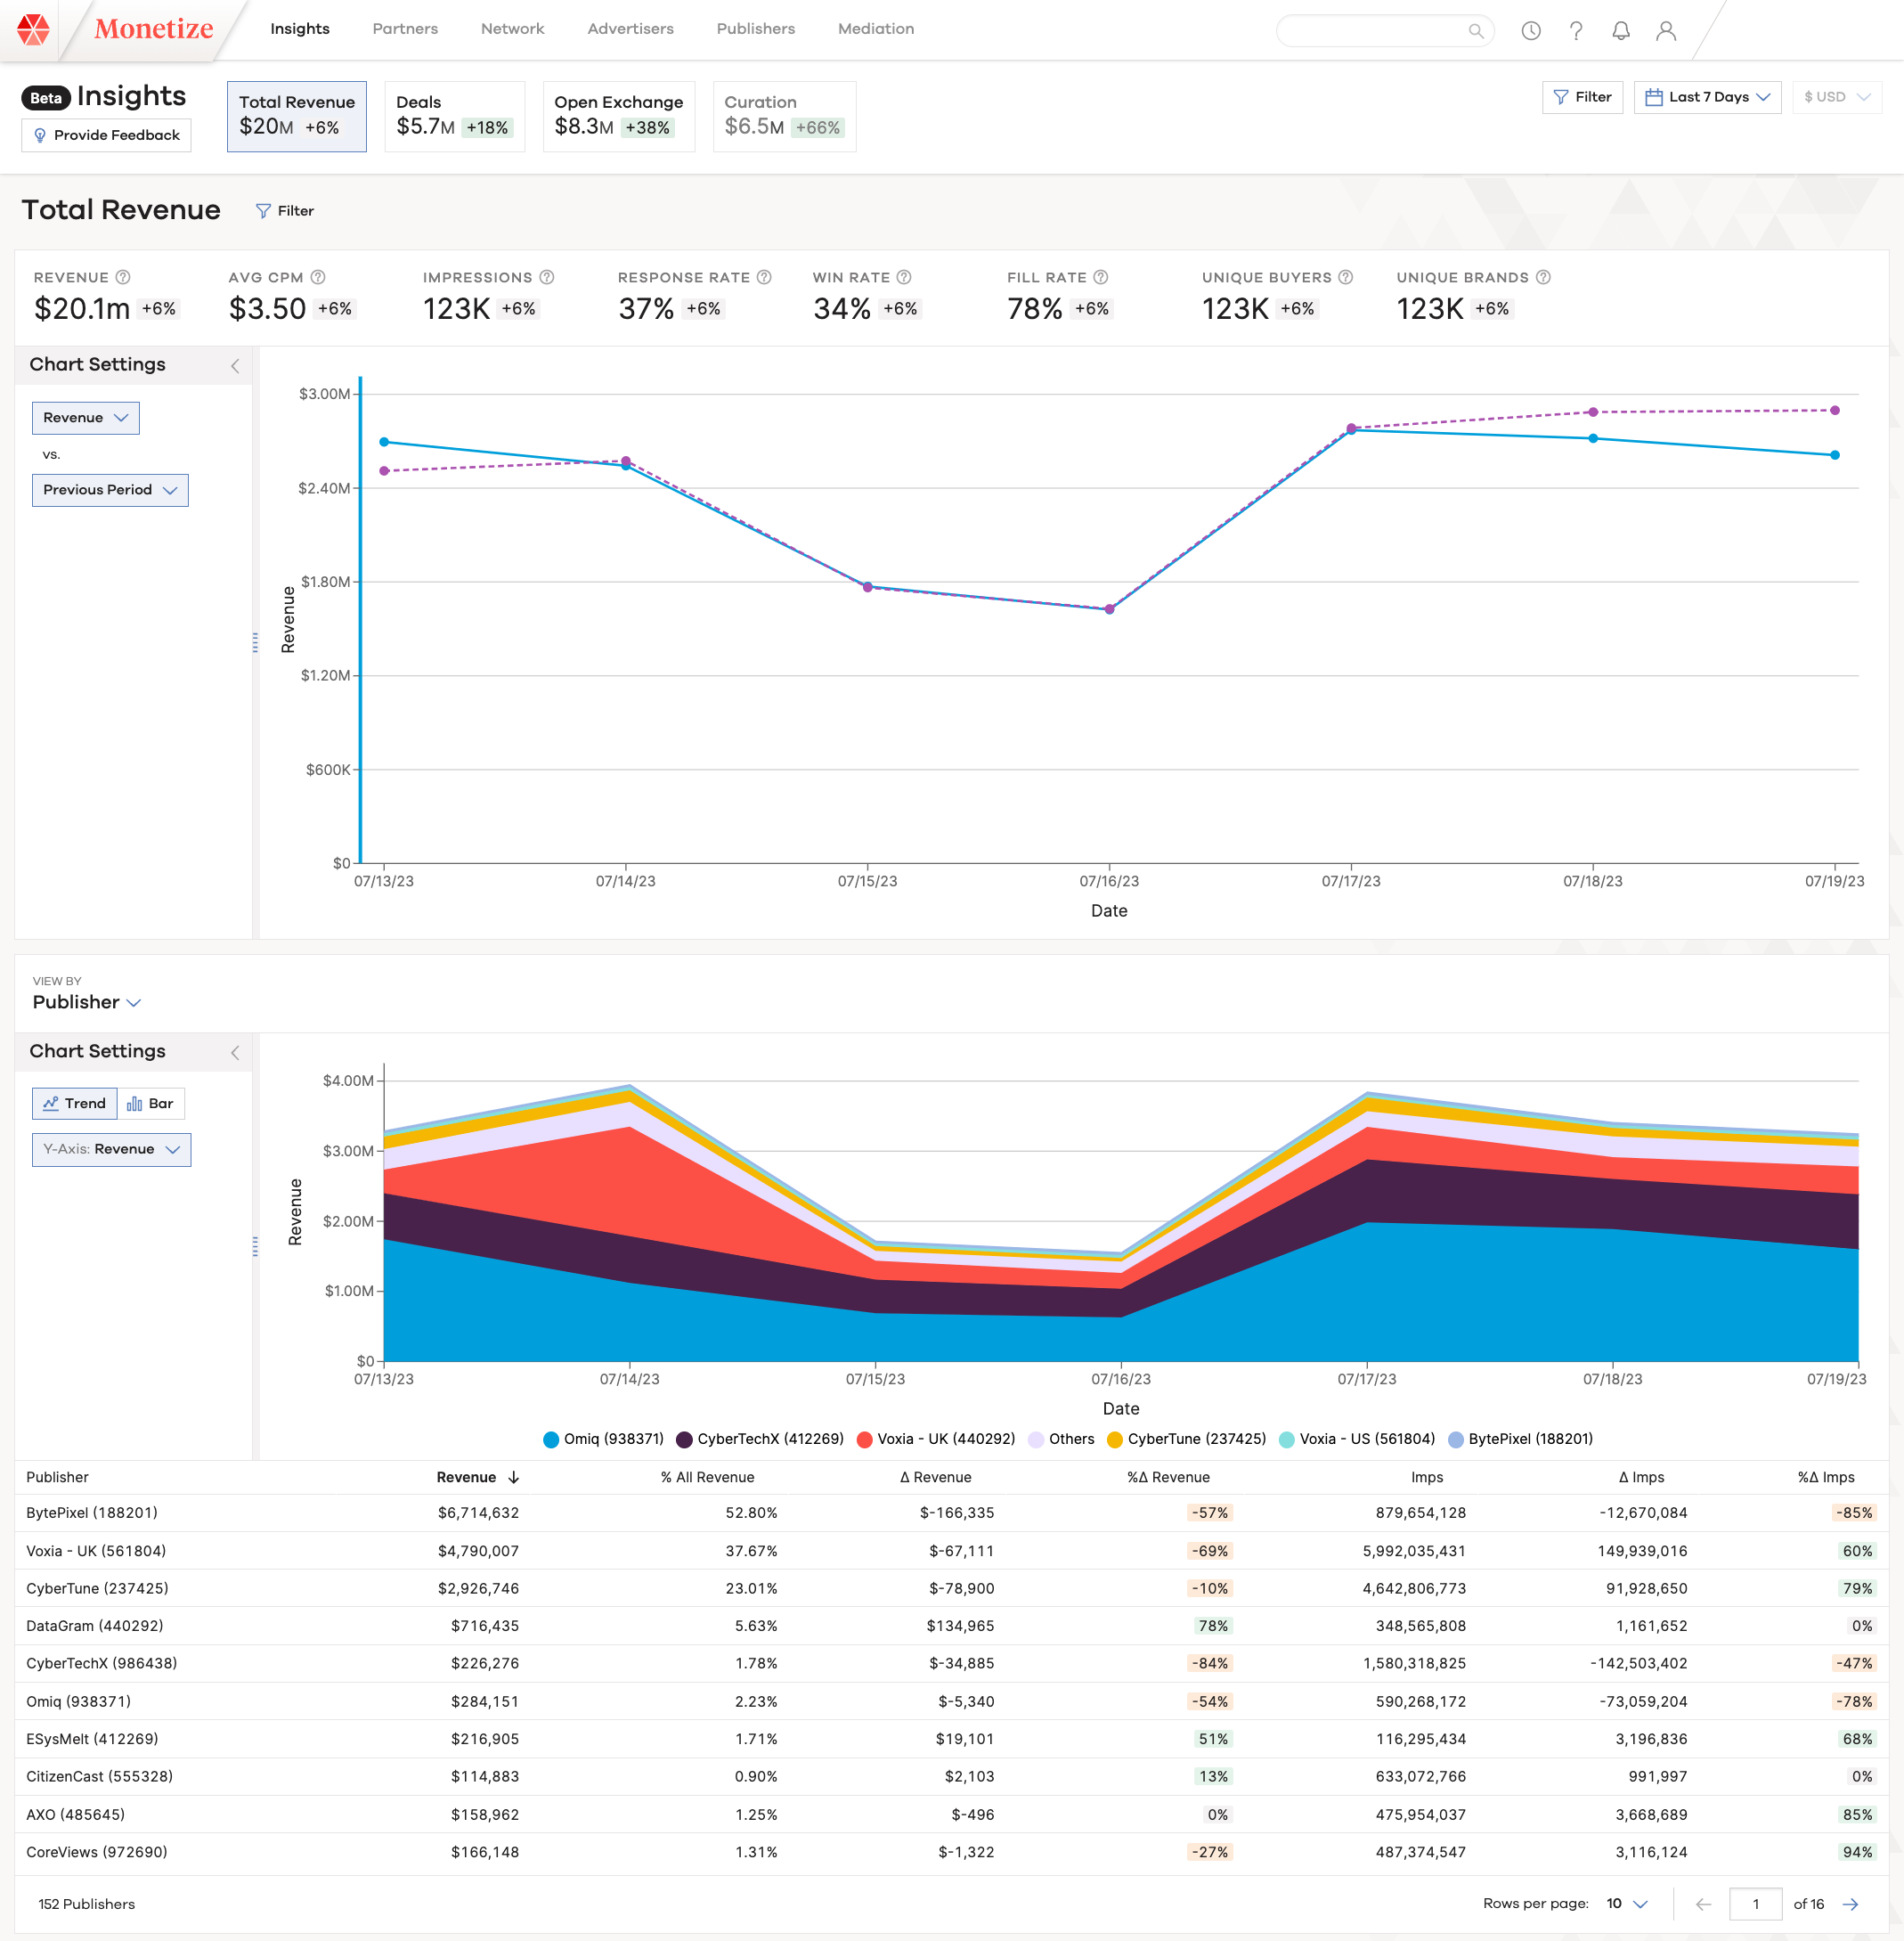
The Total Revenue tab of Monetize Insights offers a convenient method for monitoring business performance and key performance indicators (KPIs), such as:
- Revenue
- Impressions
- Ad Requests
- Fill Rate
- Win Rates
Analyzing trends and significant changes is made easy by dissecting the data based on different dimensions, such as:
- Channel
- Buyer,
- DSP
- Brand
- Publisher
- Placement Group
Users can customize the screens with filters, specific to an inventory or demand pertinent to their roles. Delving further into the data is a straightforward process, simply click on the table to reveal specific metrics for the selected criteria.
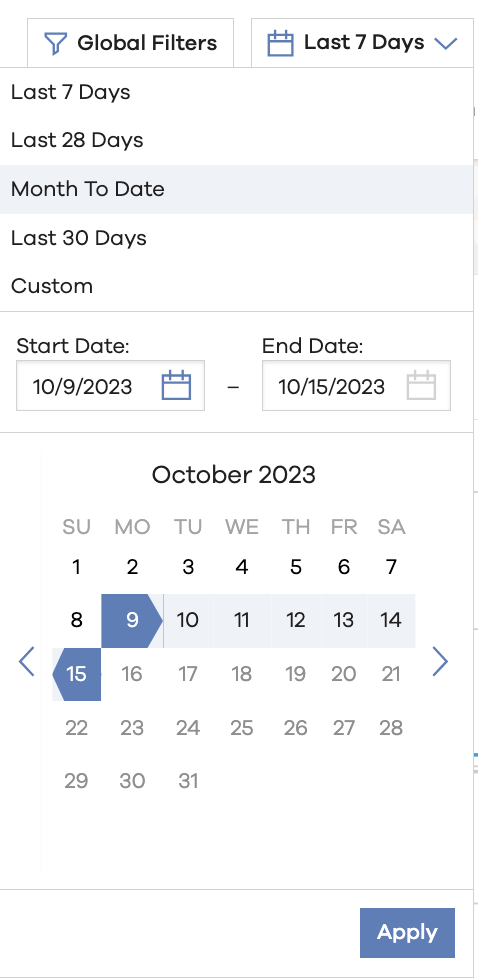
Navigation bar, global filters and date selection
The Navigation bar located at the top of the Insights page allows you to seamlessly switch between Total Revenue, offering a comprehensive view of KPIs and trends across all channels, and individual channels. At the global level, you can apply filters that will be effective across all tabs in Insights, in addition to choosing specific date ranges, with the flexibility to select a date range spanning up to 31 days ago, and an option to compare it to the immediately preceding time period, as far back as 62 days ago. The data is presented with a daily granularity in the UTC time zone, and the most recent data available corresponds to the prior day once the processing for that day is completed.
KPIs and total revenue filters
There are several several key performance indicators (KPIs) offering a quick snapshot of your business' overall health, including:
- Revenue
- CPM
- Impressions
- Response Rate
- Win Rate
- Fill Rate
- Unique Buyers
- Unique Brands
Each metric is accompanied by the percentage change from the comparison time period, with positive or negative highlights indicating significant changes. For detailed information on each KPI, hover over the "?" symbol and click on the relevant KPI, which will update the chart below with the metric trend for the current and comparison time periods.

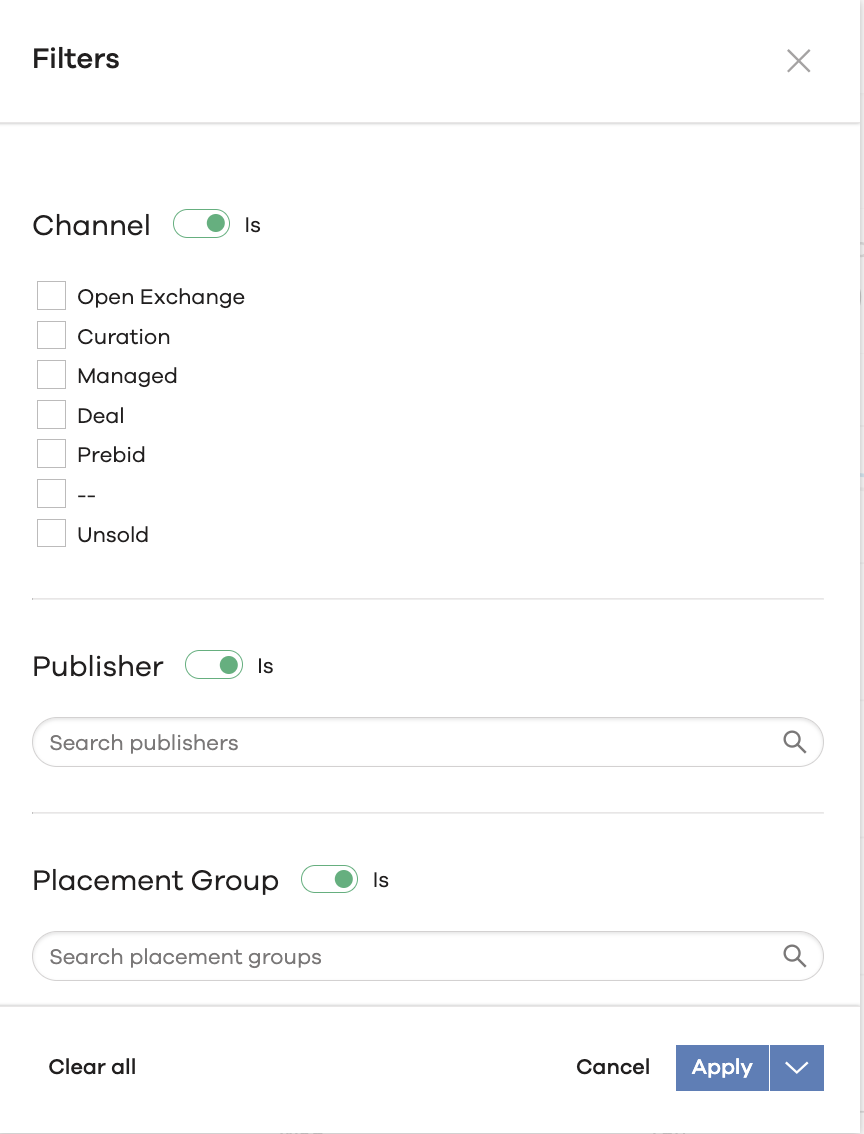
Each Insight tab has further granular filtering which can be applied to that specific tab. On the Total Revenue tab granular filtering can be performed on:
Channel
Publisher
Placement Group
Media Type
DSP
SSP
Advertiser
Insertion Order
Buyer
Brand
Note
It is possible to use filters to include or exclude specific values.
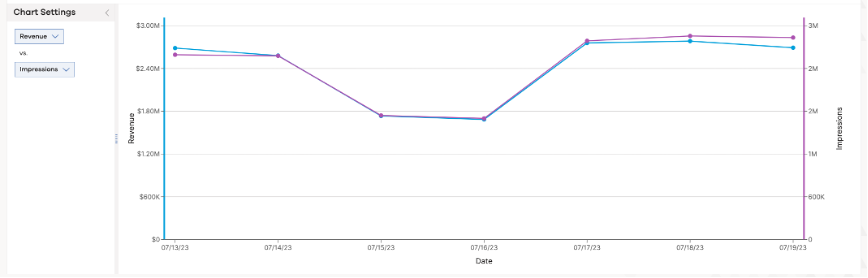
Trend comparison chart
The trend comparison chart illustrates the correlation between the current and comparison time periods or, alternatively, the correlation between two different metrics, such as Impressions and Revenue, as shown below. The available metrics that can be plotted on the chart include:
- Revenue
- Impressions (All impression types, including blanks, PSAs, and Defaults)
- Imps Sold (Kept and Resold impression types)
- CPM (Revenue divided by all Impressions)
- Ad Requests
- Ad Responses
- Win Rate (Imps sold / Ad Responses)
- Fill Rate (Imps Sold / Ad Requests)
- Response Rate (Ad Responses / Ad Requests)
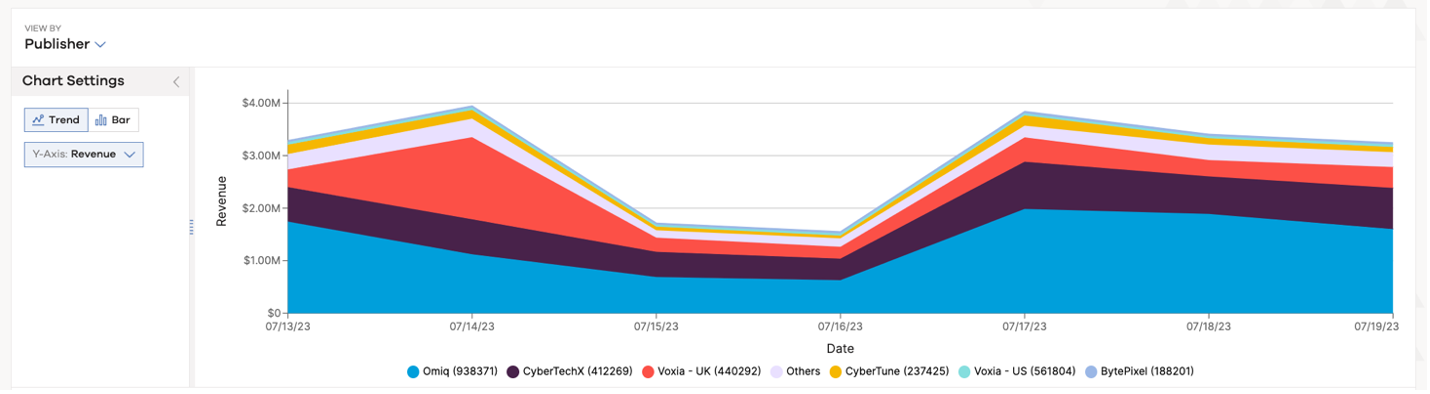
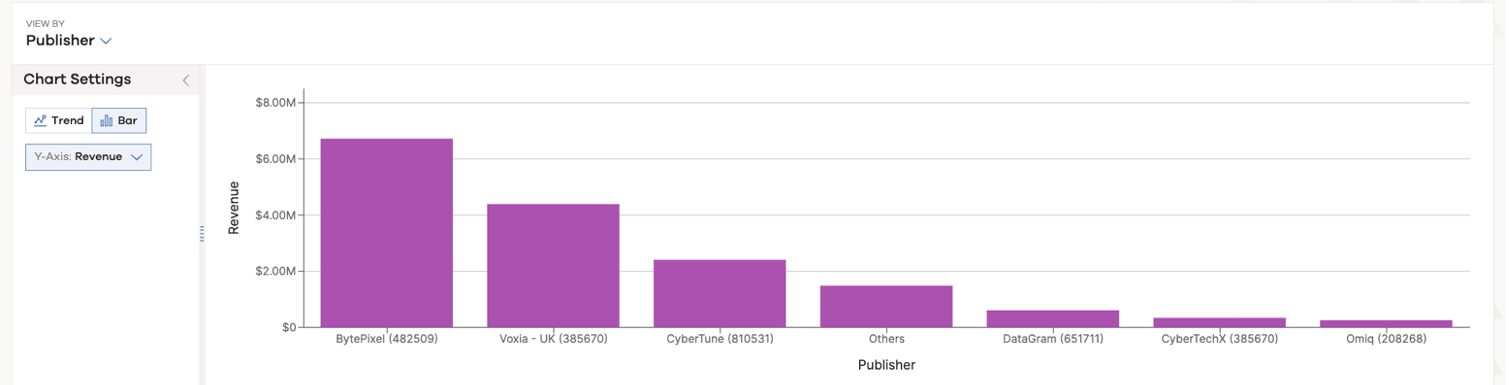
Detail chart and table
The subsequent section of the Total Revenue page presents a detailed breakdown of metrics organized by a specific dimension, such as Publisher. This layout facilitates a clear understanding of the individual components contributing to the top-line metrics. You can modify the dimension by utilizing the "View By" button located at the top right of the section. The top 6 records are displayed for the selected view, while the remaining entries are grouped under "Other." The chart's display can be toggled between an area trend chart and a bar chart. Additionally, the Y-Axis metrics are customizable and can be changed to any of the metrics available in the Trend Comparison chart.
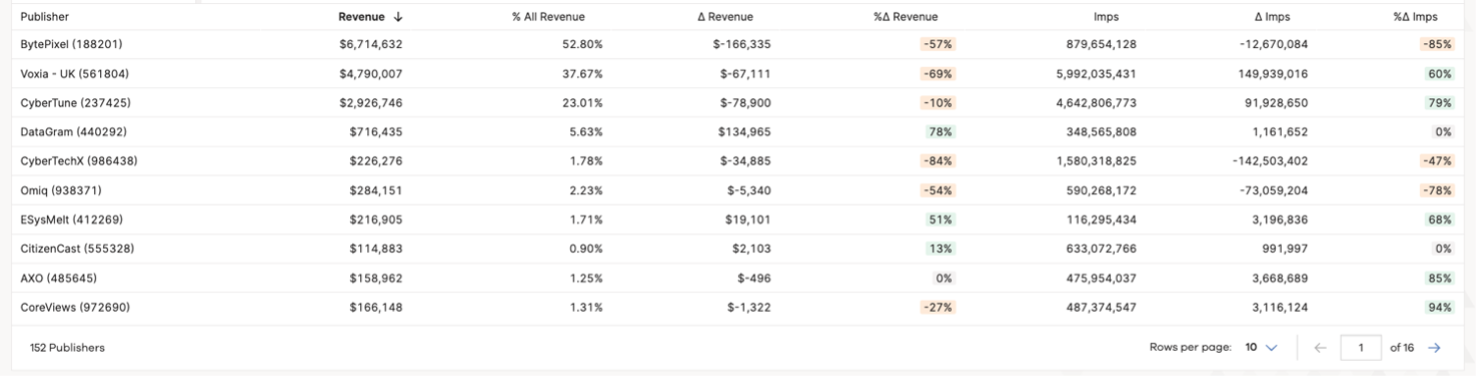
Below the chart is a table that shows key metrics, such as:
- Revenue
- CPM
- Impressions
Note
The metrics displayed in the table indicate both their relative change (∆%) and absolute change (∆), and users have the option to sort the columns in this table.
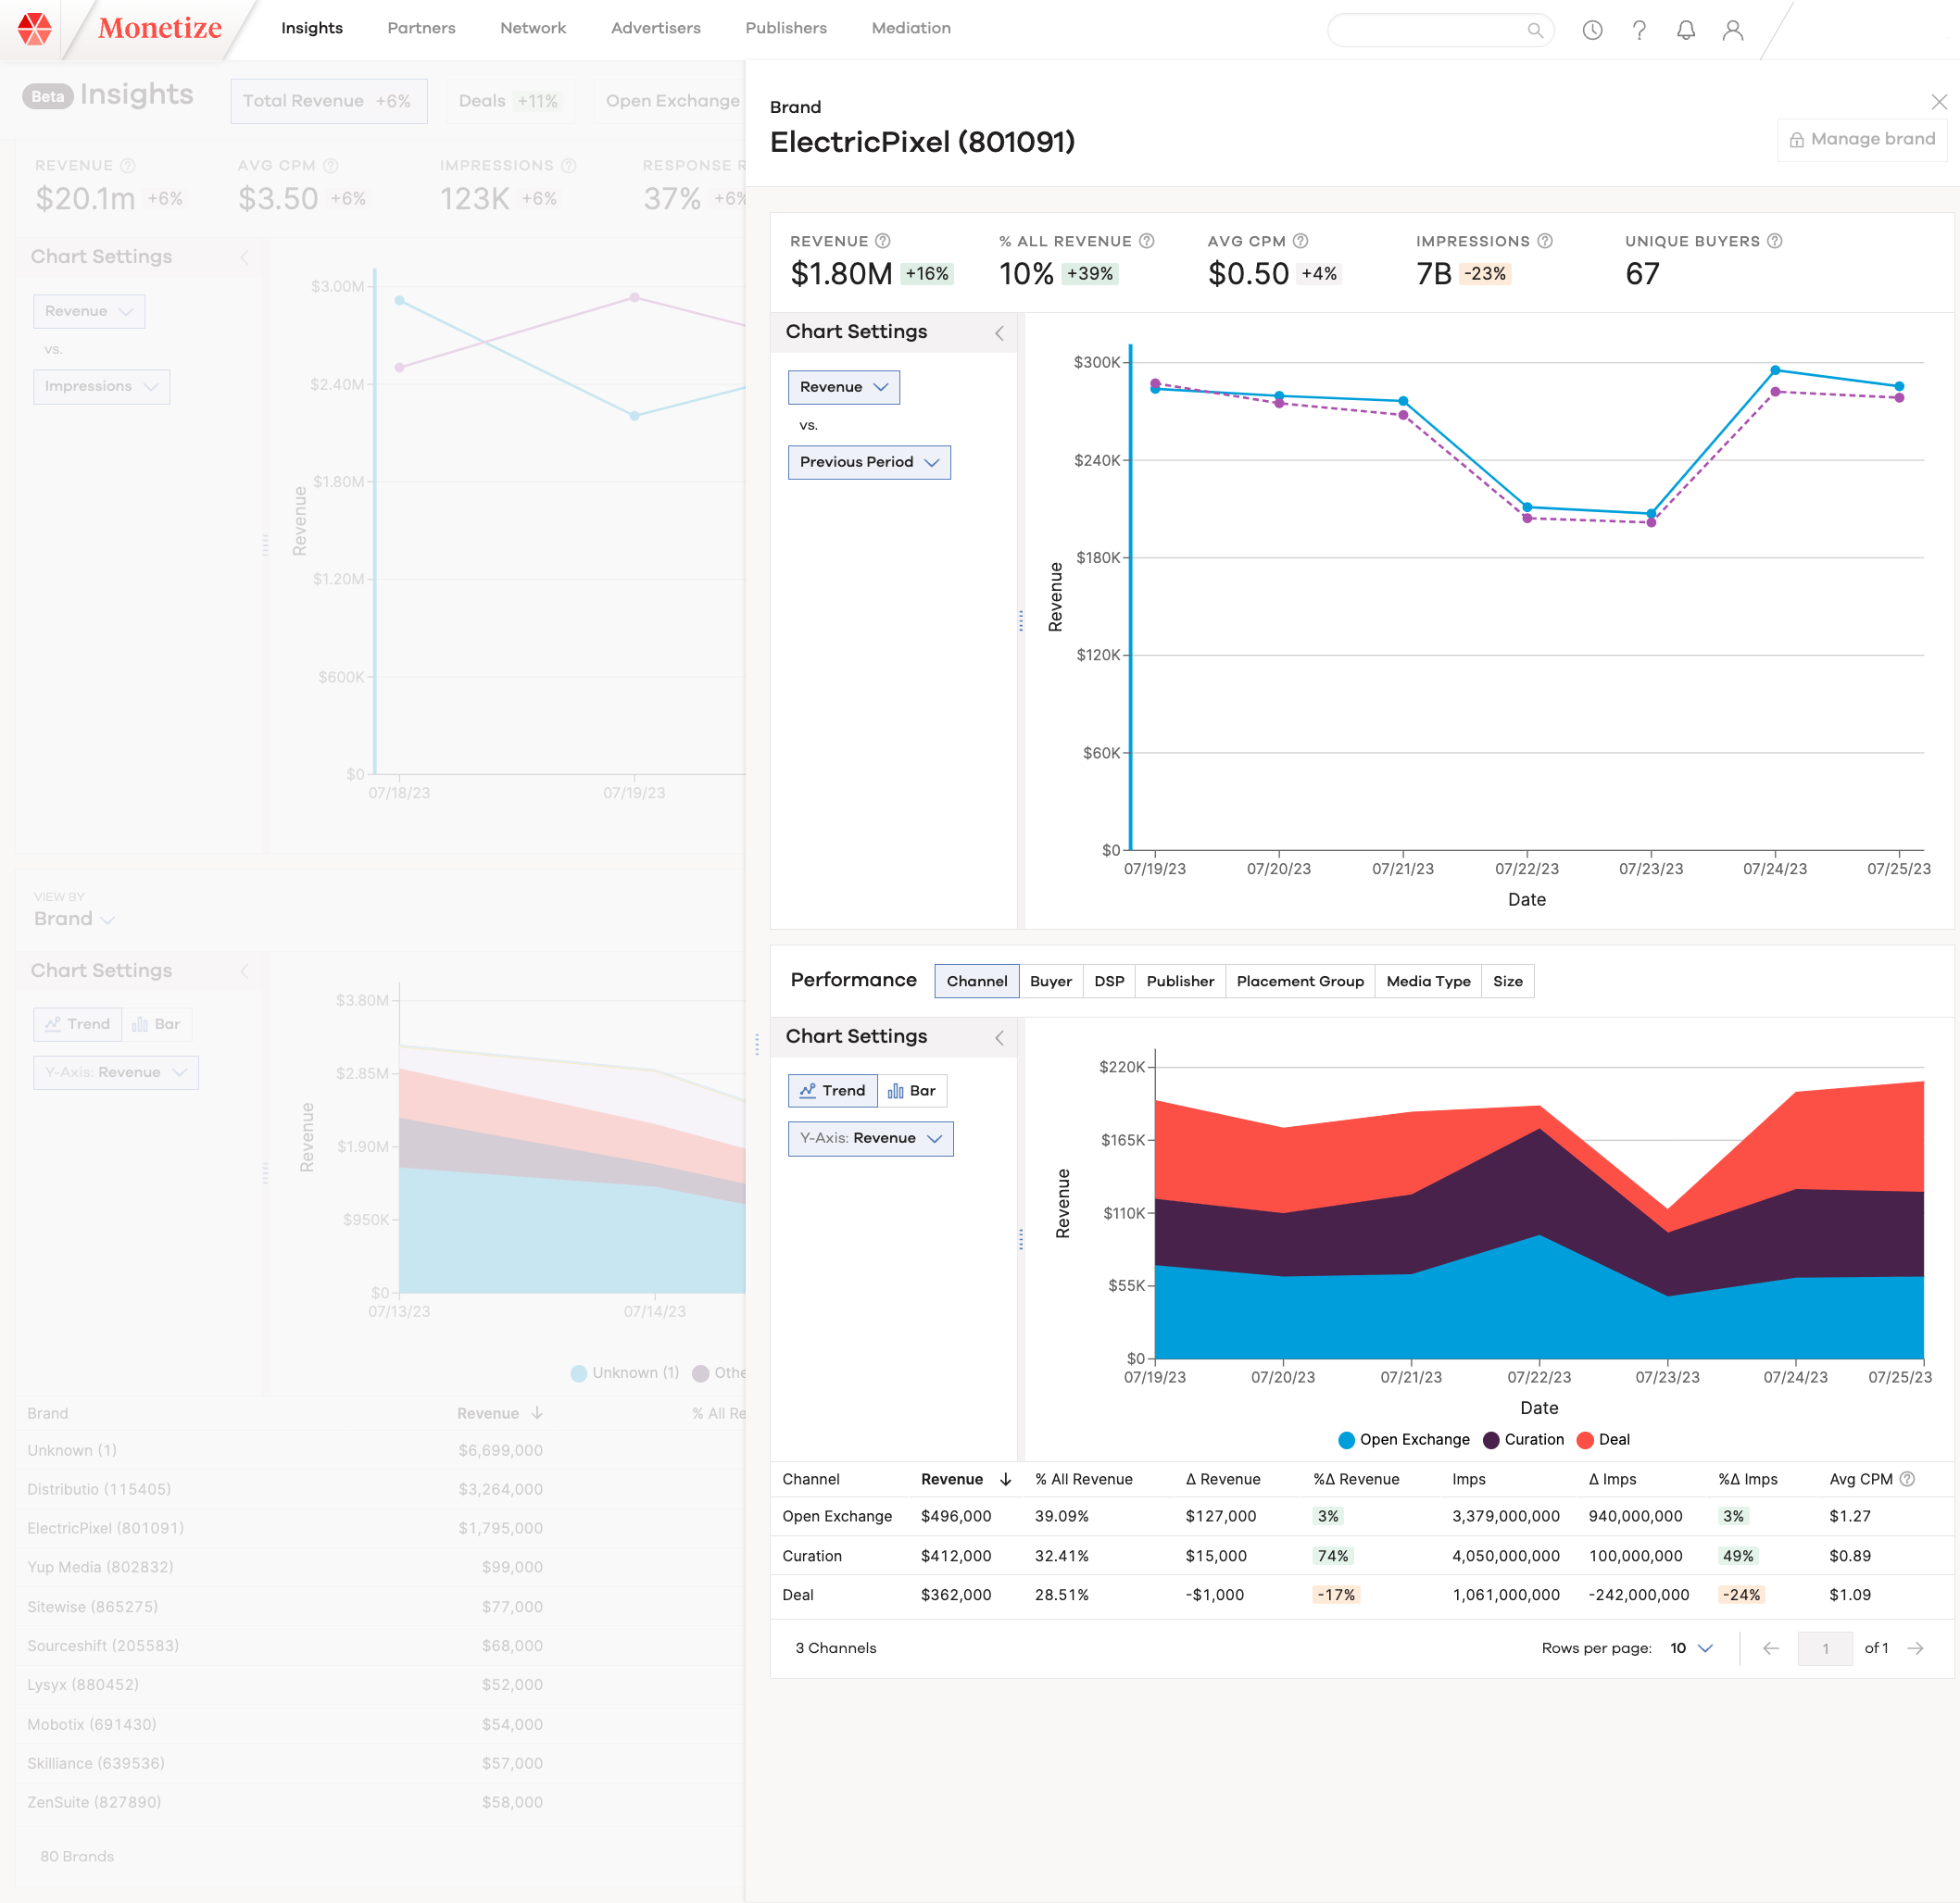
Drill down on the side panel
Clicking on a row in the detailed table will open a side panel, allowing for a quick exploration of the chosen dimension. For example, a particular brand selected, can reveal details such as revenue impressions, CPM, the percentage of total revenue, and the number of unique buyers associated with that particular brand. Subsequently, a comparative chart is displayed, followed by a detailed chart and table, all offering the same functionality as the main window.
Fidelity of data
Data within Insights is presented at a daily granularity in the (UTC) timezone and is updated daily to reflect data from the previous day (UTC). Adjustments for fixed-fee managed line items made on the same day are considered, but adjustments occurring at the end of a multi-day flight are not retrospectively applied. Metric totals are processed to align with reporting figures, with the exception of the brand dimension, which serves as an indicative measure for identifying anomalies.
For the brand dimension, data is processed to reduce data fidelity on long-tail transactions where the daily revenue from a brand on a specific placement is less than $5. In this scenario the revenue, impressions and CPM will be attributed to a category labeled "Below Threshold." For precise metrics by brand, it is recommended to utilize reporting tools rather than relying solely on Insights.