At-risk management chart and solution paths
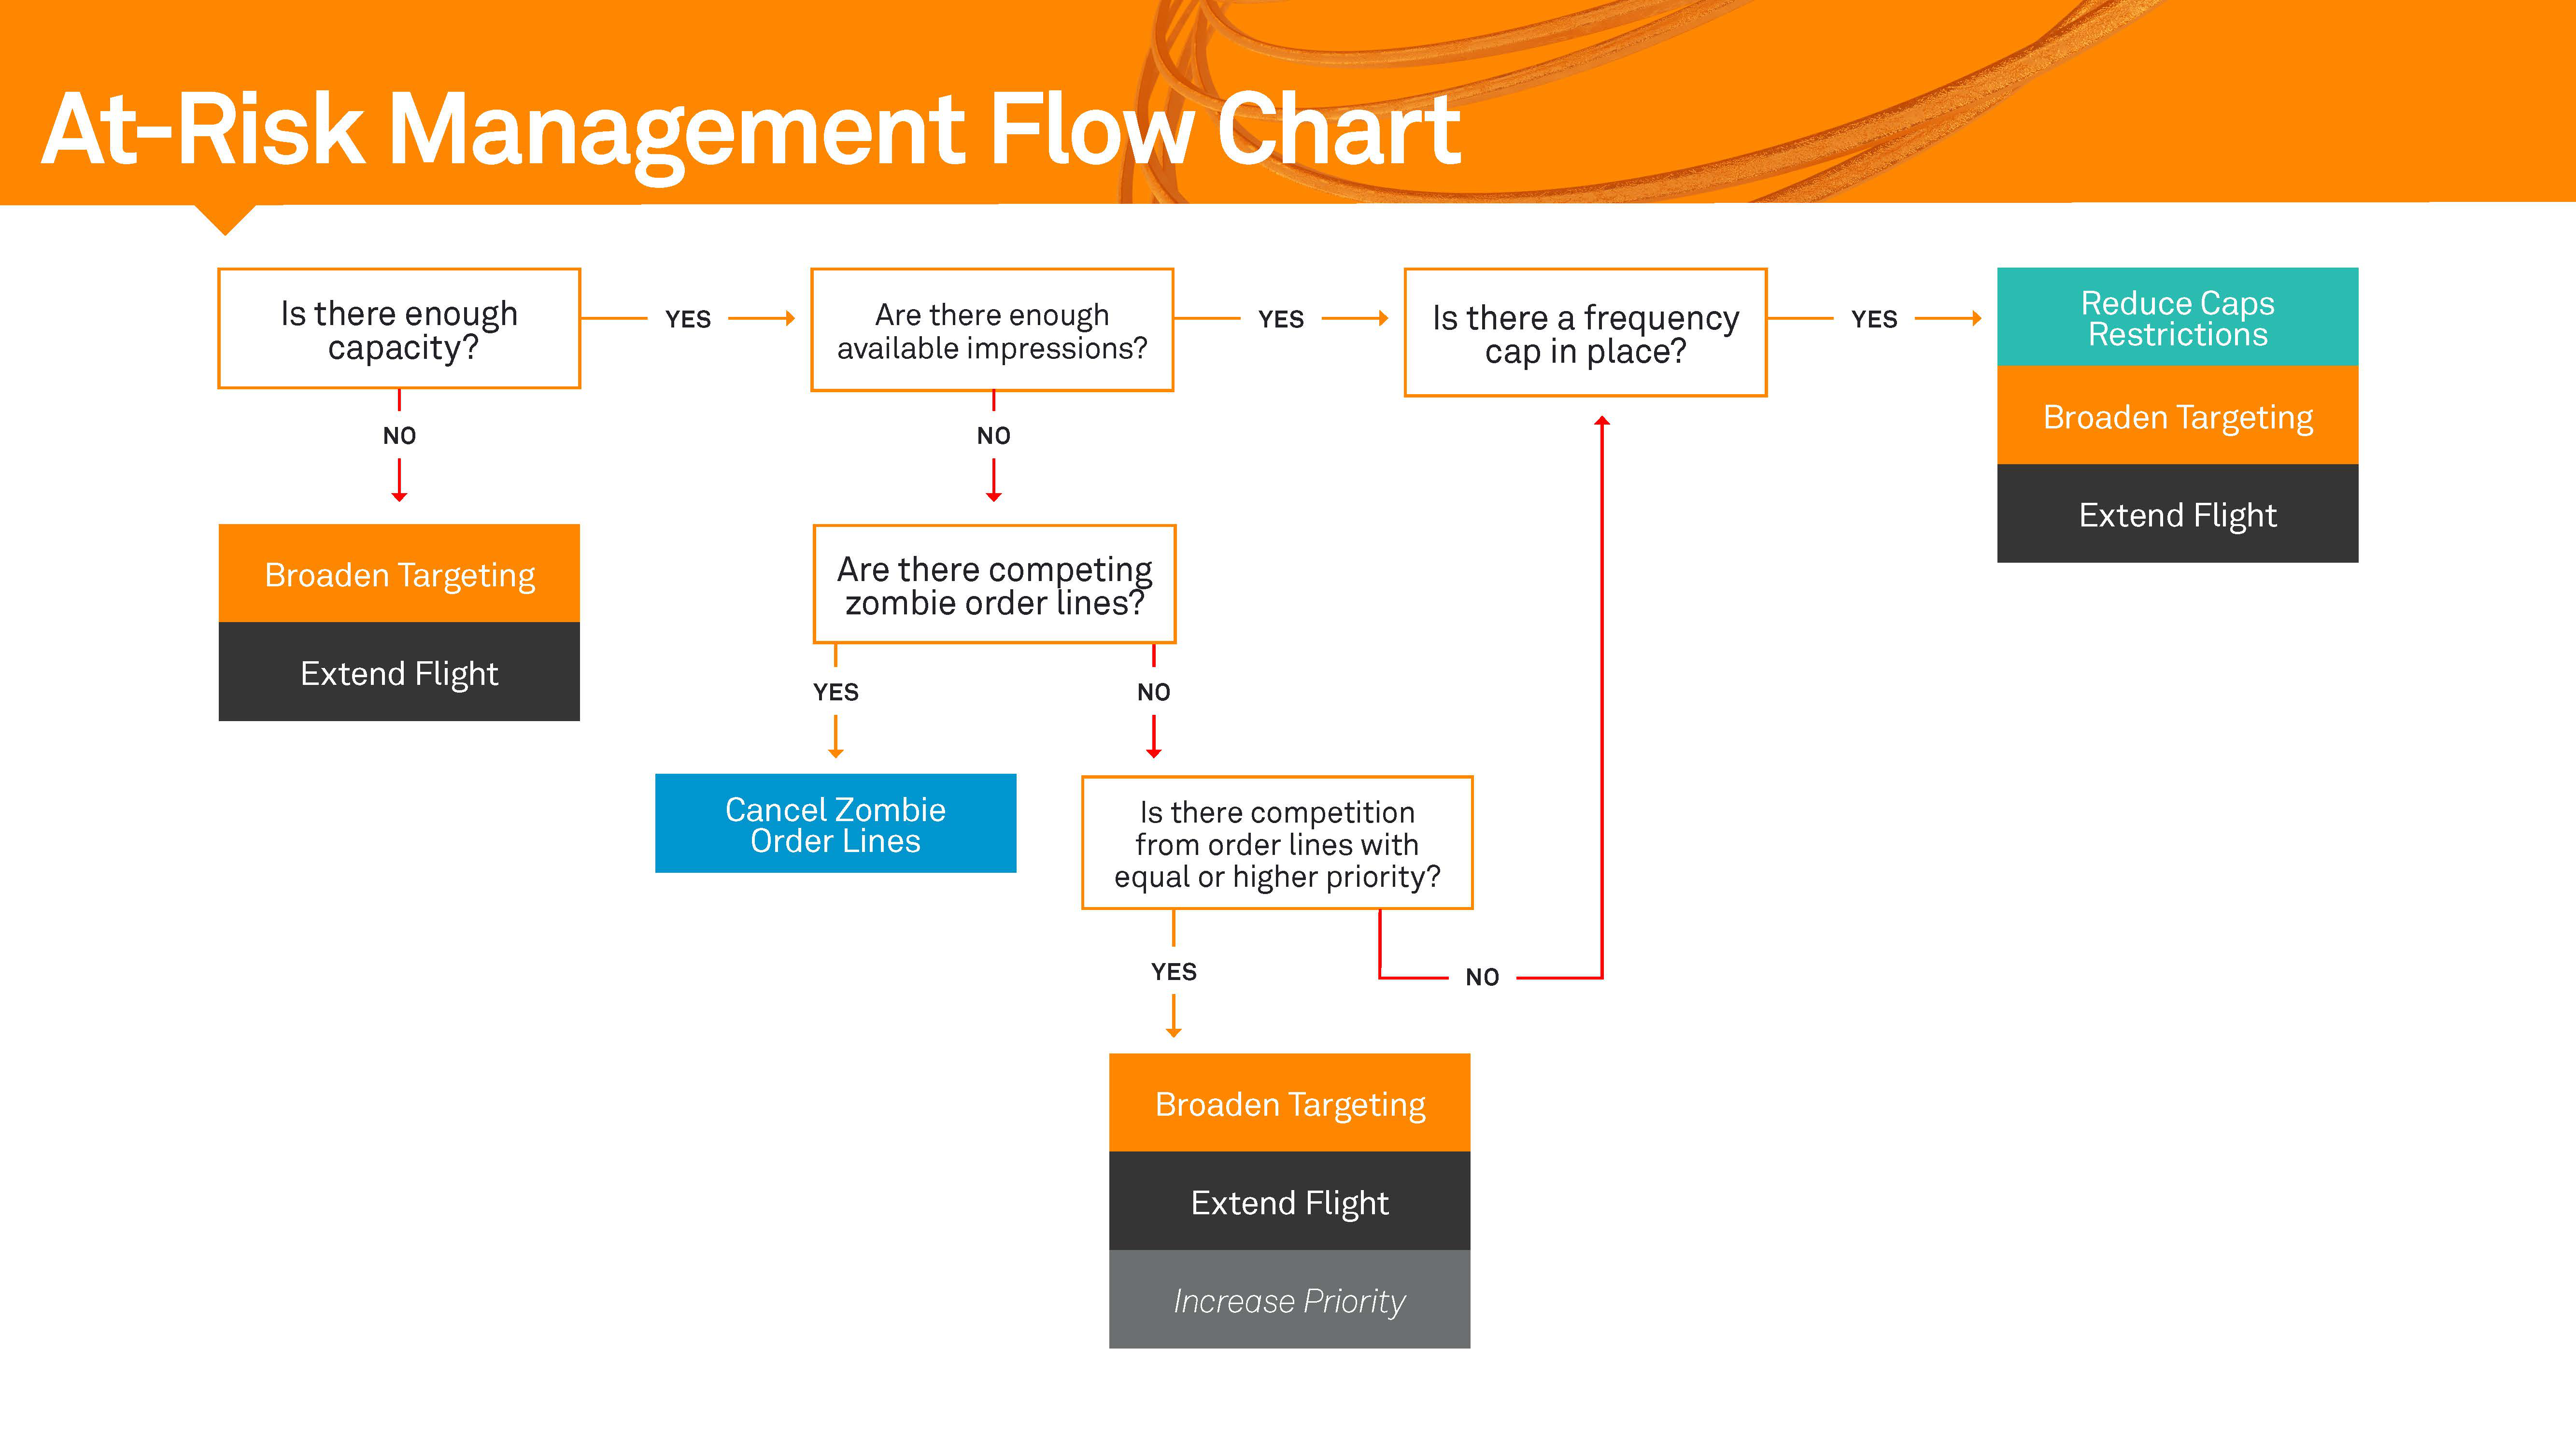
Overview
Once you have determined the root cause of your under-delivery issue, you have a choice of how to determine the best solution. For any of the root causes below, the best path is to use Availability Lookup to try out different scenarios.
Recommended Steps:
- Copy the Product Name for the order line 'at risk'. Note the Pacing - Lifetime value on the Order Line Visibility screen. This is the difference between the order line's goal and what it will actually hit. It is how many impressions you want to find with the availability request.
- Search for that Custom Product in Availability Lookup. To accomplish this, use Advanced Search in the Lookup Criteria box.
- Change the configuration in Availability Lookup to simulate different changes, depending on the strategy below. It is critical to set the time period for which you are pulling avails to be the current date. This is accomplished through the problem order line's end date vs. the default date of next month.
Reduce cap restrictions
Set the Frequency Cap value to a slightly lower amount and Check Avails. If you can't meet the under-delivery value (Pacing - Lifetime), reduce the cap some more and try again.
Broaden targeting
Remove the most restrictive element from the product configuration. Example: If you have multiple audience restrictions, try removing the most specific one. If you have many site sections, change the variable to a broader ad unit value.
Extend flight
Try pulling a longer time period than the order line's end date. Then use the 'group-by' feature, which will give you the results by month/week/day. You can then see where the product opens up, if at all.
Increase priority
Try pulling availability with a priority value higher than your current order line. This will tell you how changing priority will impact delivery. You may also want to run a Scenario Manager if there is a lot of Guaranteed Direct/Contained competition and you are concerned about creating a new problem on other order lines.
For the two use cases below, the solution is slightly more involved and is best solved through a report. These are 'edge' cases you should rarely encounter.
Increase rate
- In every solution, we are trying to identify consumption by a particular dimension in order to see where the demand falls. We are doing the same thing for price priority order lines, but price is is our dimension instead of priority or frequency. We must construct a curve that shows us how many impressions are consumed by rate amounts. This is so we can understand how changing the rate will change consumption.
- To accomplish this, you need to pull a report by product (filtered to the problem order line's custom product). It must be broken down by order line, with consumed impressions and contracted CPM as your metrics. Remember to set the time period for today through the order line's end date.
- Now that you have the dataset, you need to export it into Excel. This is to manipulate and aggregate the data by different rate ranges.
- Pivot this dataset by your contracted cpm as the row label, and consumed impressions as your value. This now shows your consumption by various rates.
- You need to determine at what rate there is enough consumption to deliver your order line in full. You should sum each rate tier together until you have enough impressions to meet the Pacing - Lifetime deficit. Then pay one penny above that value, since you need to have a rate that will beat the other campaigns.
Cancel zombie order lines and reassess
- Zombie order lines are order lines that are in a pending state, but have a start date in the past. These order lines force Yield Analytics (and your ad server) to predict consumption against them. (They don't actually consume impressions if they never move out of a pending status).
- Frequently, these order lines are campaigns where:
- The creative is late.
- The client has pushed out the deal and the opportunity in OMS has not been updated.
- The deal was cancelled at the last minute and then forgotten about.
- You can identify Zombie order lines by:
Pulling a basic report in Yield Analytics.
Setting order line as your dimension.
Consumed impressions as your metric.
The filtering on order line status = pending.
Start date (not the time period) to a date prior to the current date.
For example, two weeks earlier than today is usually a good way to identify these problem order lines. If today was October 15, 2017, you'd want to set the start date filter to (earliest date available - October 1, 2017). It is also sometimes helpful to pull in things like a Salesperson's name, the Advertiser, and other elements to help you follow-up:
- Any order lines that meet this criteria should be seriously questioned. Are they actually happening? If so, they should have their start date updated to a more realistic launch. If they will not go live, they should be moved to a canceled state.
- After you make these changes, Yield Analytics will pick up the change during the next nightly processing cycle. Once that happens, check your order line's risk again and see if the problem still exists. If so, start from the beginning of the flow chart again and re-diagnose the problem.