Note
Access to this page requires authorization. You can try signing in or changing directories.
Access to this page requires authorization. You can try changing directories.
On this page you'll find a list of top reports based on various criteria.
Product Maintenance report
Description
Dim: Product
Metric: Impression Capacity
Add’l Dims: Product Type, Product Yield ID
Filters: Include Zero Values – Yes, Product Type – Reporting, Rate Card, Product Status: Active, Period – Last Month
View: Data Table
Display: 500
Note
Export this report. Look for rate card and reporting products with zero capacity that can be removed from your system. (Send the list of IDs to your Client Services rep). It is recommended to schedule this exercise. Schedule this exercise once a quarter.
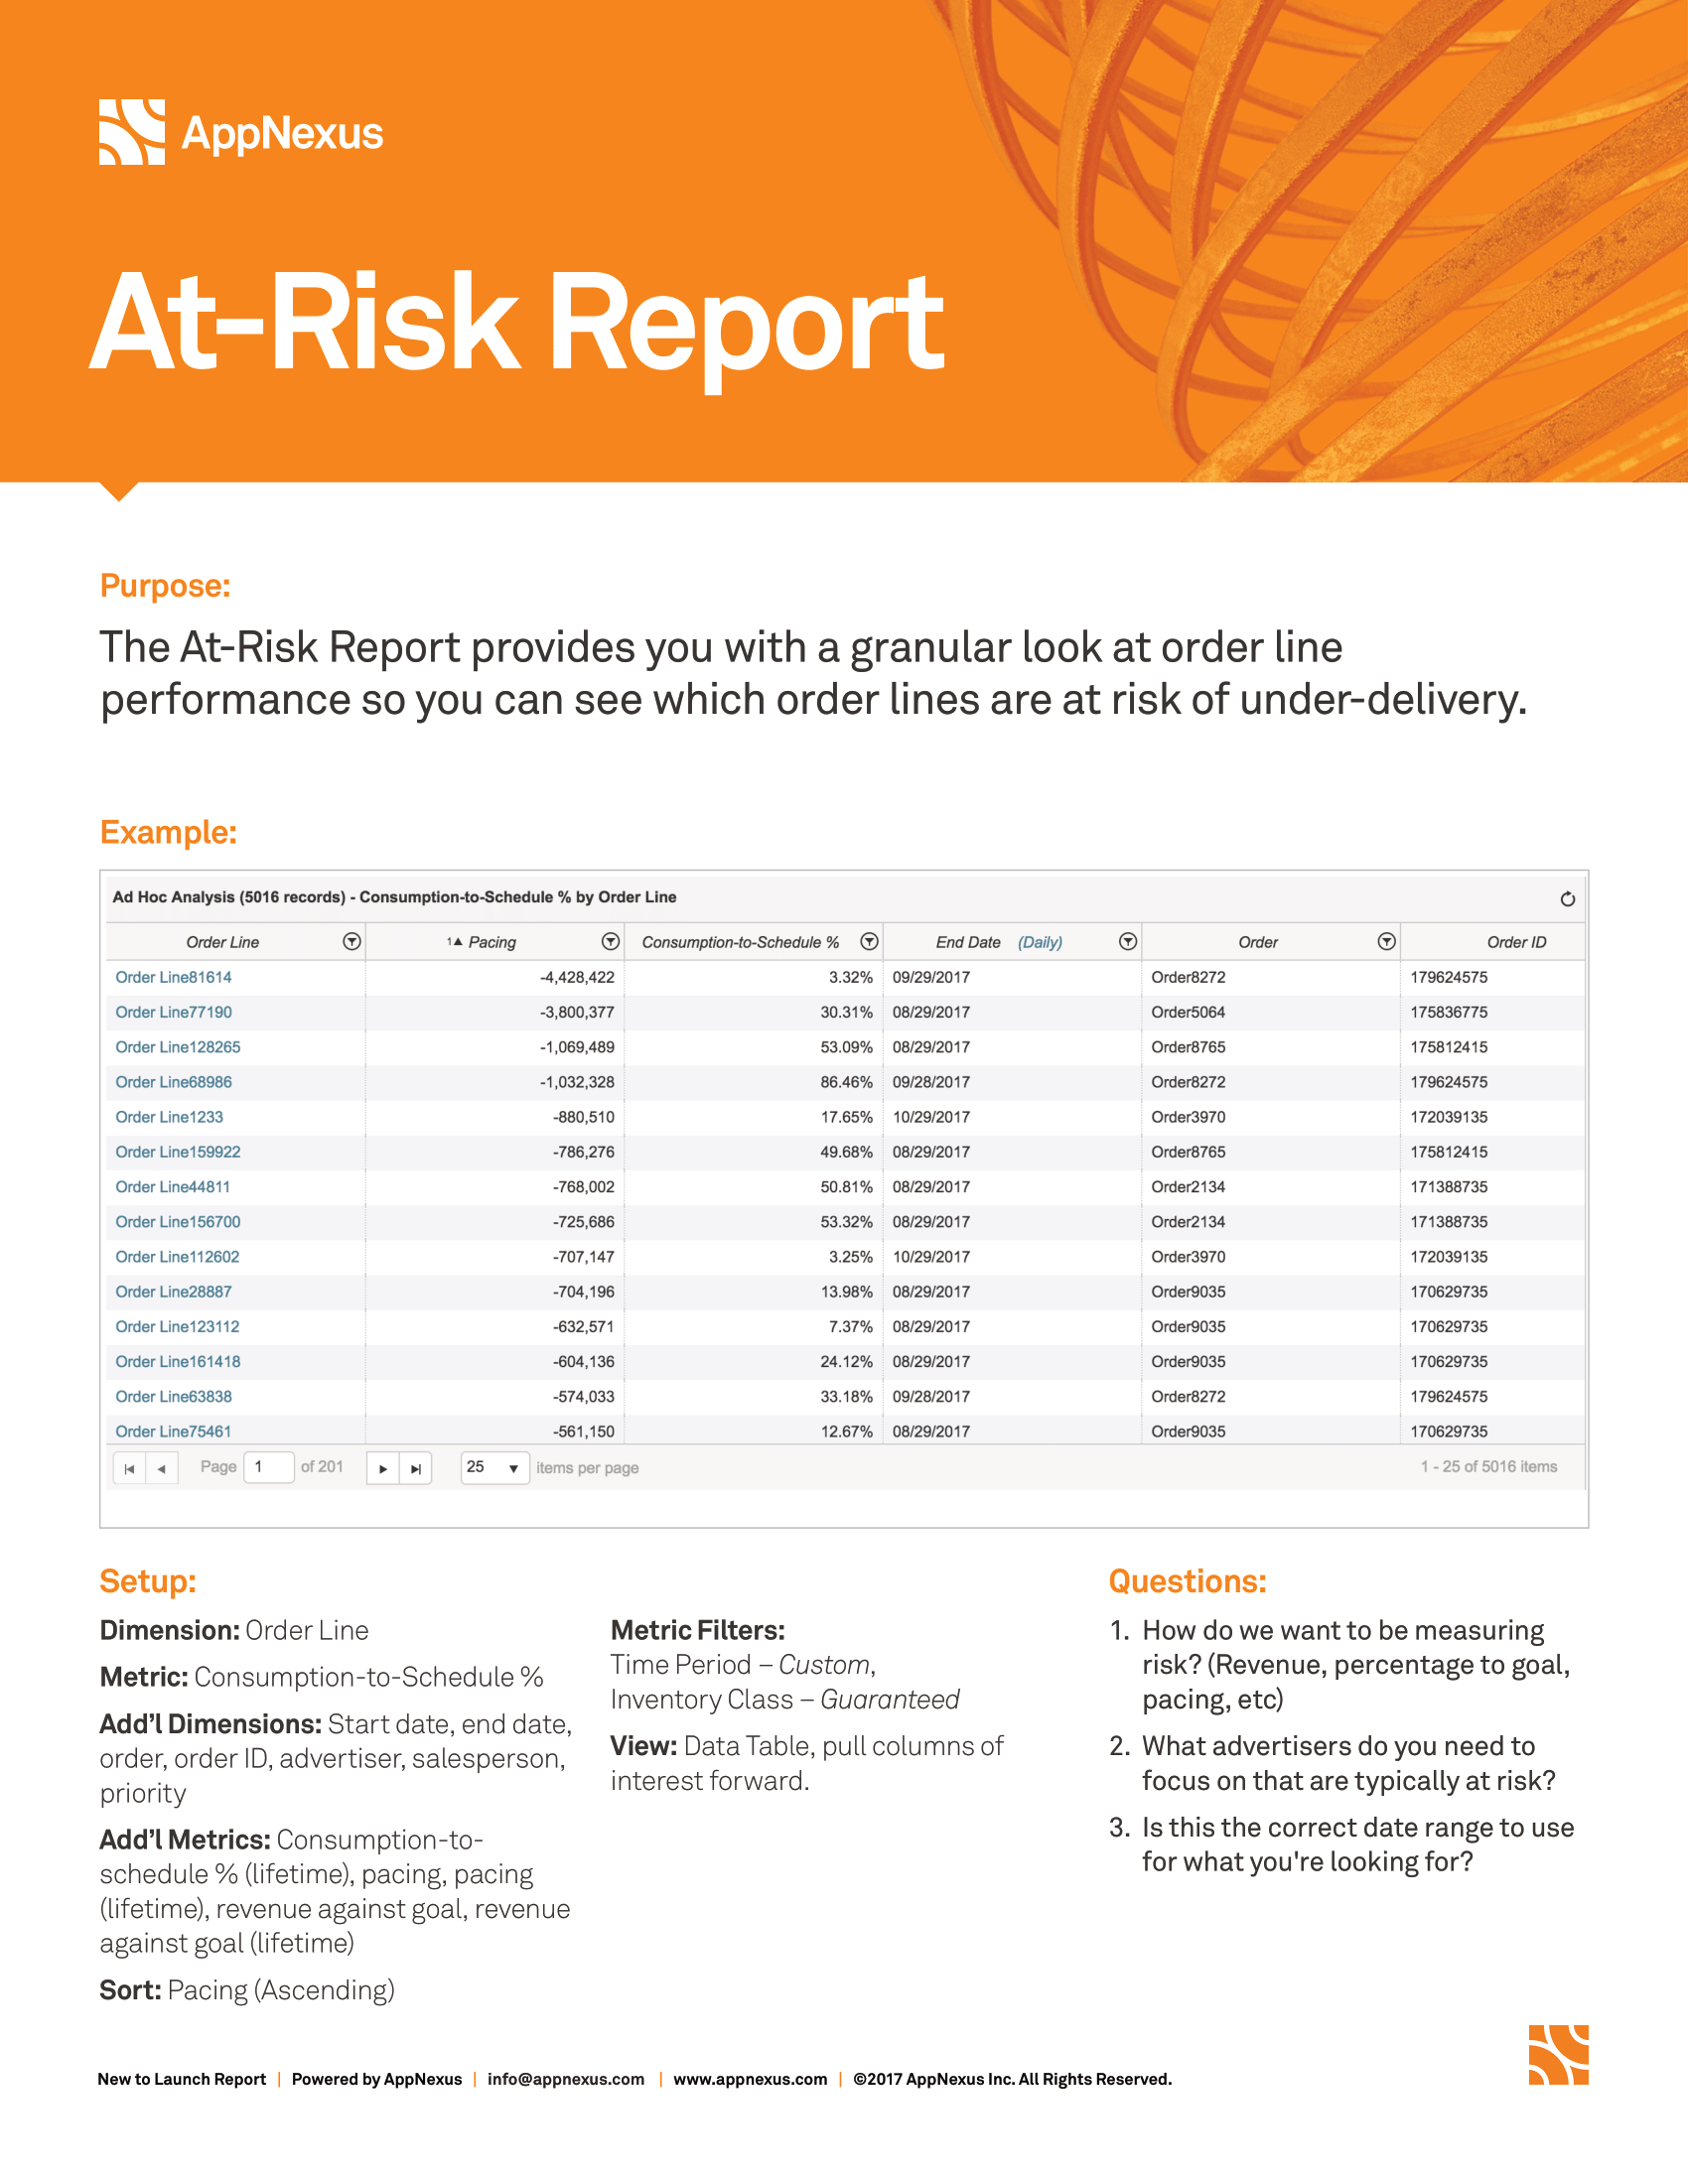
At-Risk report
Description
- Dim: Order Line
- Metric: Consumption to Schedule
- Add’l Dims: Advertiser, Salesperson, Order, Order ID, Order Line ID, Priority, Order Line Current Target Expression, Start Date, End Date
- Add’l Metrics: Consumption to Schedule (Lifetime), Revenue Against Goal, Revenue Against Goal (Lifetime), Pacing, Pacing (Lifetime)
- Filters: Period – This Quarter, Inventory Class – Guaranteed
- View: Data Table
- Display: 500
Note
This report is designed to track campaign delivery issues. By comparing C:S to C:S (Lifetime), you can see if order lines are projected to get better or worse between your current time frame and their end dates. Schedule this once per day, or week.
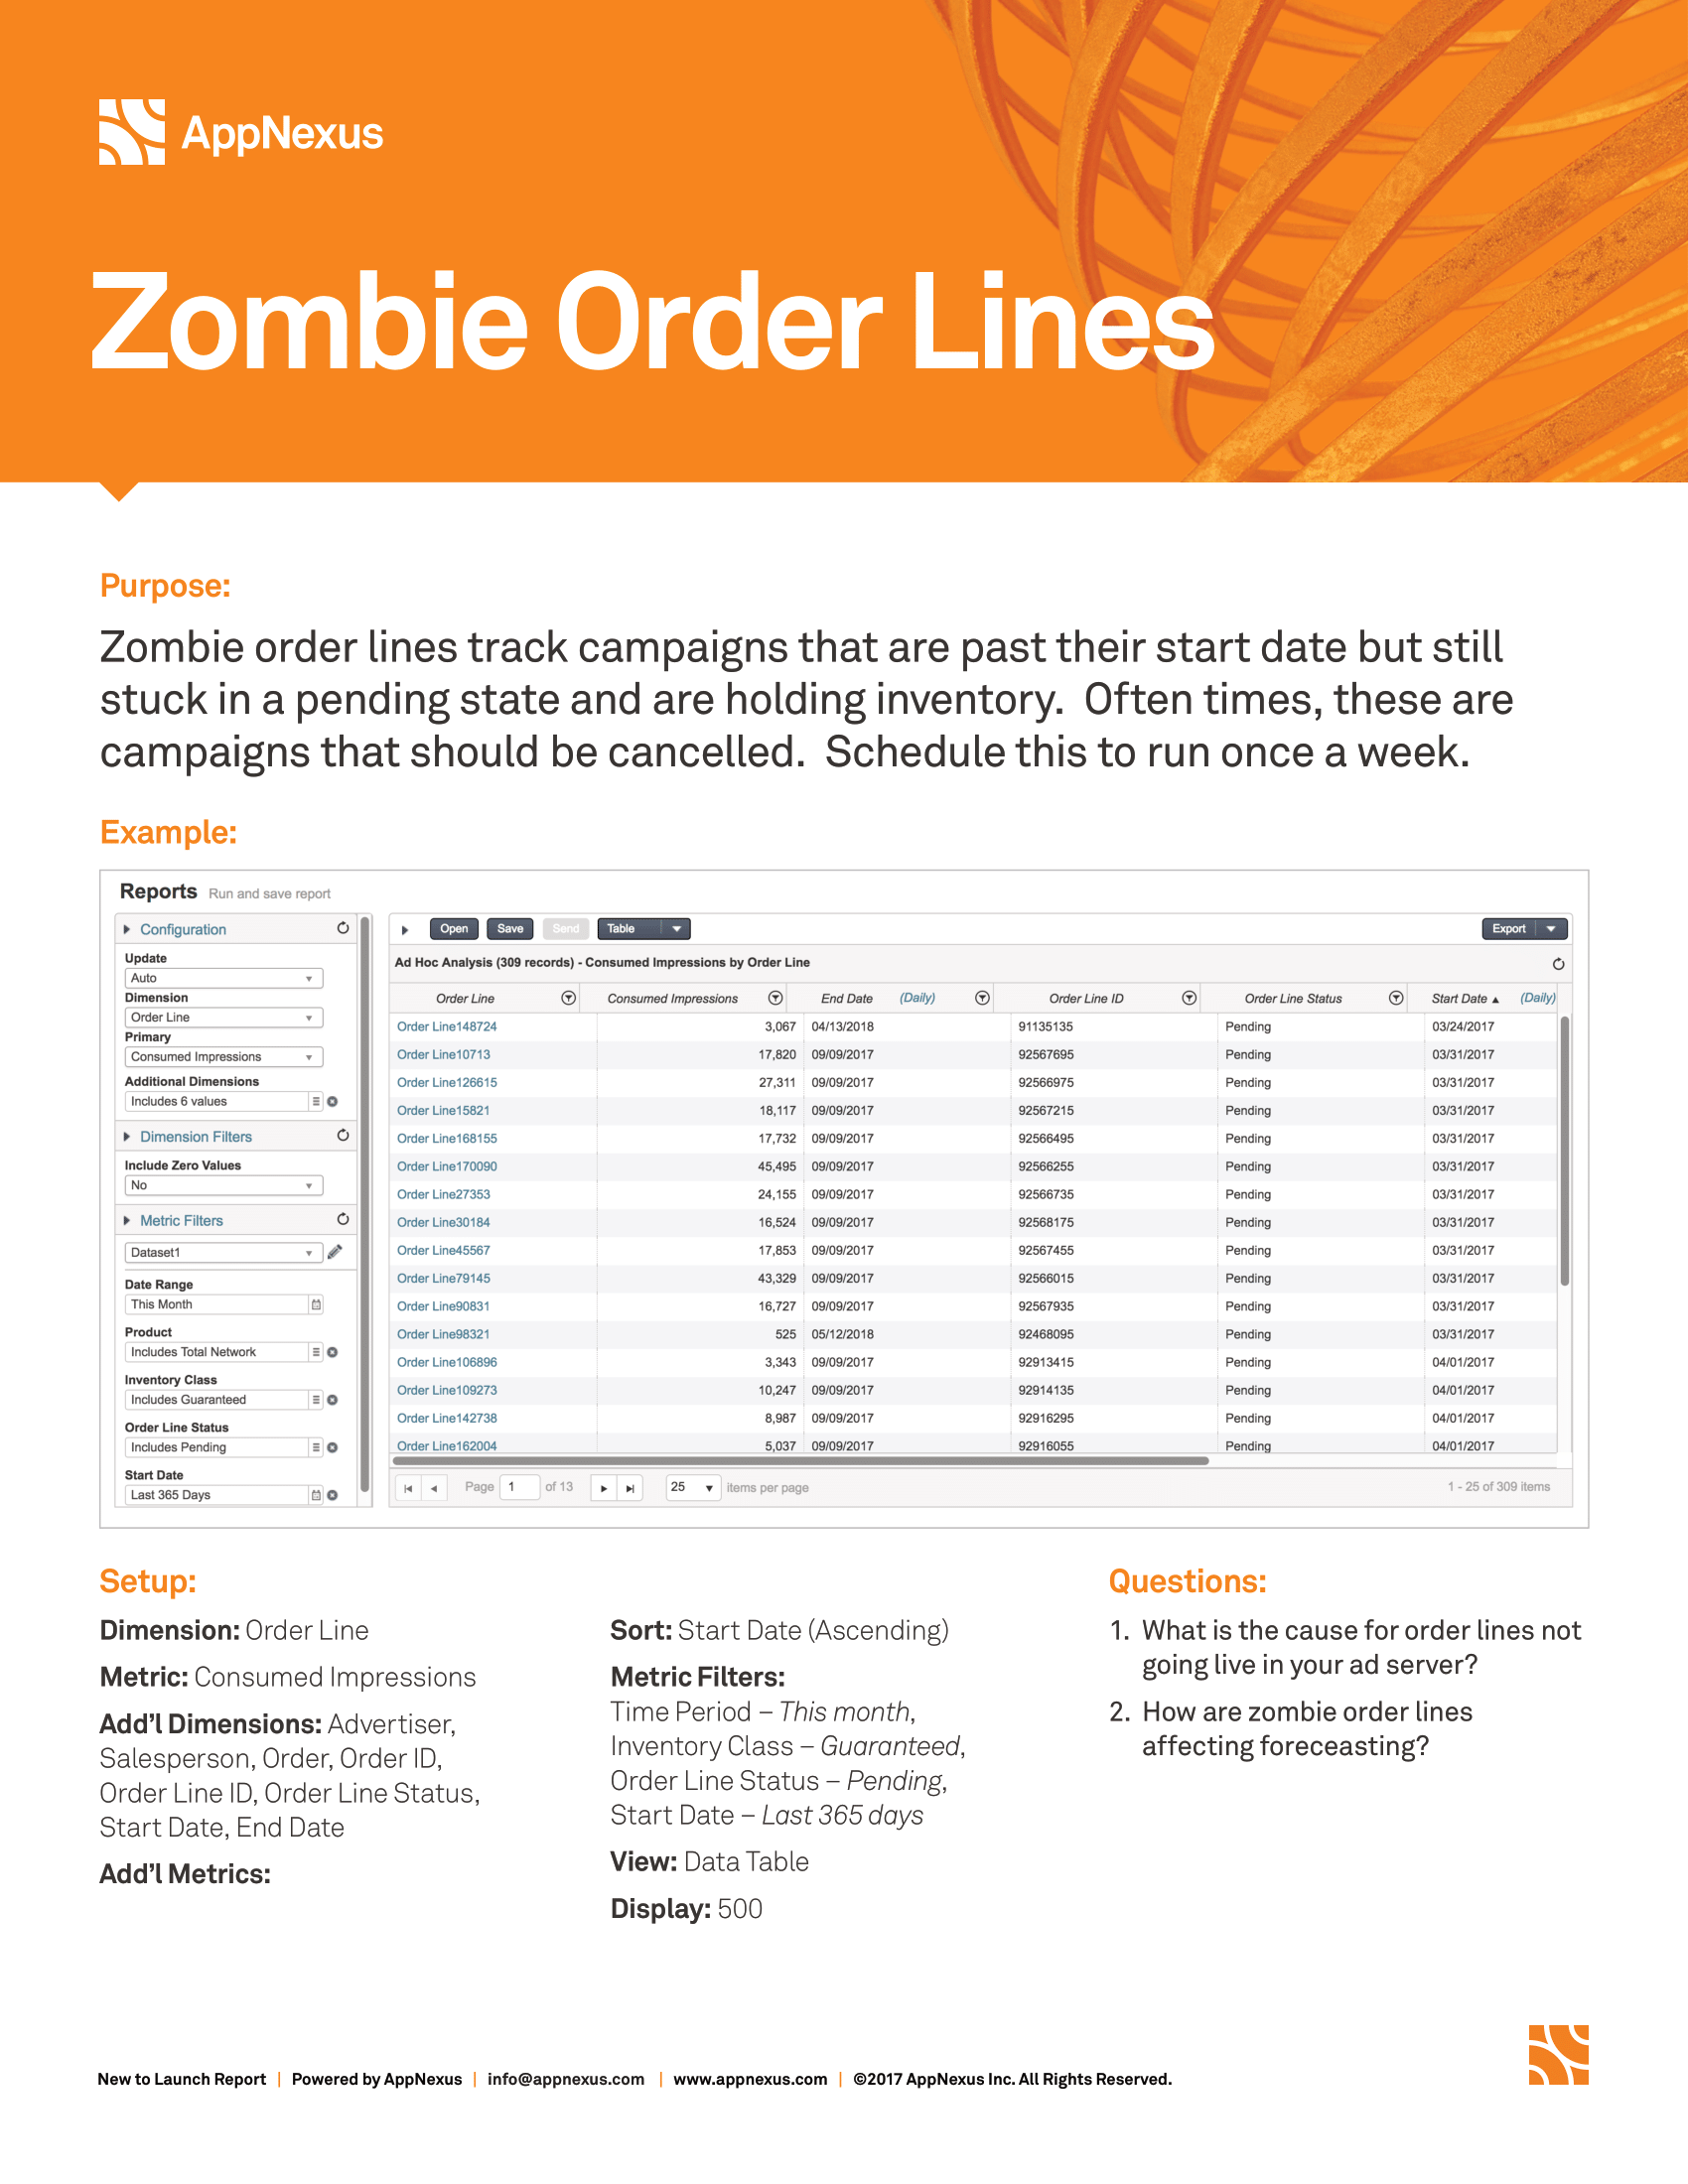
Zombie Order Lines report
Description
- Dim: Order Line
- Metric: Consumed Imps
- Add’l Dims: Advertiser, Salesperson, Start Date, End Date, Order Line ID, Order Line Status
- Filters: Period – this month, Inventory Class – Guaranteed, Order Line Status – Pending, Start Date – Last 365 days
- View: Data Table
- Sort: Start Date (Ascending)
- Display: 500
Note
Zombie order lines track campaigns that are past their start date, but still remain in a pending state and are holding inventory. In most instances, these are campaigns that should be cancelled. Schedule this to run once a week.
Salesperson Scorecard report
Description
- Dim: Salesperson
- Metric: Earned Revenue
- Sec Metric: eCPM
- Filters: Period – Last Quarter, Salesperson – exclude (blank), Inventory Class – Guaranteed
- View: Bar Chart
- Trendline: Avg. eCPM
- Sort: Primary Metric (Descending)
- Display: 25
Note
Ranks Salespeople by Earned Revenue and eCPM. Add a direct target attribute filter to - make your analysis specific to a type of targeting (E.g.: Mobile or video sales).
Product Scorecard report
Description
- Dim: Product
- Metric: Earned Revenue
- Sec Metric: eCPM
- Filters: Period – Last Quarter, Inventory Class – Guaranteed, Product Type: Rate Card, Product Group: exclude ‘Entire Network’, Consumption Type: Direct / Contained
- Trendline: Avg. eCPM
- View: Bar Chart
- Display: 25
- Sort: Primary Metric (Descending)
Note
Ranks Products by Earned Revenue and eCPM. Use Target Attribute setting to limit products to just certain ad sizes, or add a product group filter to make your analysis more specific.
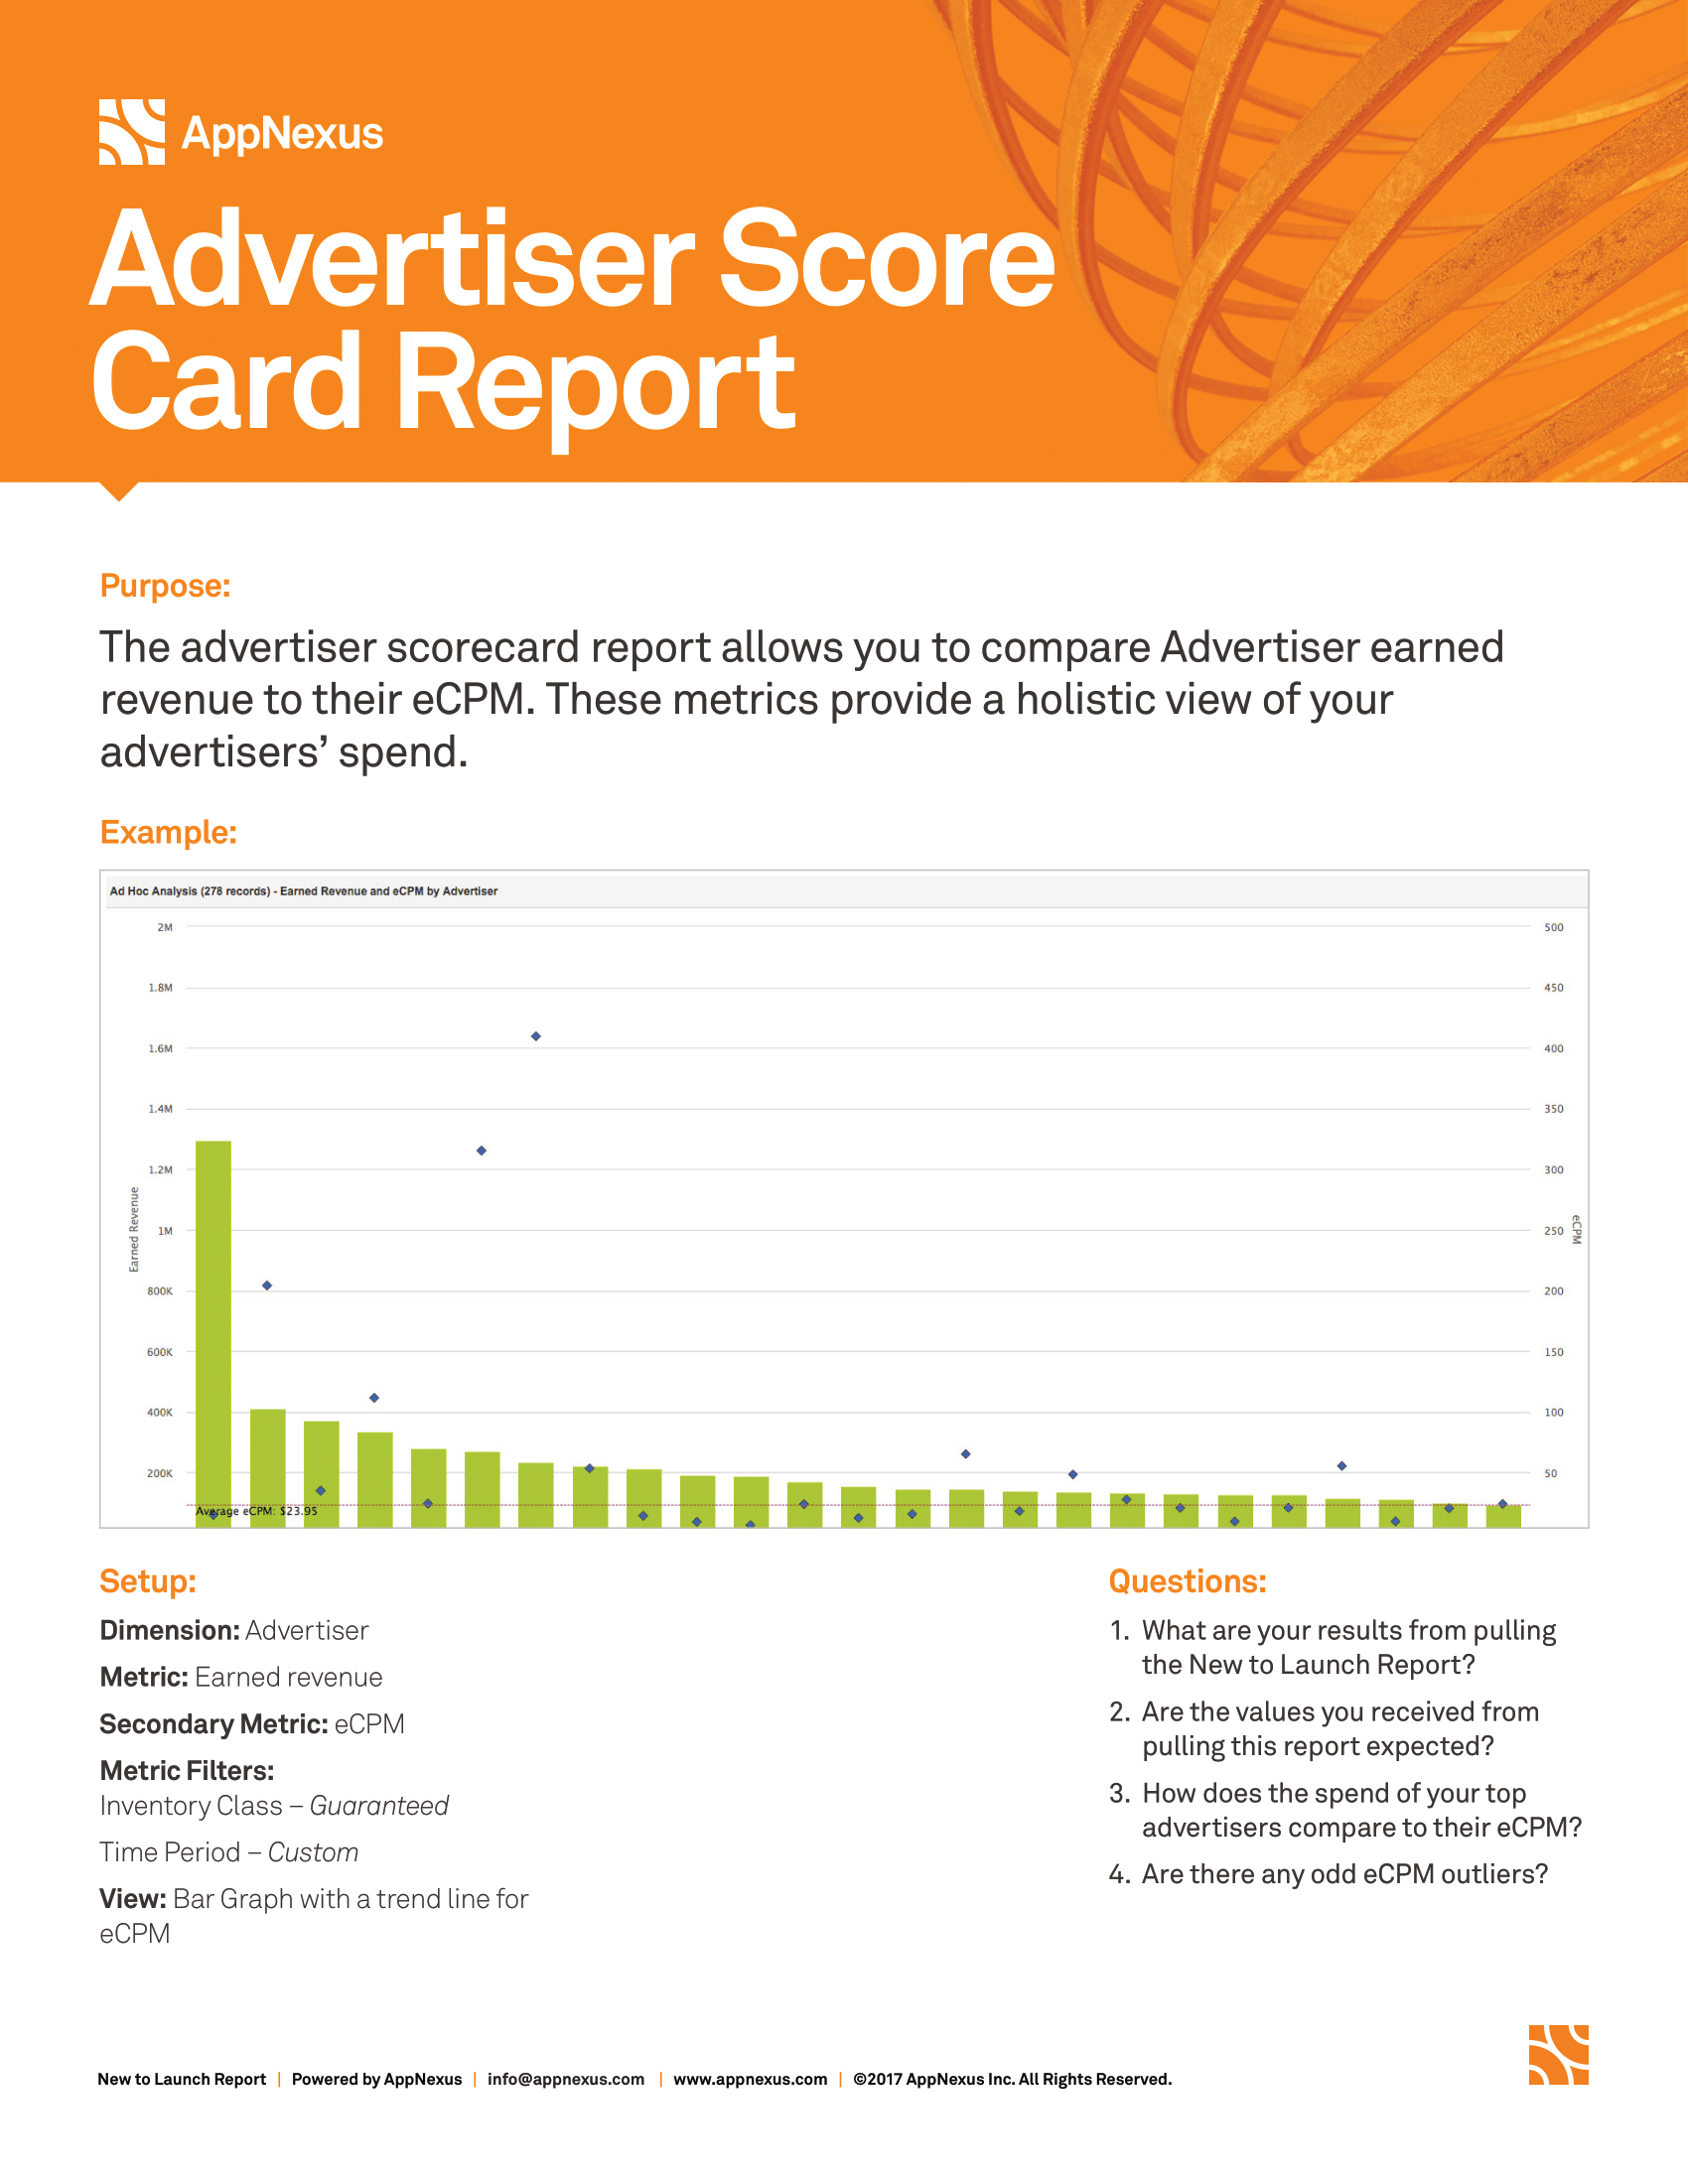
Advertiser Scorecard report
Description
- Dim: Advertiser
- Metric: Earned Revenue
- Sec Metric: eCPM
- Filters: Period – Last Quarter, Inventory Class – Guaranteed
- Trendline: Avg. eCPM
- View: Bar Chart
- Display: 25
- Sort: Primary Metric (Descending)
Note
Ranks Advertisers by Earned Revenue and eCPM. Add a direct target attribute or product filter to make your analysis specific to a kind of targeting (E.g.: Audience or specific site sections).
Pricing Benchmark report
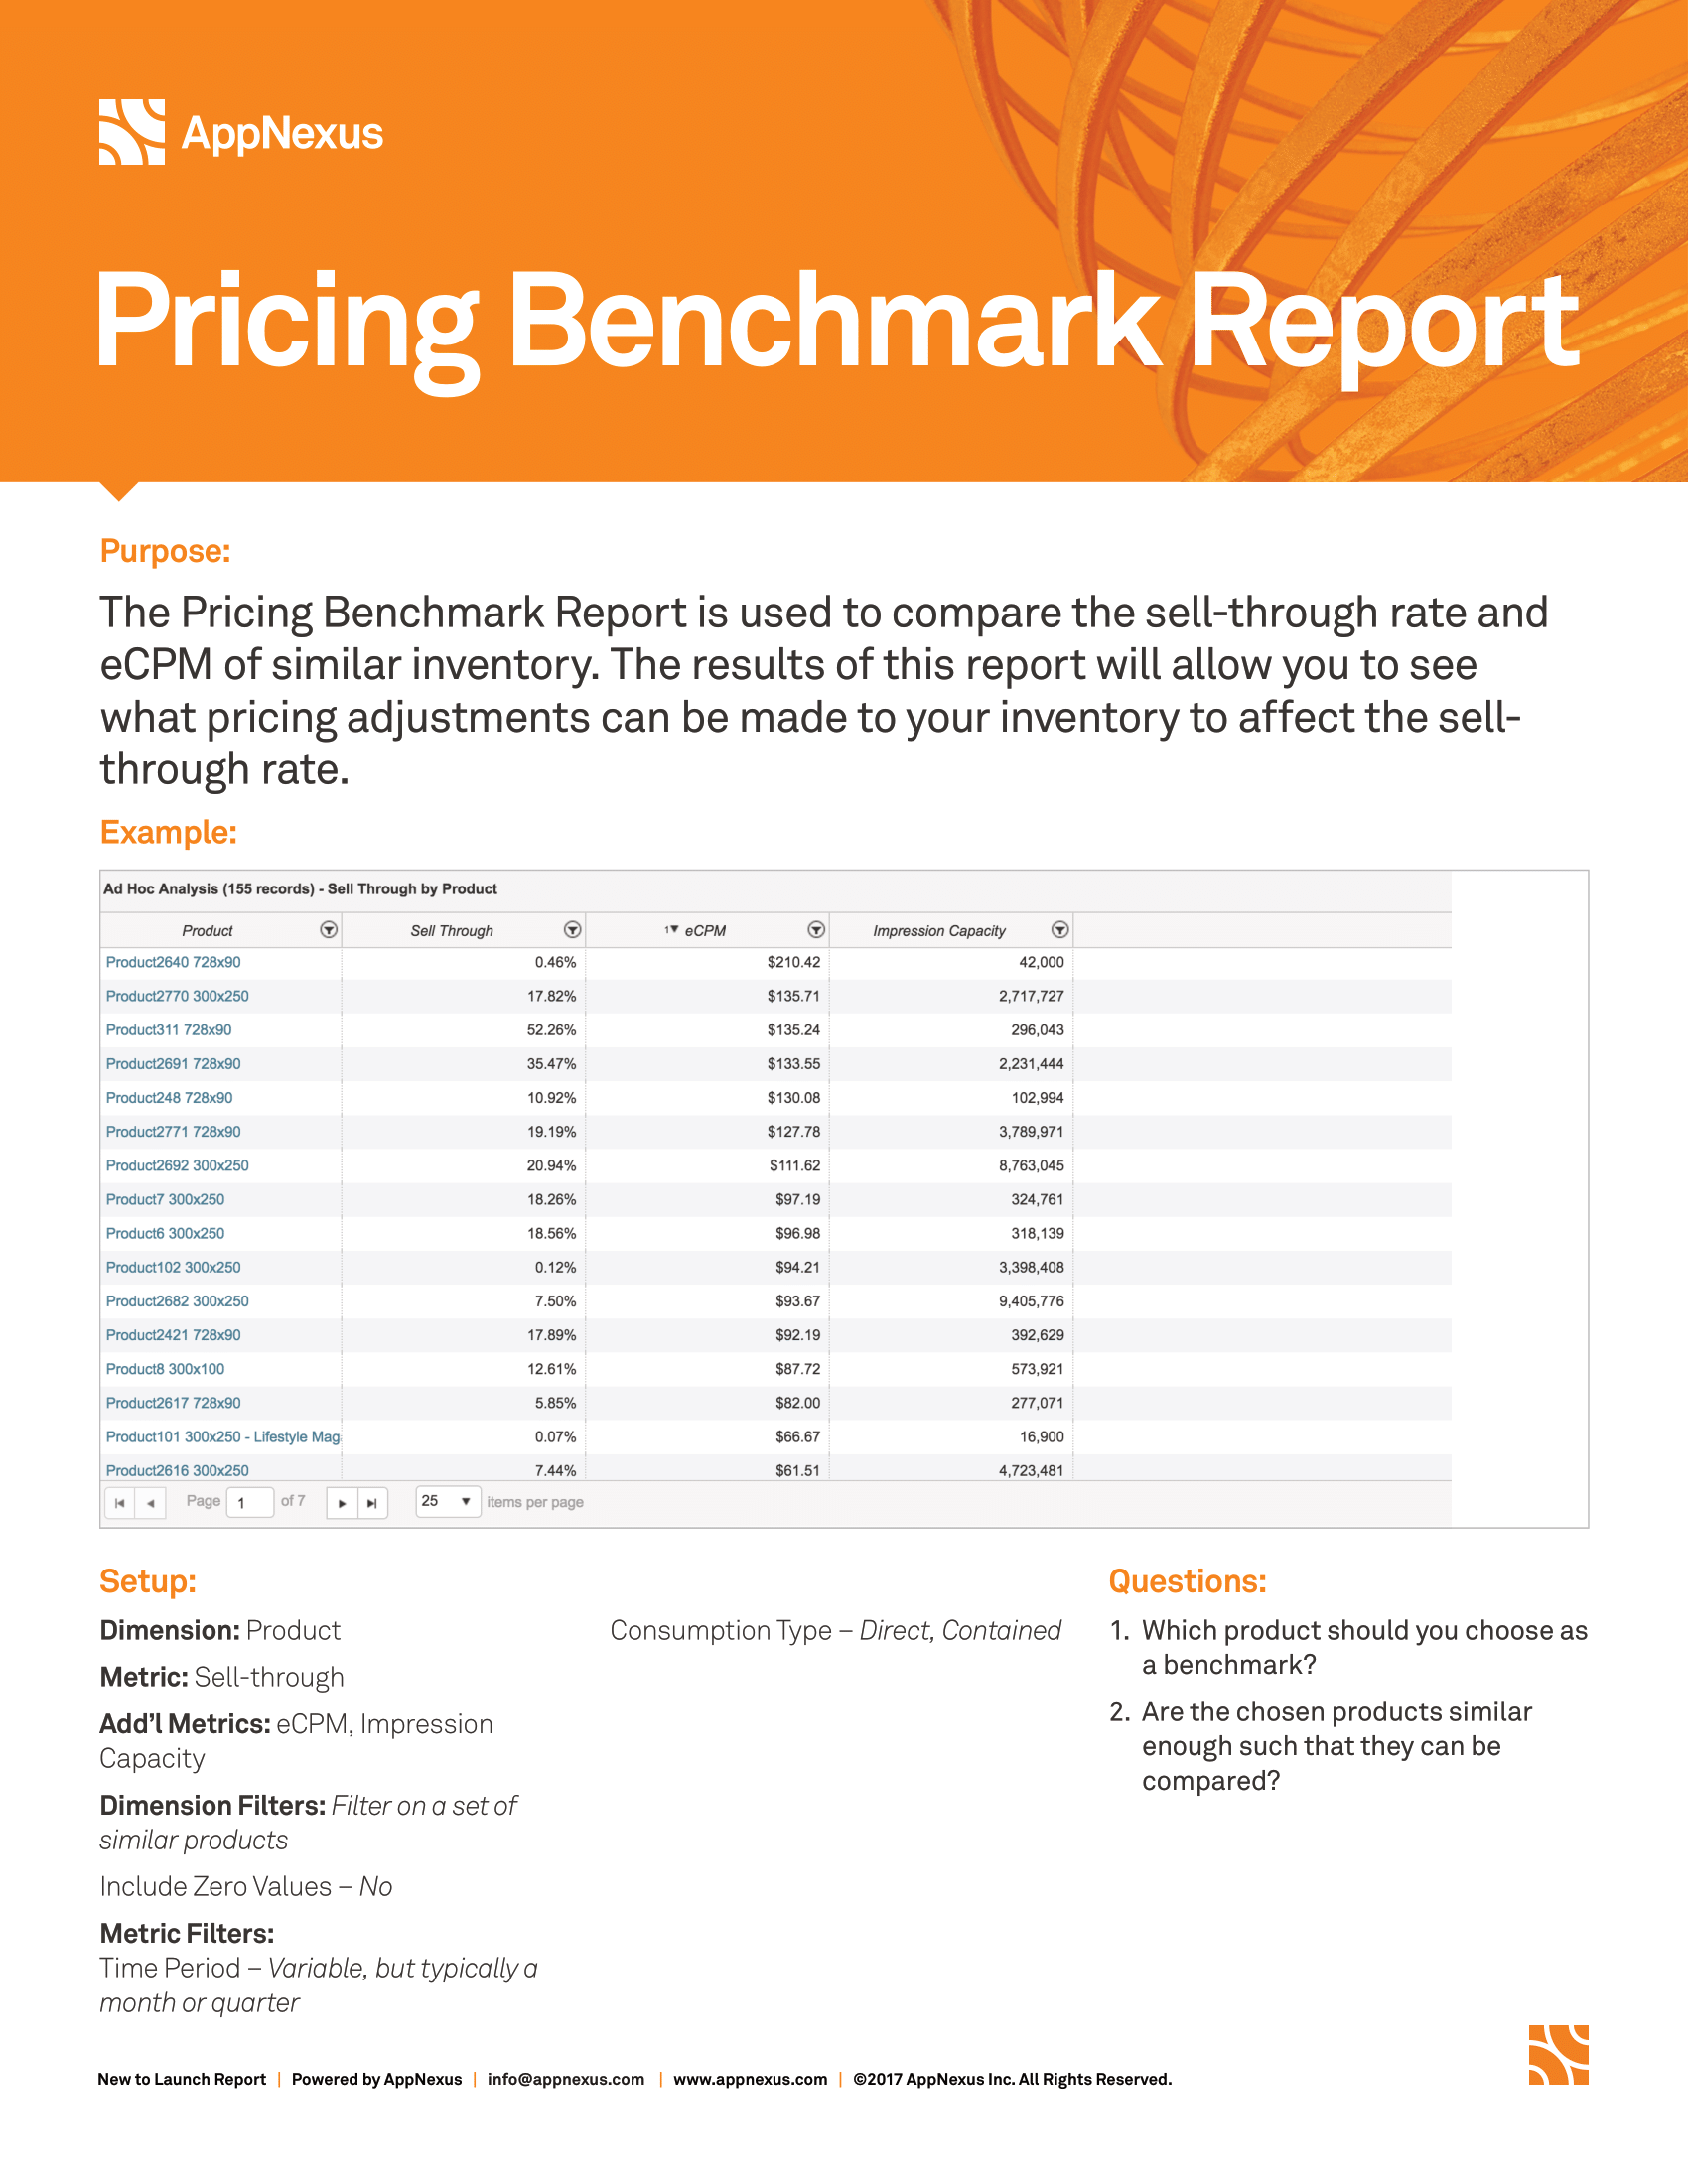
Description
- Dim: Product
- Metric: Sell Through
- Additional Metrics: Impression Capacity, eCPM
- Dim Filters: Product - Exclude Analyzed Network, Product Type – Rate Card
- MetricFilters: Period – This Month, Inventory Class – Guaranteed, Product Type: Rate Card, Product Group: exclude ‘Entire Network’,
- Sort: Sell Through
Note
Displays a product’s sell through rate along with the eCPM and impression capacity. Filter by product groups to make your analysis more specific to a particular set of products.
Accrued Loss by Salesperson report
Description
- Dim: Salesperson
- Metric: Consumption to Schedule (Lifetime)
- Sec Metric: Revenue Against Goal (Lifetime)
- Filters: Period – This Year, Salesperson – exclude (blank), Inventory Class – Guaranteed, Order Line Status – Complete
- View: Bar Chart
- Sort: Secondary Metric (Ascending)
- Display: 25
Note
Ranks Salespeople by Under-delivered Revenue and % Under-delivery. Use this to understand which salespeople sell campaigns that under-deliver.
Pricing Dashboard report
Description
- Dim: Sold as Product
- Metric: Consumed Imps
- Sec Metric: Earned Revenue
- Add’l Metrics: Contracted CPM, eCPM
- Filter: Sold As Product – Exclude ‘N/A’
- Dataset1 – “This Quarter”
- Filter: Period – This Quarter, Inventory Class – Guaranteed
- Dataset2 – “This Quarter”
- Filter: Period – Last Quarter, Inventory Class – Guaranteed
- View: Data Table
- Sort: Last Quarter: Earned Revenue
- Display: 500
Note
Compares the average spend and eCPM by Advertiser for certain products against all other advertisers. Instead of Advertiser, filter by Salesperson or Industry to examine the data in other ways.
STR Decile Data report
Description
- Dim: Target
- Primary Metric: Consumed Impressions
- Group By: Consumption Type
- Order By: Consumption Type Ascending
- Additional Dim: Target Expression
- Addition Metrics: Impression Capacity
- Dim Filters: Product Status – Active
- Metric Filters: Date Range – This Month, Inventory Class – Guaranteed
- Display: 500
Note
Shows how impressions were consumed (Direct, Indirect, Contained) - along with the capacity for all target products. By looking at the STR rate on a more granular level, you can better manage yield for your products.
Unfilled Impressions report
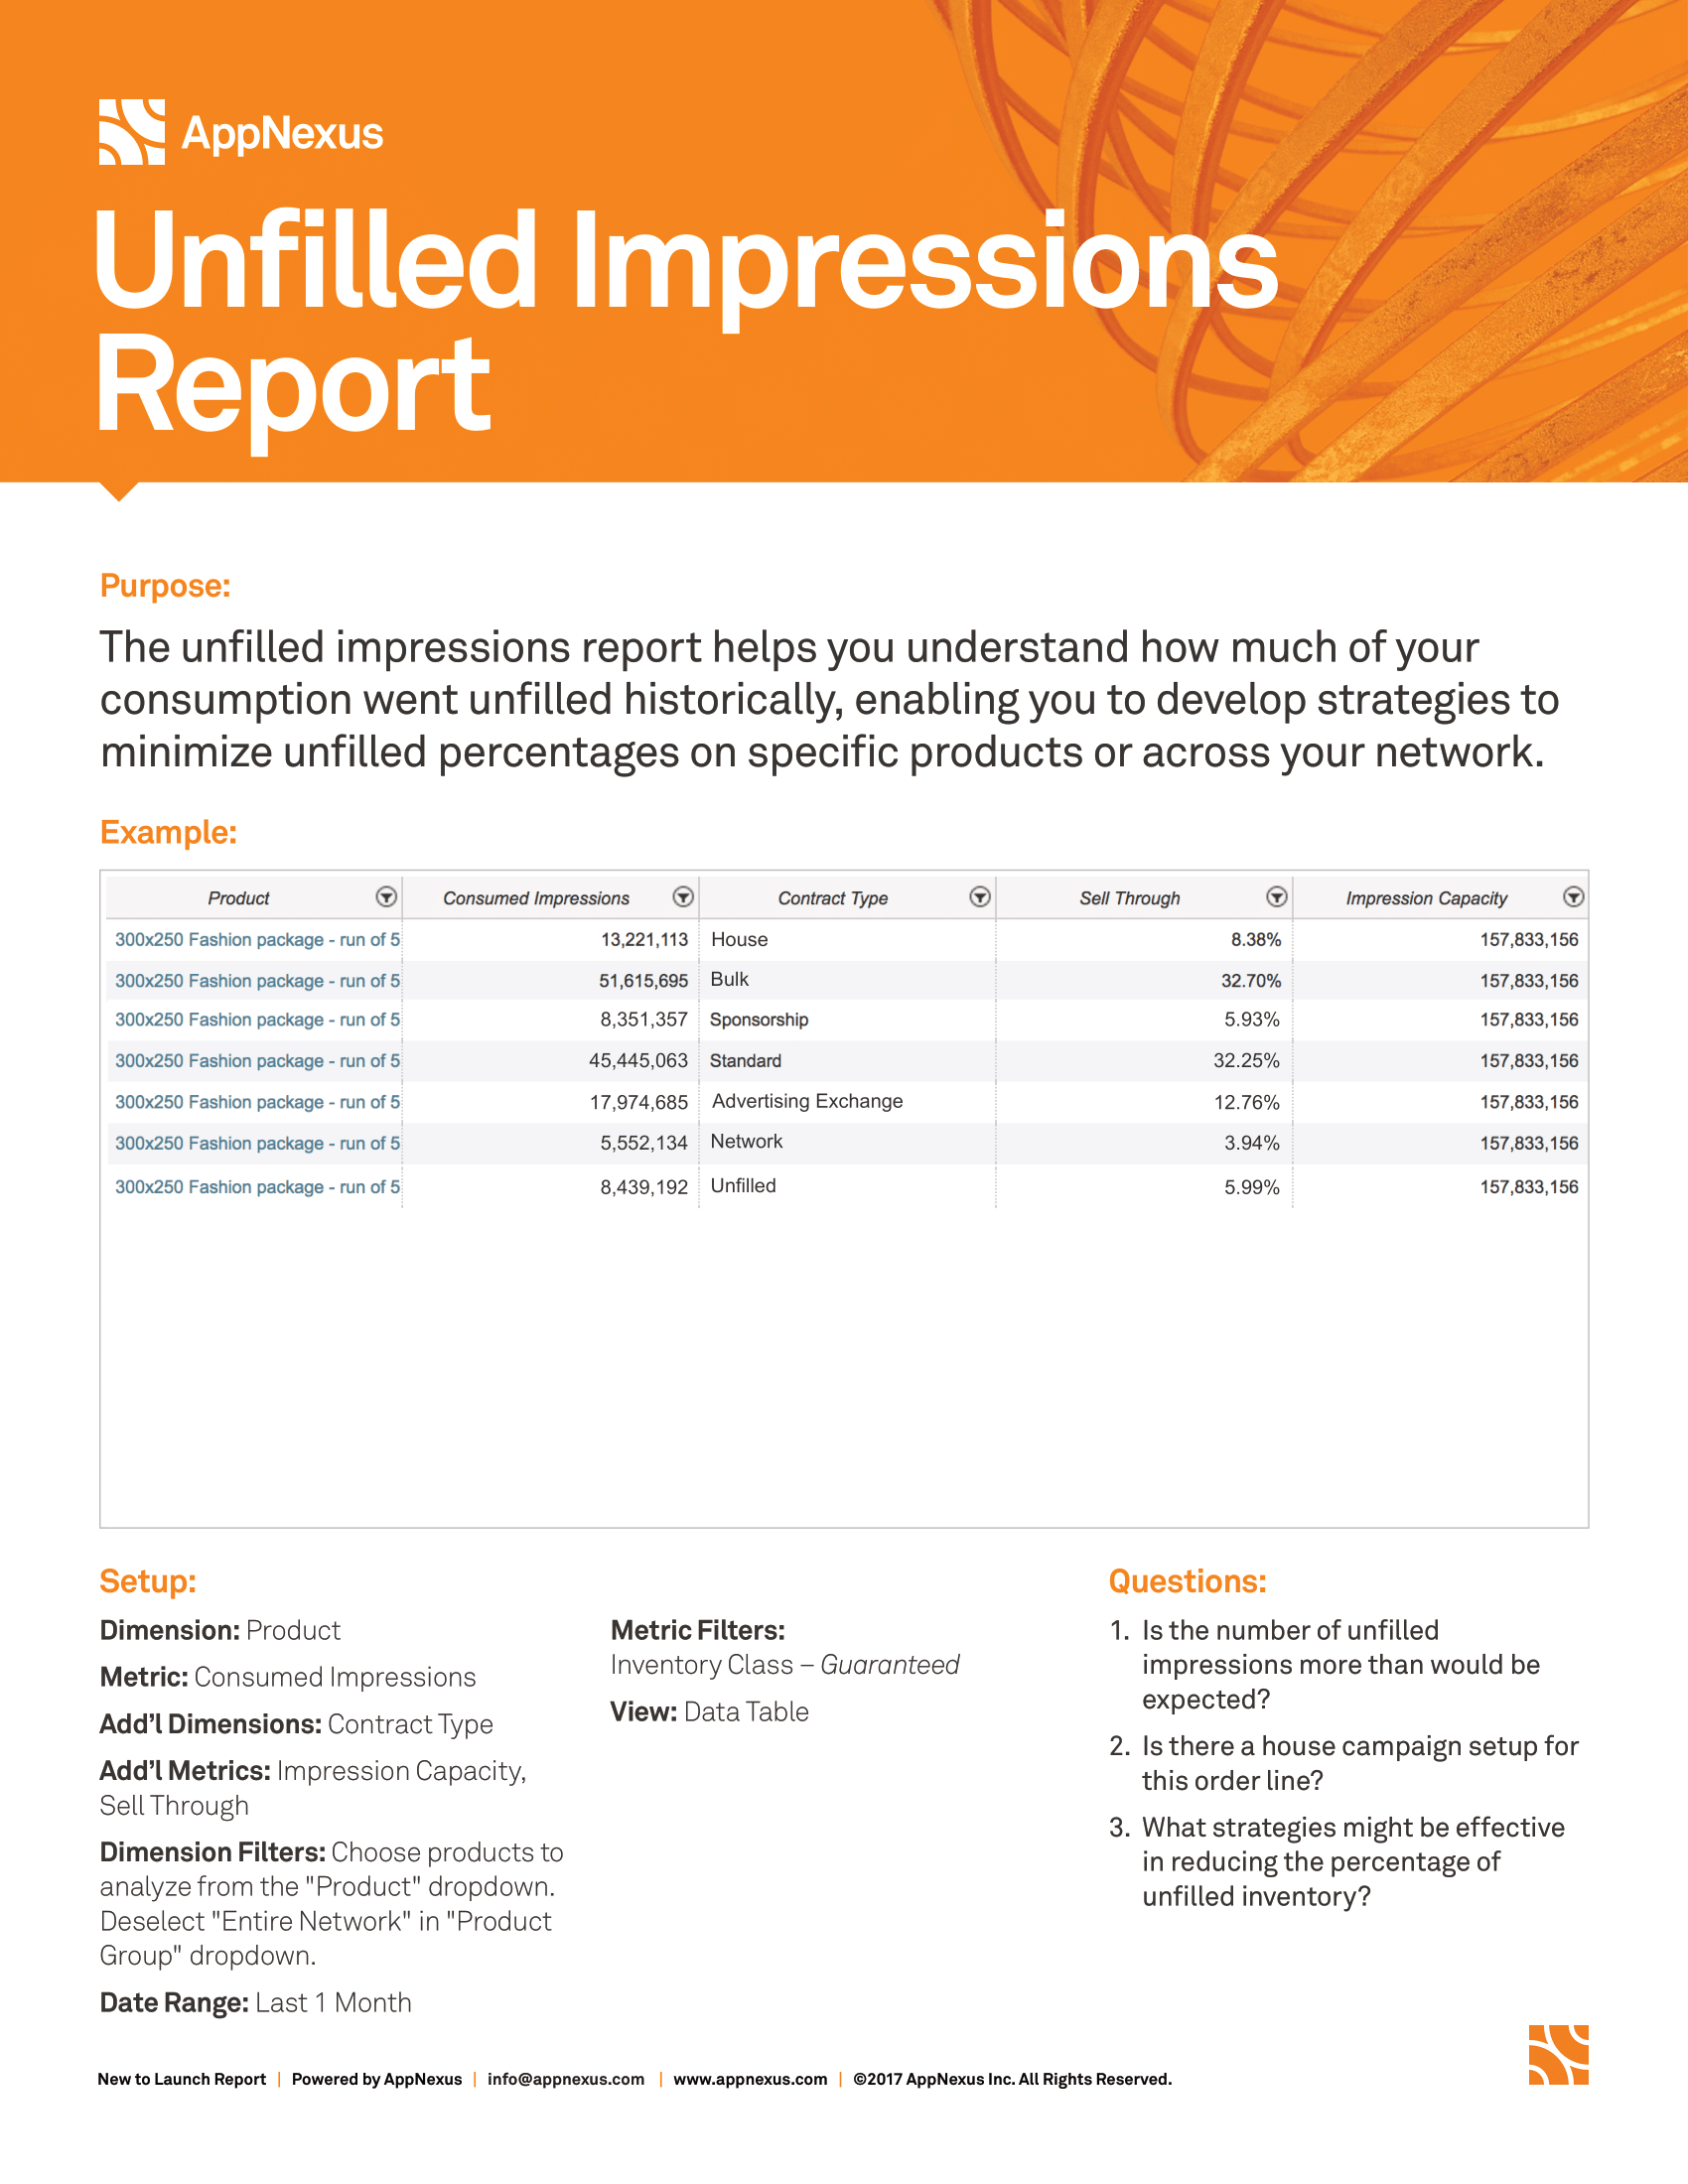
Description
- Dim: Product
- Metric: Sell Through
- Add’l Metric: Impression Capacity, Consumed Impressions
- Dim Filters: Target Attribute – [Include Any – Size – 728x90, 300x250, 300x600, 160x600, 320x50, 300x50, 970x66], Product Type - Reporting
- Metric Filters: Period – Last Month, Advertiser – Unfilled Impressions
- View: Data Table
- Sort: Sell Through (Descending)
- Display: 500
Note
Ranks Products by % of blank ads (unfilled impressions) served. 1 – 2% is a good target benchmark. Anything higher could be a problem Filter to custom or reporting products for more results.
Targeting Premium - Geo report
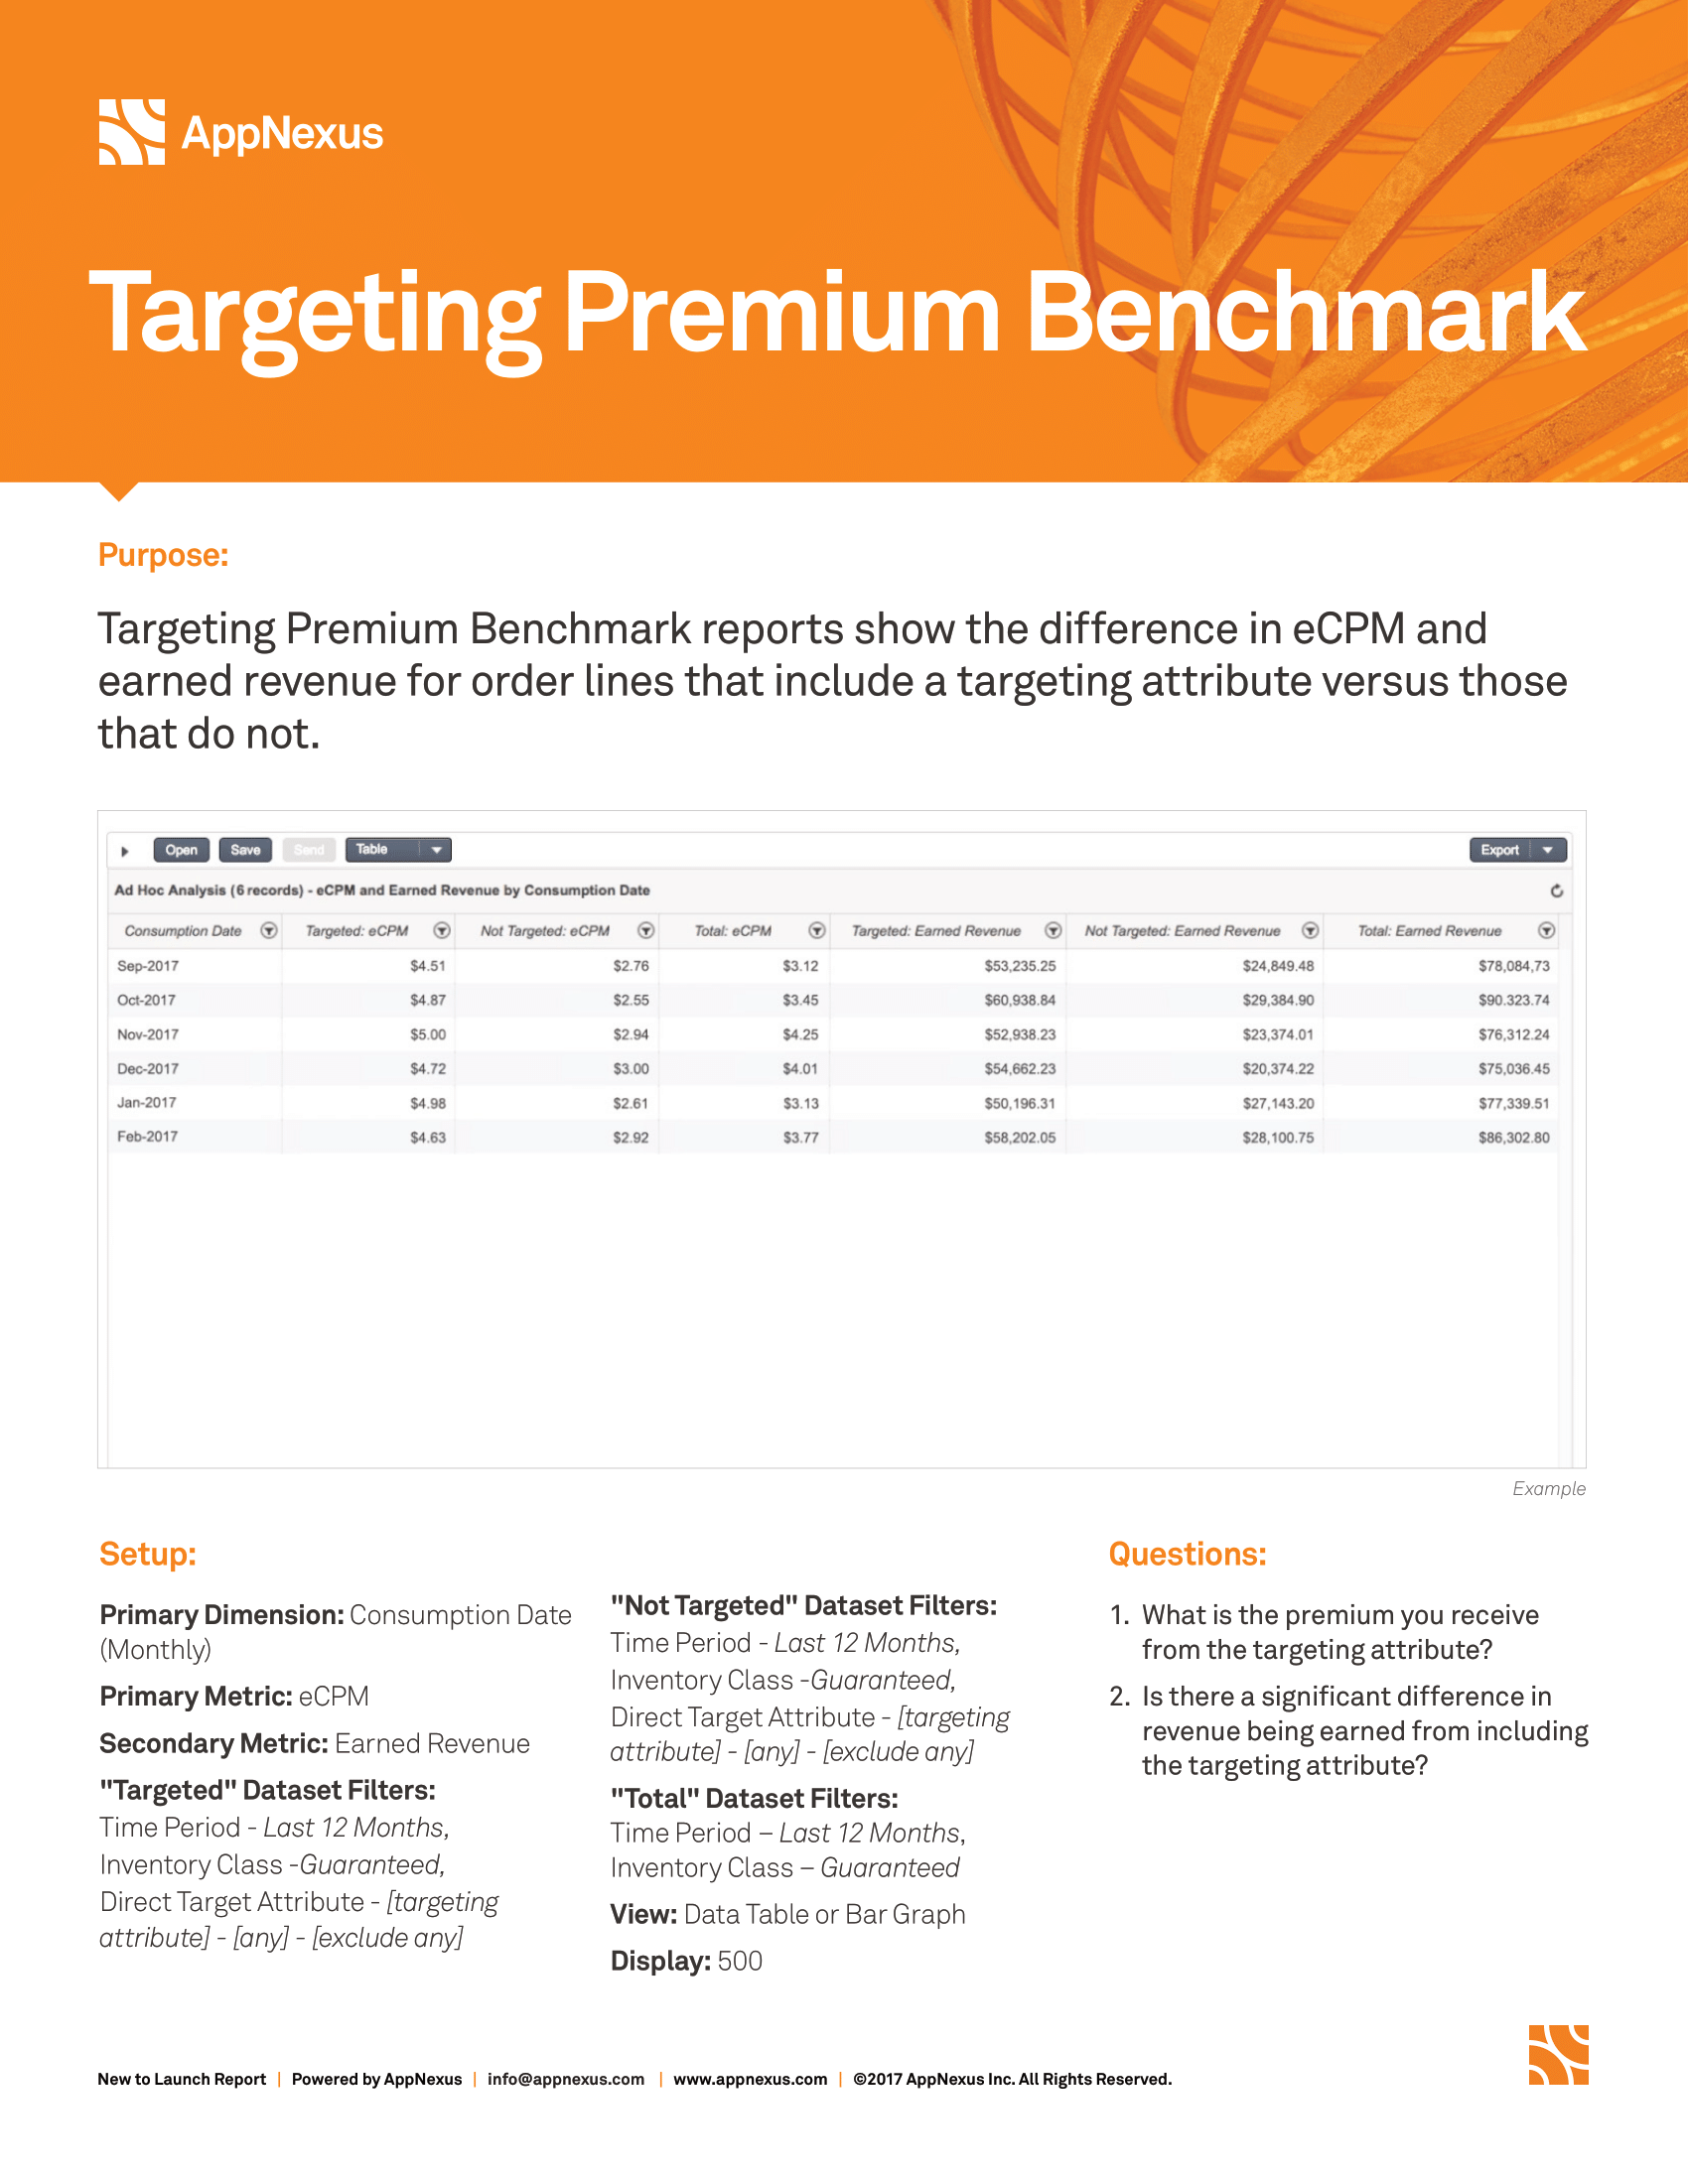
Description
- Dim: Consumption Date (Monthly)
- Metric: eCPM
- Trendline: Avg. eCPM
- Dataset1 – “Targeted"
- Filter: Period – Last 12 Months, Inventory Class – Guaranteed, Direct Target
- Attribute – [dma_region – [any] - include any]
- Dataset2 – “Not Targeted”
- Filter: Period – Last 12 Months, Inventory Class – Guaranteed, Direct Target
- Attribute – [dma_region – [any] - exclude any]
- View: Bar Chart
- Sort: Dimension (Ascending)
- Display: 15
Note
Shows the power of the direct target attribute filter - by displaying the difference in eCPM by Month for order lines that contained geotargeting vs. those that did not. Consider switching the filter to audience variables, platform (mobile v. desktop), or site section variables for other types of analysis.
Recently Launched 3rd Party QA report
Description
- Dim: Order Line
- Add’l Dims: Order Line ID
- Metric: Discrepancy (3rd Party)
- Group By: Consumption Date (Daily)
- Order By: Consumption Date Ascending
- Sort: Total Discrepancy (Ascending)
- Metric Filters: Time Period – This Week, Inventory Class – Guaranteed, Order
- Line Status – Booked, Start Date – Last Week, Third Party – exclude ‘Unknown’, ‘N/A’
- View: Data Table
- Display: 500
Click Performance Template report
Description
- Dim: Product
- Metric: Consumed Impressions
- Sec Metric: Consumed Clicks
- Add’l Metric: CTR %
- Sort: CTR %
- Metric Filters: Time Period – This Month, Inventory Class – Guaranteed,
- View: Data Table
- Display: 500
Note
Shows every product with their click-thru rate. This is valuable for any CPC campaign, or trying to optimize campaigns from low-CTR% to high-CTR% products.
Channel Performance Historical report (only for clients with SSP intergrations)
Description
- Dim: Consumption Date (Monthly)
- Metric: Channel eCPM
- Group By: Channel
- Order By: Channel Ascending
- Add’l Metric: Earned Revenue (SSP), eCPM (SSP)
- Sort: Earned Revenue
- Date Range: Last 3 Months
Note
Compares the overall eCPM across various SSPs within a certain period of time. Add Product to Additional Dimension to see eCPM by product.
Viewability report (only for clients with Active View integrations)
Description
- Dim: Product
- Metric: Viewable Capacity
- Secondary Metric: Impression Capacity
- Add’l Metric: Consumed Viewable Impressions, Consumed Impressions
- Dim Filter: Exclude Entire Network
- Date Range: This Month
Note
Compares viewable (Capacity & Consumed) impressions to standard impressions by product.
Data Entry Error report
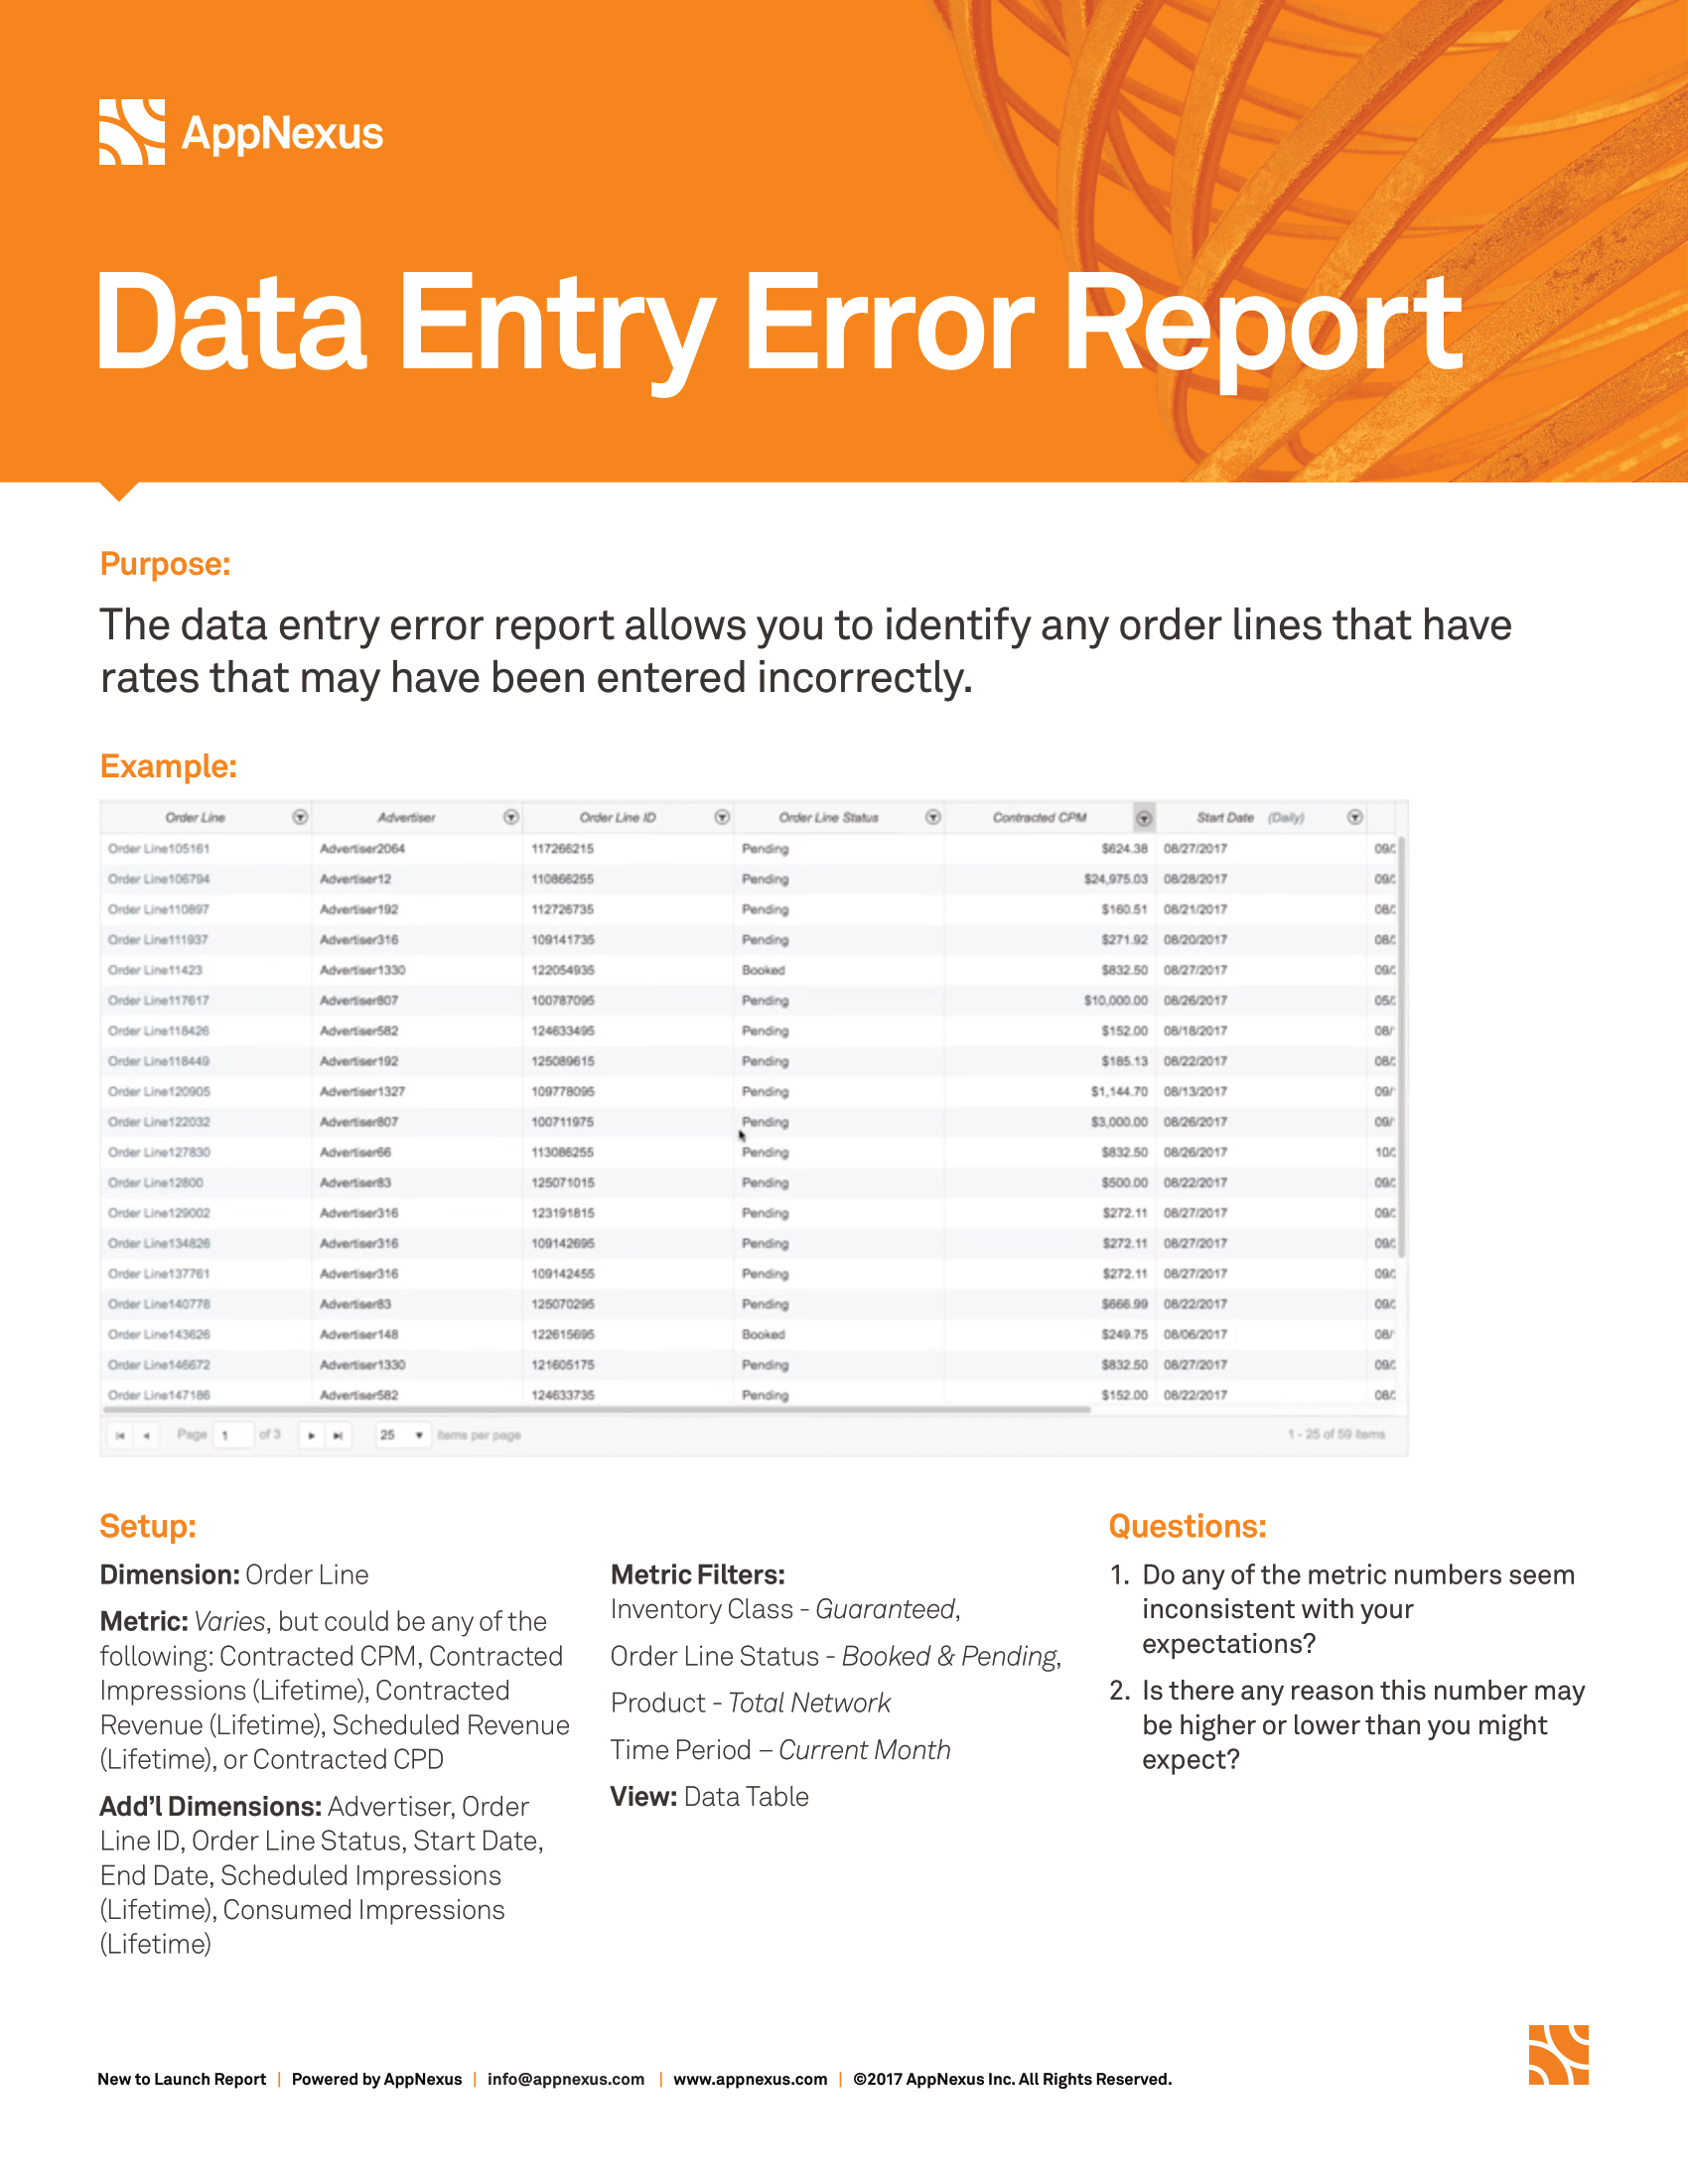
Description
- Dim: Order Line
- Primary Metric: Contracted CPM
- Secondary Metric: Contracted Impressions (Lifetime)
- Add’l Dims: Order, Order Line Status, Advertiser, Start Date, End Date
- Add’l Metrics: Contracted Revenue (Lifetime), Scheduled Revenue (Lifetime), Consumed Clicks, CTR%, Contracted CPD
- Metric Filters: Time Period – This Month, Inventory Class – Guaranteed,
- View: Data Table
- Display: 500
- Sort: Contracted Revenue (Lifetime) Descending
Note
This report is pulling all line items. Use Contracted CPM & CPD Metric Slider to establish proper thresholds. Evaluate if any of the line items: Contracted revenue, contracted impressions, or contracted CPM - is too high or too low.
Campaign Forecast report
Description
- Dim: Order Line
- Metric: Consumed Impressions
- Add’l Dims: Advertiser, Salesperson, Order, Order ID, Order Line ID, Order Line Status, Start Date, End Date
- Add’l Metrics: CTR%, Consumed Clicks, C:S, C:S (Lifetime), Pacing, Pacing (Lifetime), Revenue Against Goal, Revenue Against Goal (Lifetime)
- Sort: Advertiser (Ascending)
- Metric Filters: Time Period – This Month, Inventory Class – Guaranteed, Order Line Status – Booked, Pending
- View: Data Table
- Display: 500
Note
The campaign forecast report is to keep tabs on how your campaigns are performing, as well as how they are forecasted to deliver over their lifetime.
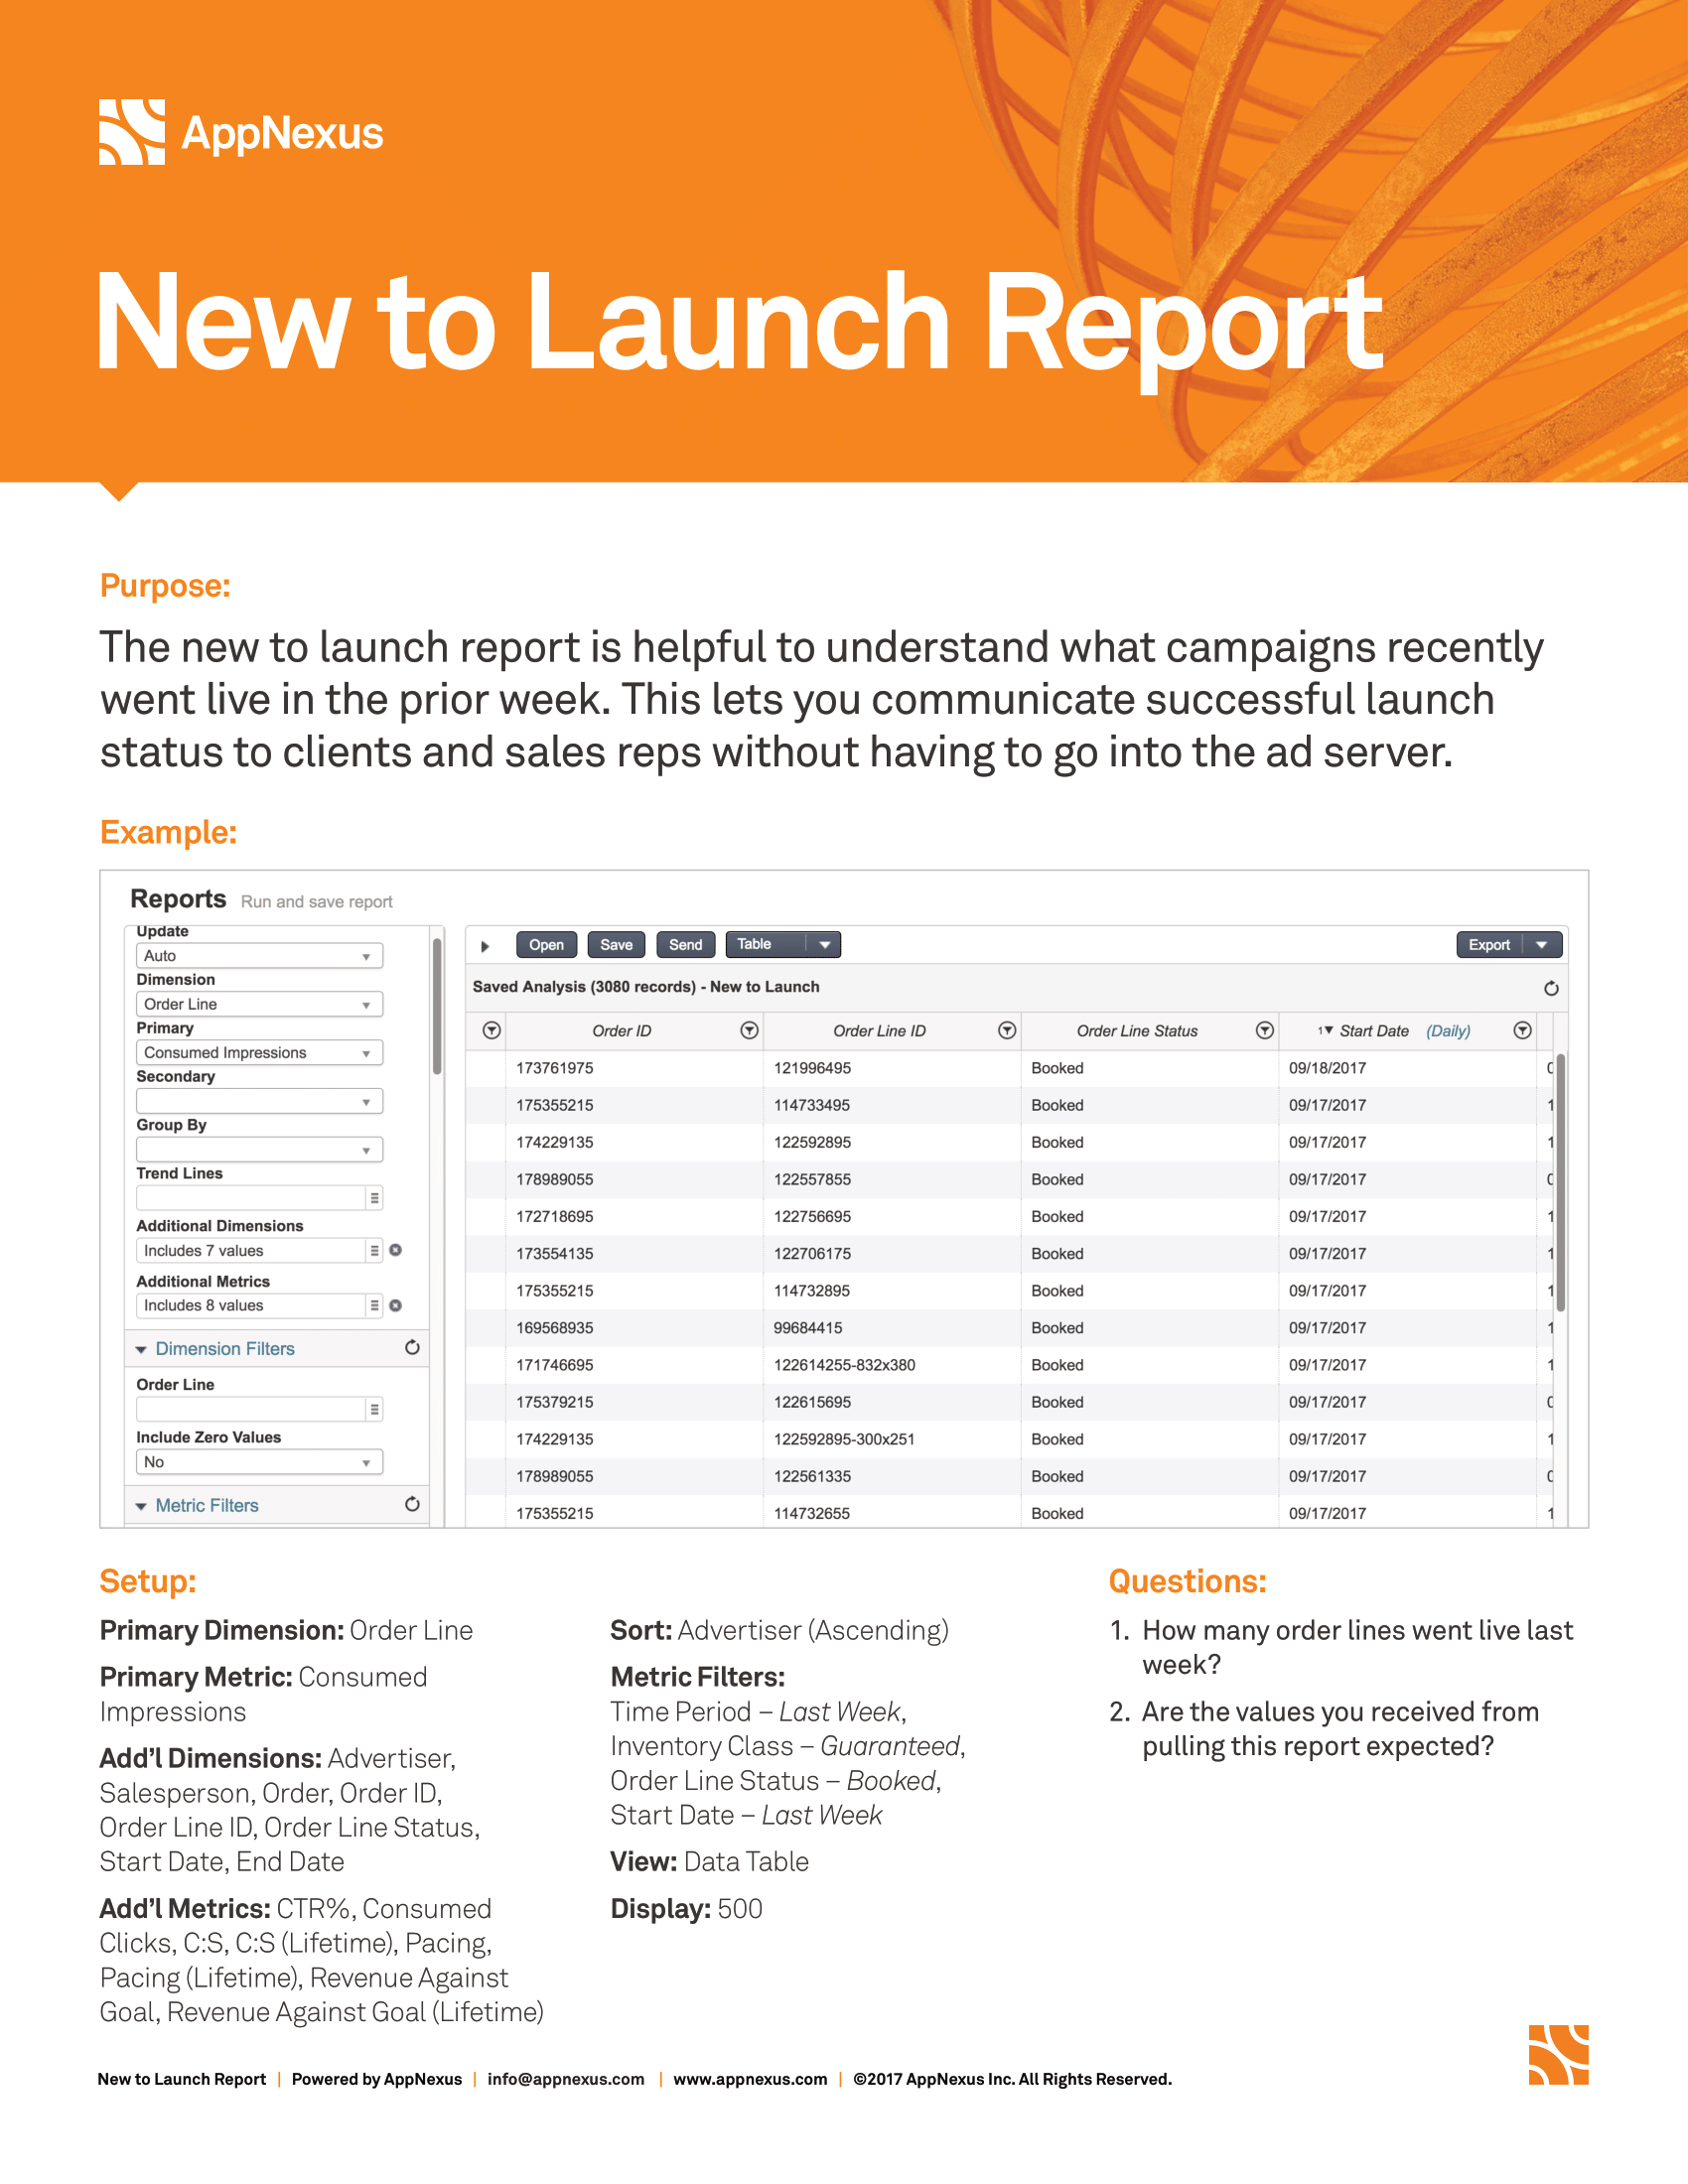
New to Launch report
Description
- Dim: Order Line
- Metric: Consumed Impressions
- Add’l Dims: Advertiser, Salesperson, Order, Order ID, Order Line ID, Order Line Status, Start Date, End Date
- Add’l Metrics: CTR%, Consumed Clicks, C:S, C:S (Lifetime), Pacing, Pacing (Lifetime), Revenue Against Goal, Revenue Against Goal (Lifetime)
- Sort: Advertiser (Ascending)
- Metric Filters: Time Period – Last Week, Inventory Class – Guaranteed,Order Line Status – Booked, Start Date – Last Week
- View: Data Table
- Display: 500
Note
The new to launch report is helpful to understand what campaigns recently went live in the prior week. This lets you communicate launch status to clients and sales reps without having to go into the ad server.
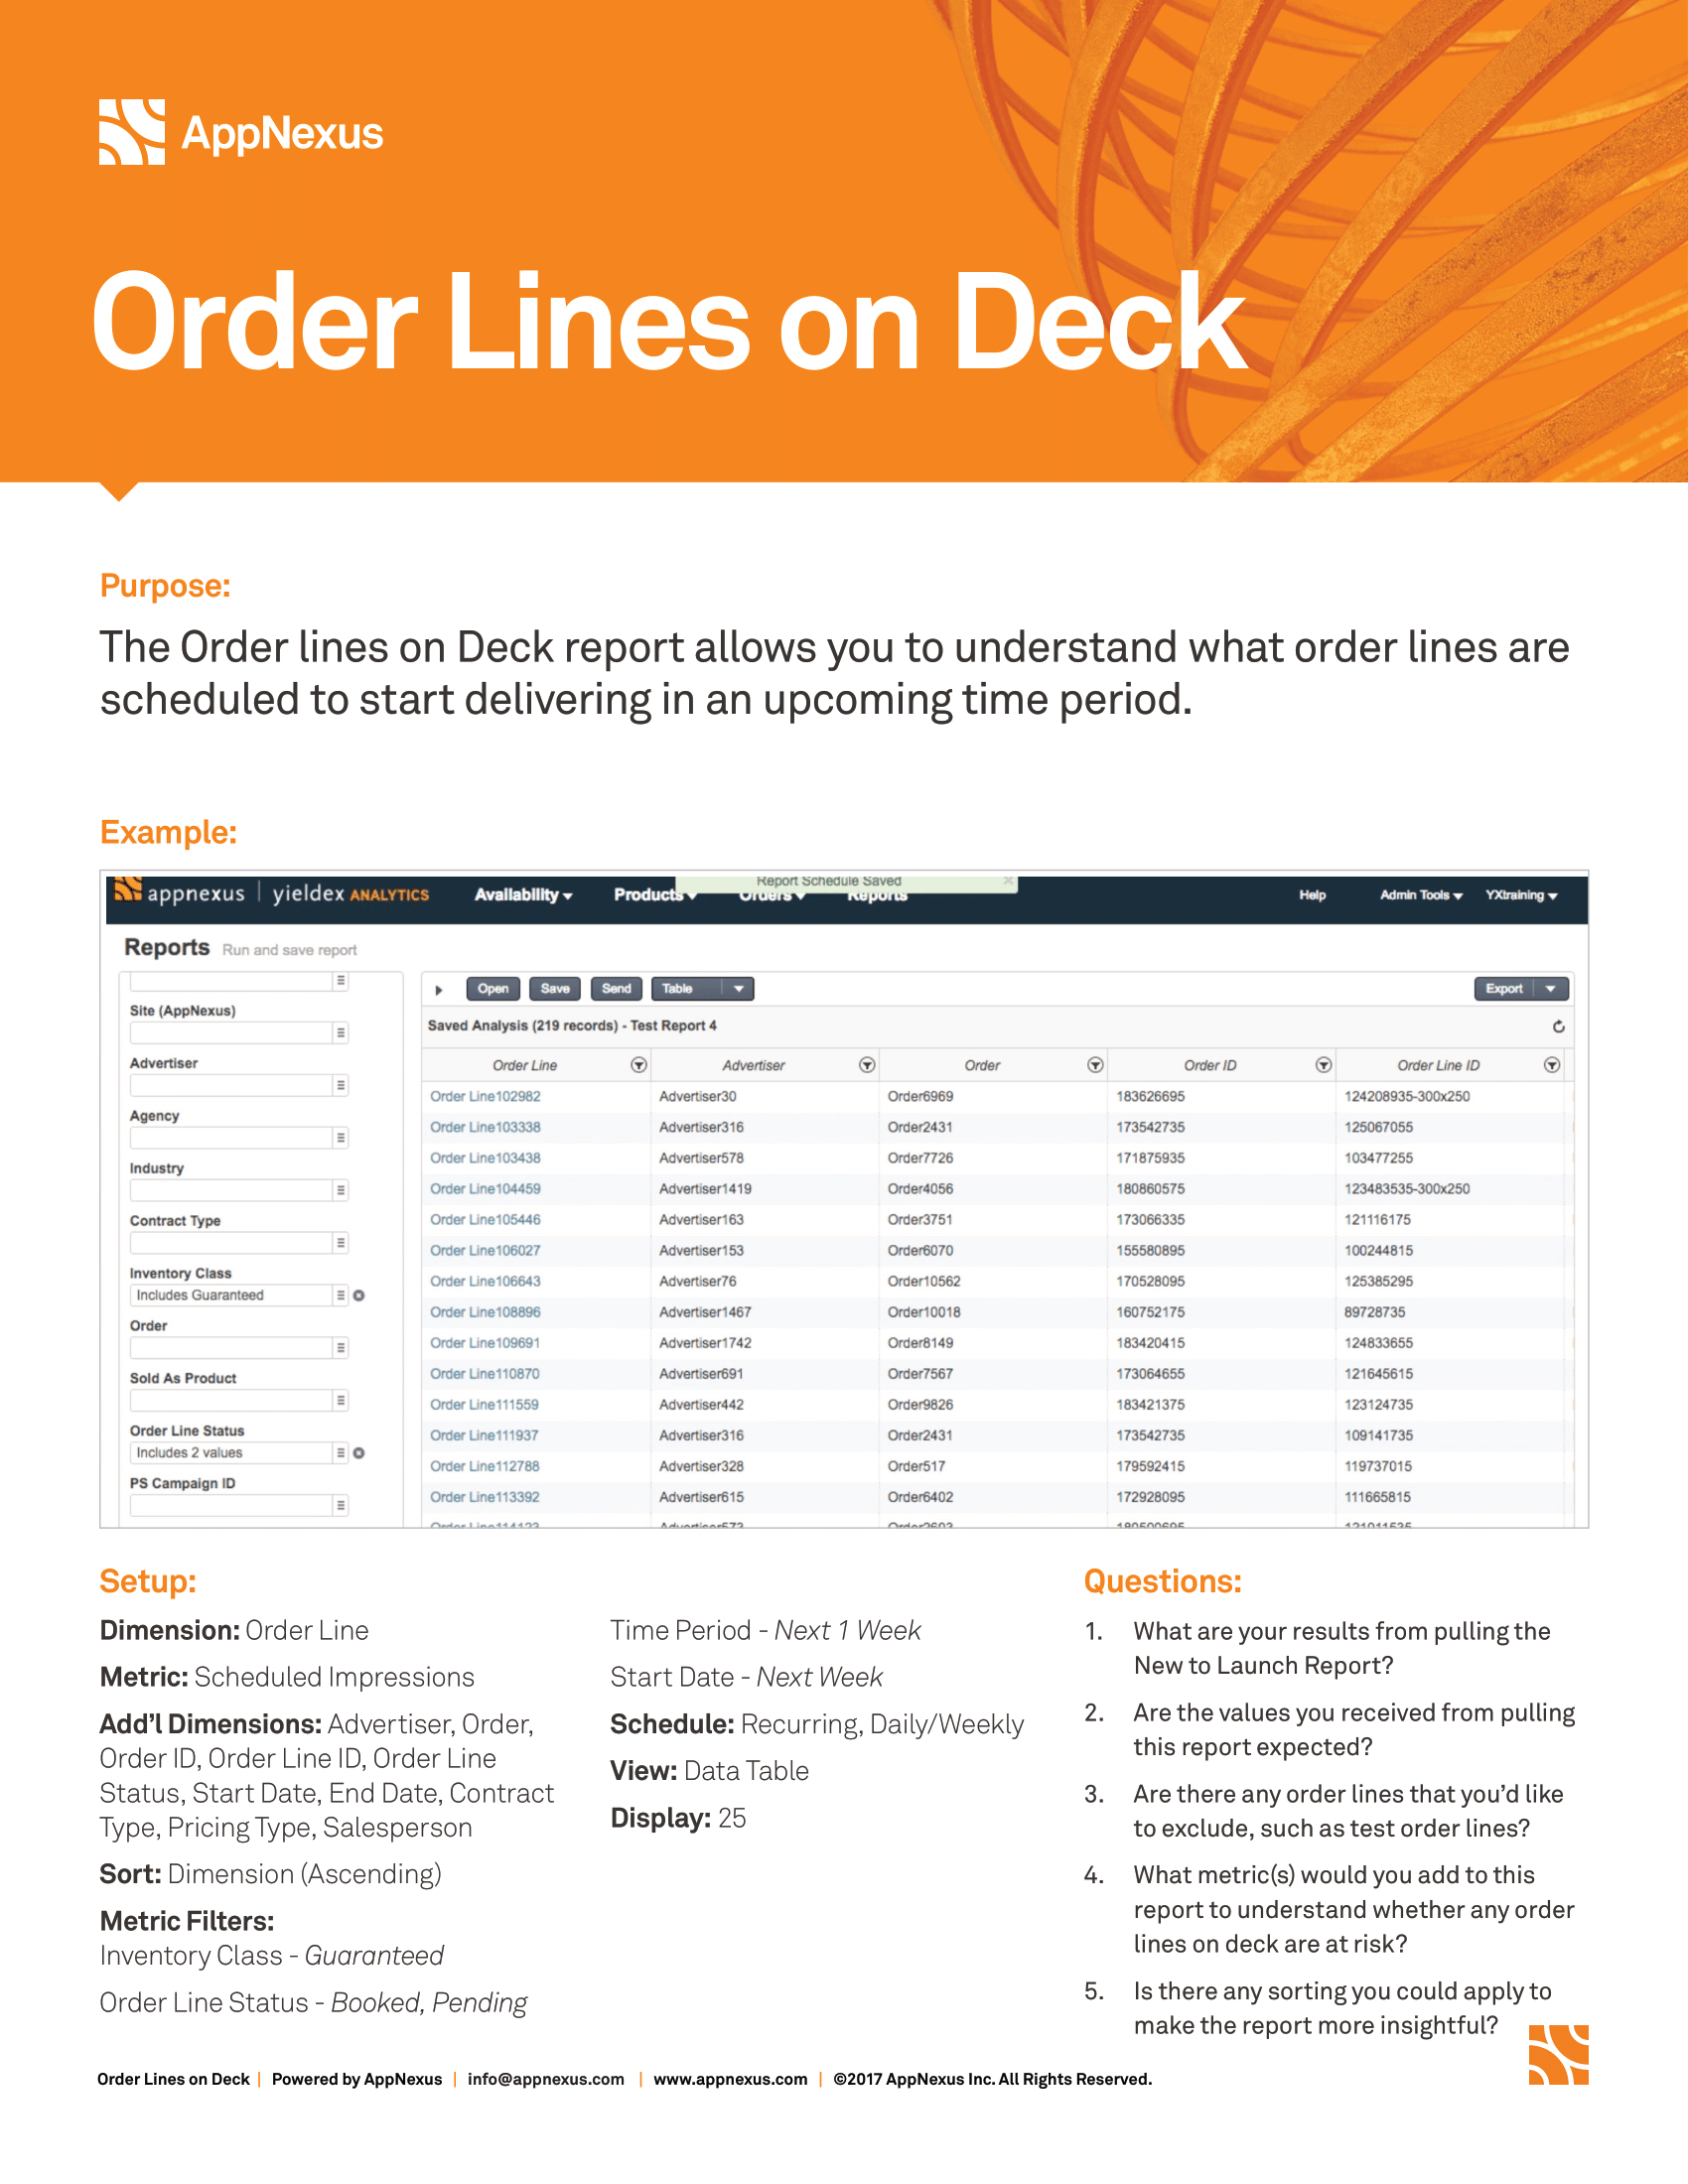
Order Lines on Deck report
Description
- Dim: Order Line
- Metric: Scheduled Impressions
- Add’l Dims: Advertiser, Salesperson, Order, Order ID, Order Line ID, Order Line Status, Start Date, End Date
- Metric Filters: Time Period – Next Week, Inventory Class – Guaranteed, Order Line Status – Booked, Pending, Start Date – Next Week
- View: Data Table
- Display: 500
Note
The on deck report is useful to understand what campaigns are setup and scheduled to start delivering in the upcoming week. This is especially useful for tracking roadblocks or sponsorships that have critical timing.
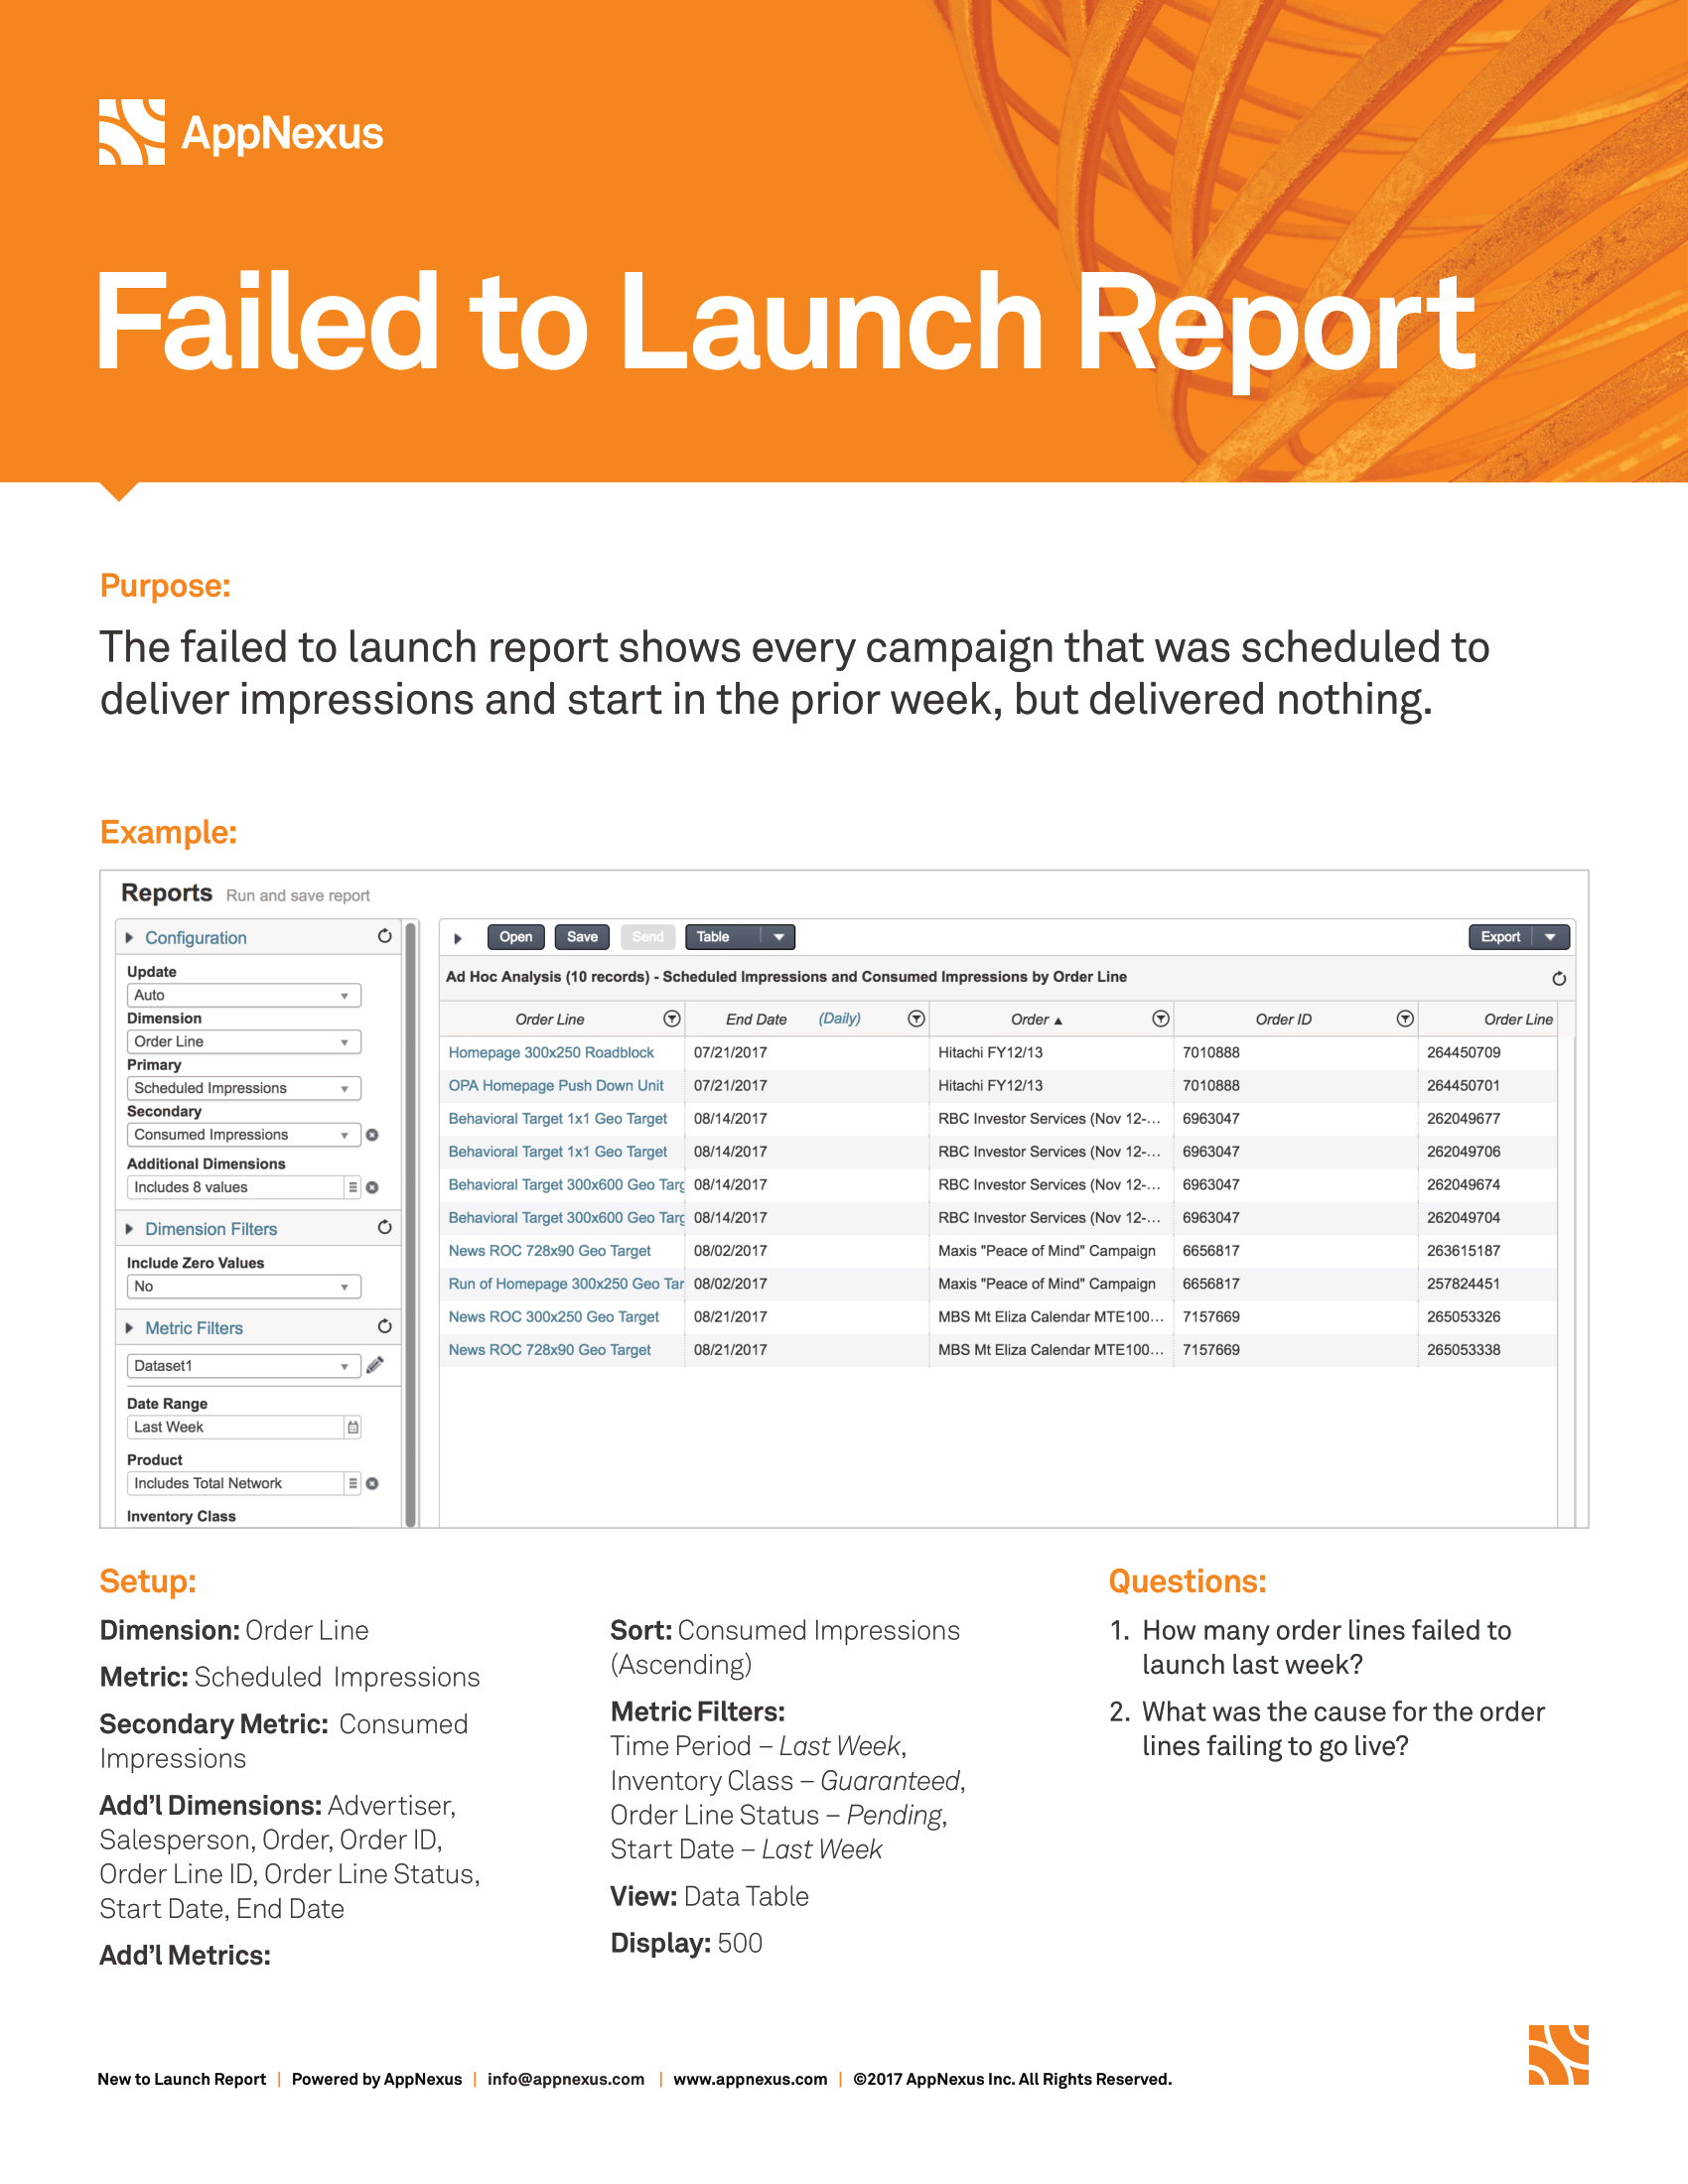
Failed to Launch report
Description
- Dim: Order Line
- Metric: Scheduled Impressions
- Sec Metric: Consumed Impressions
- Add’l Dims: Advertiser, Salesperson, Order, Order ID, Order Line ID, Order Line Status, Start Date, End Date
- Sort: Consumed Impressions (Ascending)
- Metric Filters: Time Period – Last Week, Inventory Class – Guaranteed, Order Line Status – Booked, Pending, Start Date – Last Week
- View: Data Table
- Display: 500
Shows every campaign that was scheduled to deliver impressions and start in the prior week, but delivered nothing. Sort the consumed impressions column - from lowest to highest values. Look at order lines that had some amount of scheduled impressions, but no delivery.
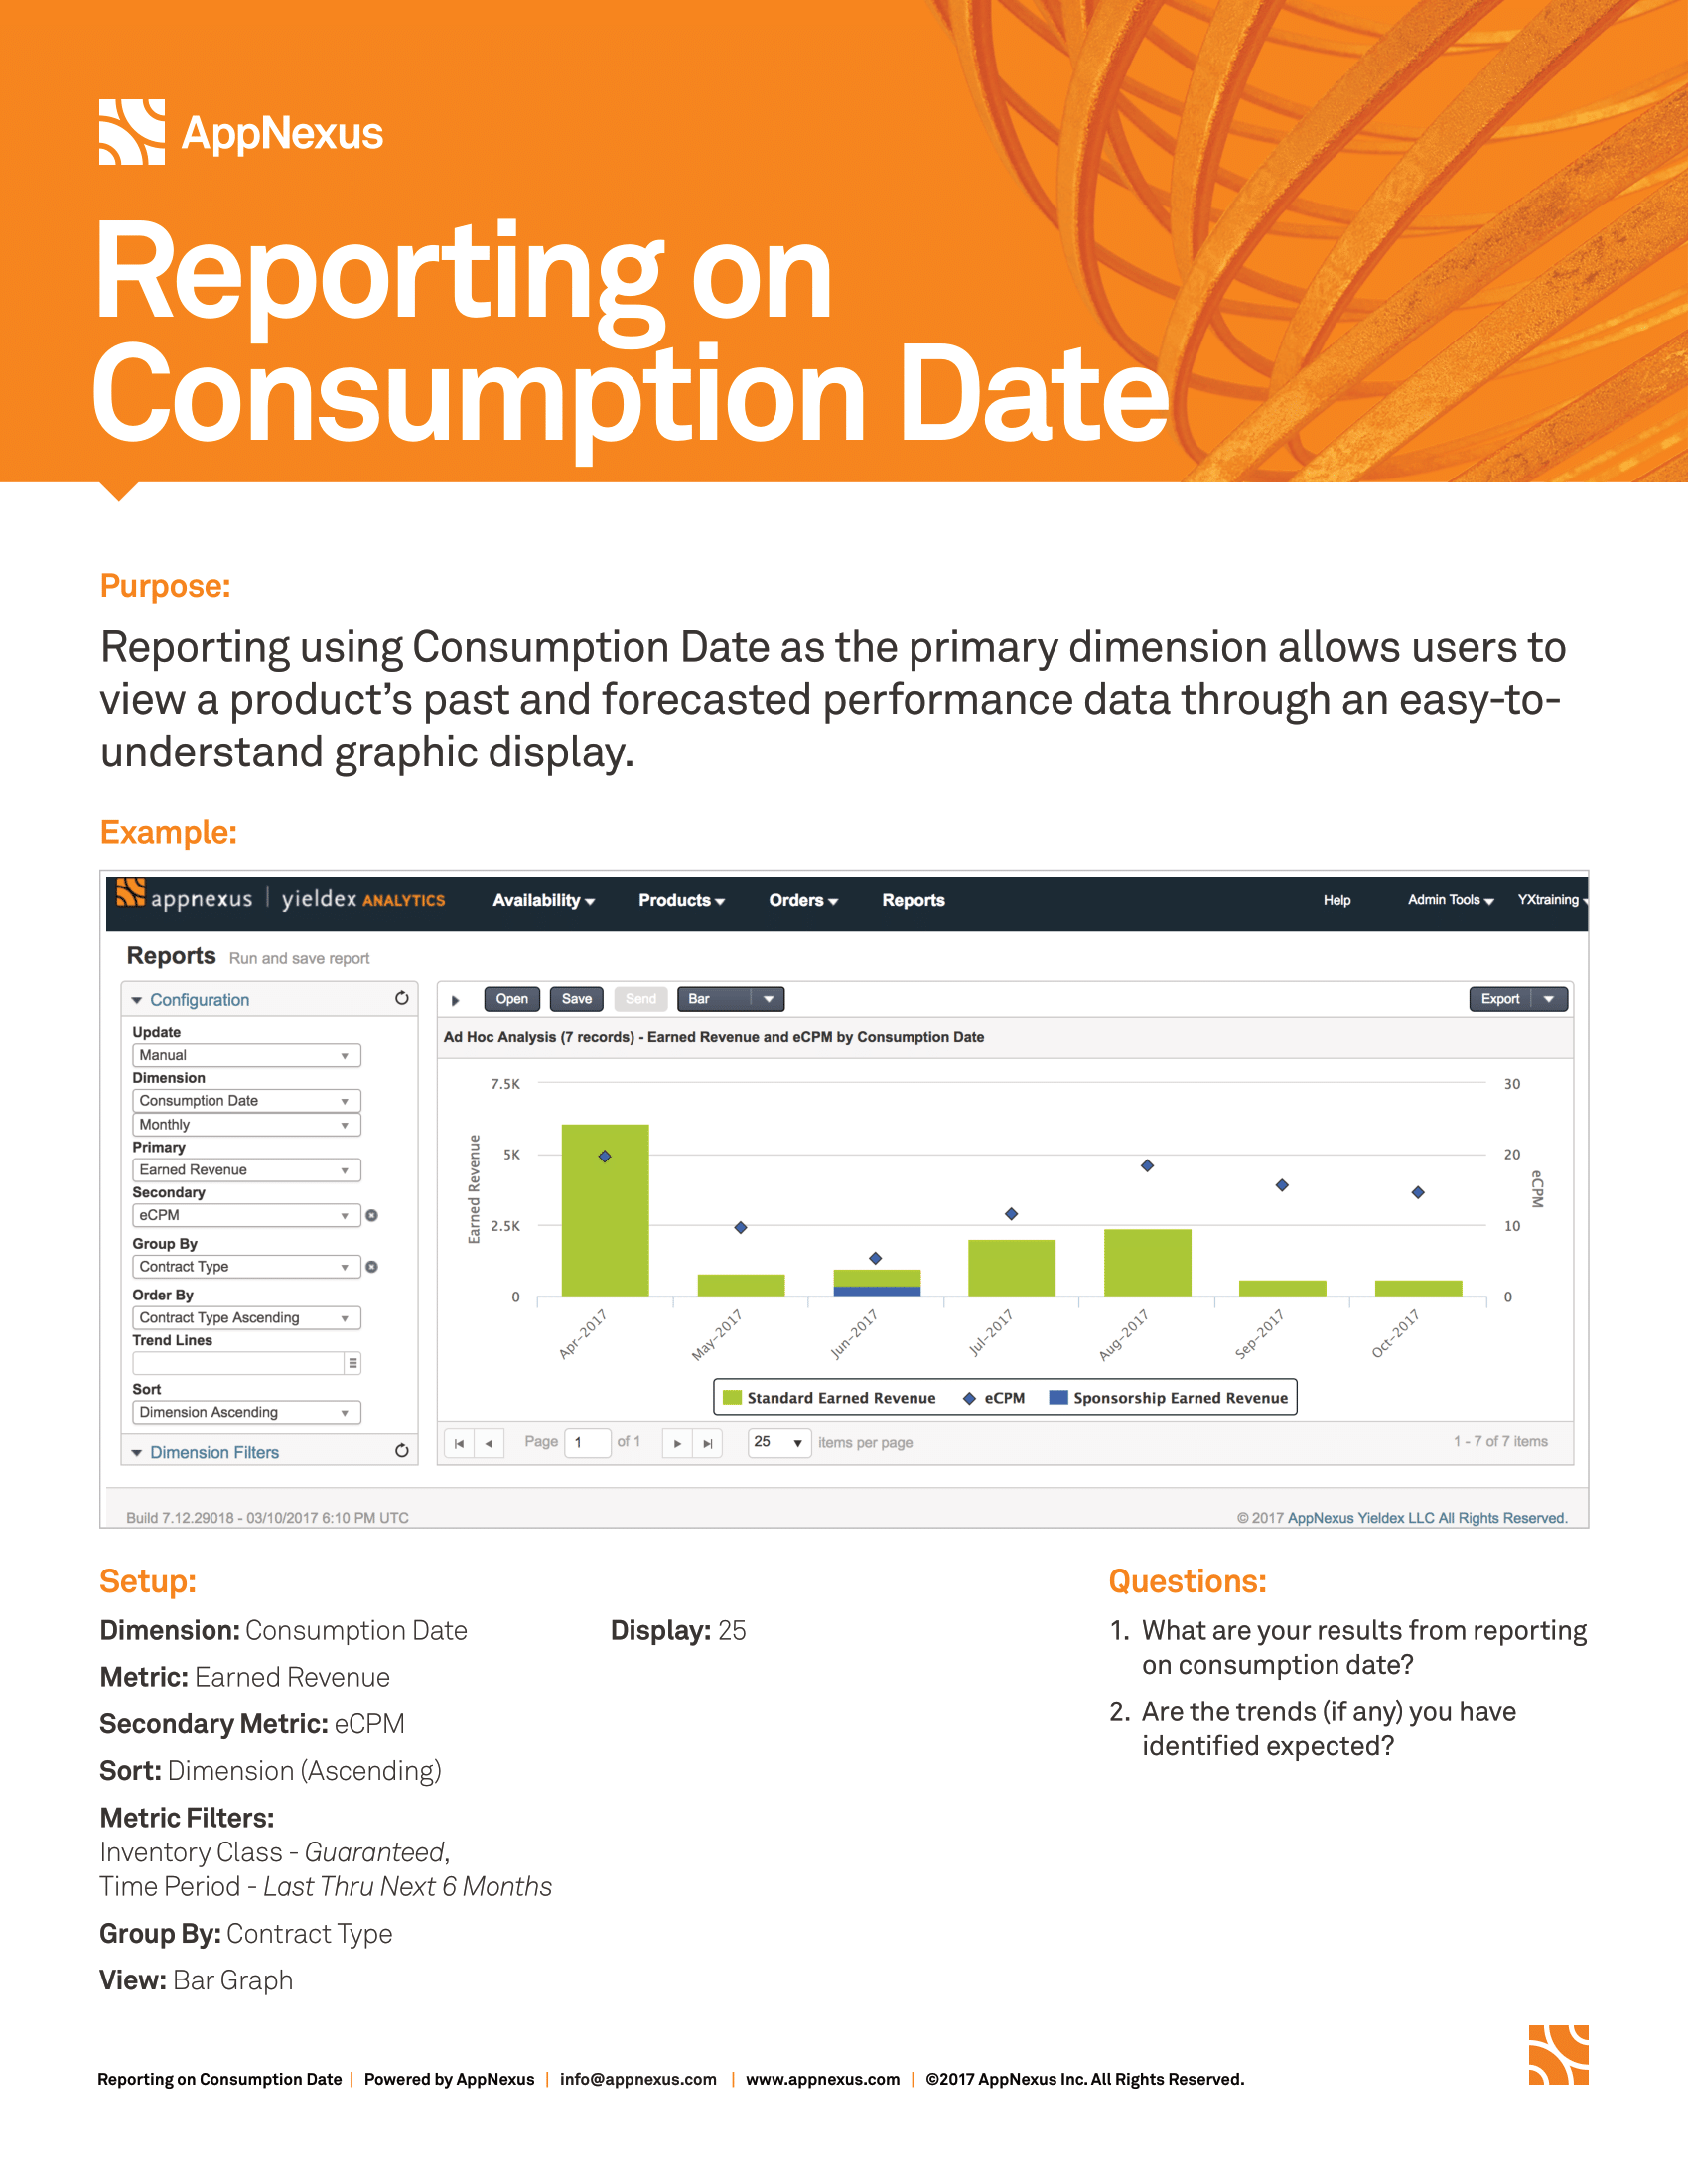
Reporting on Consumption Date report
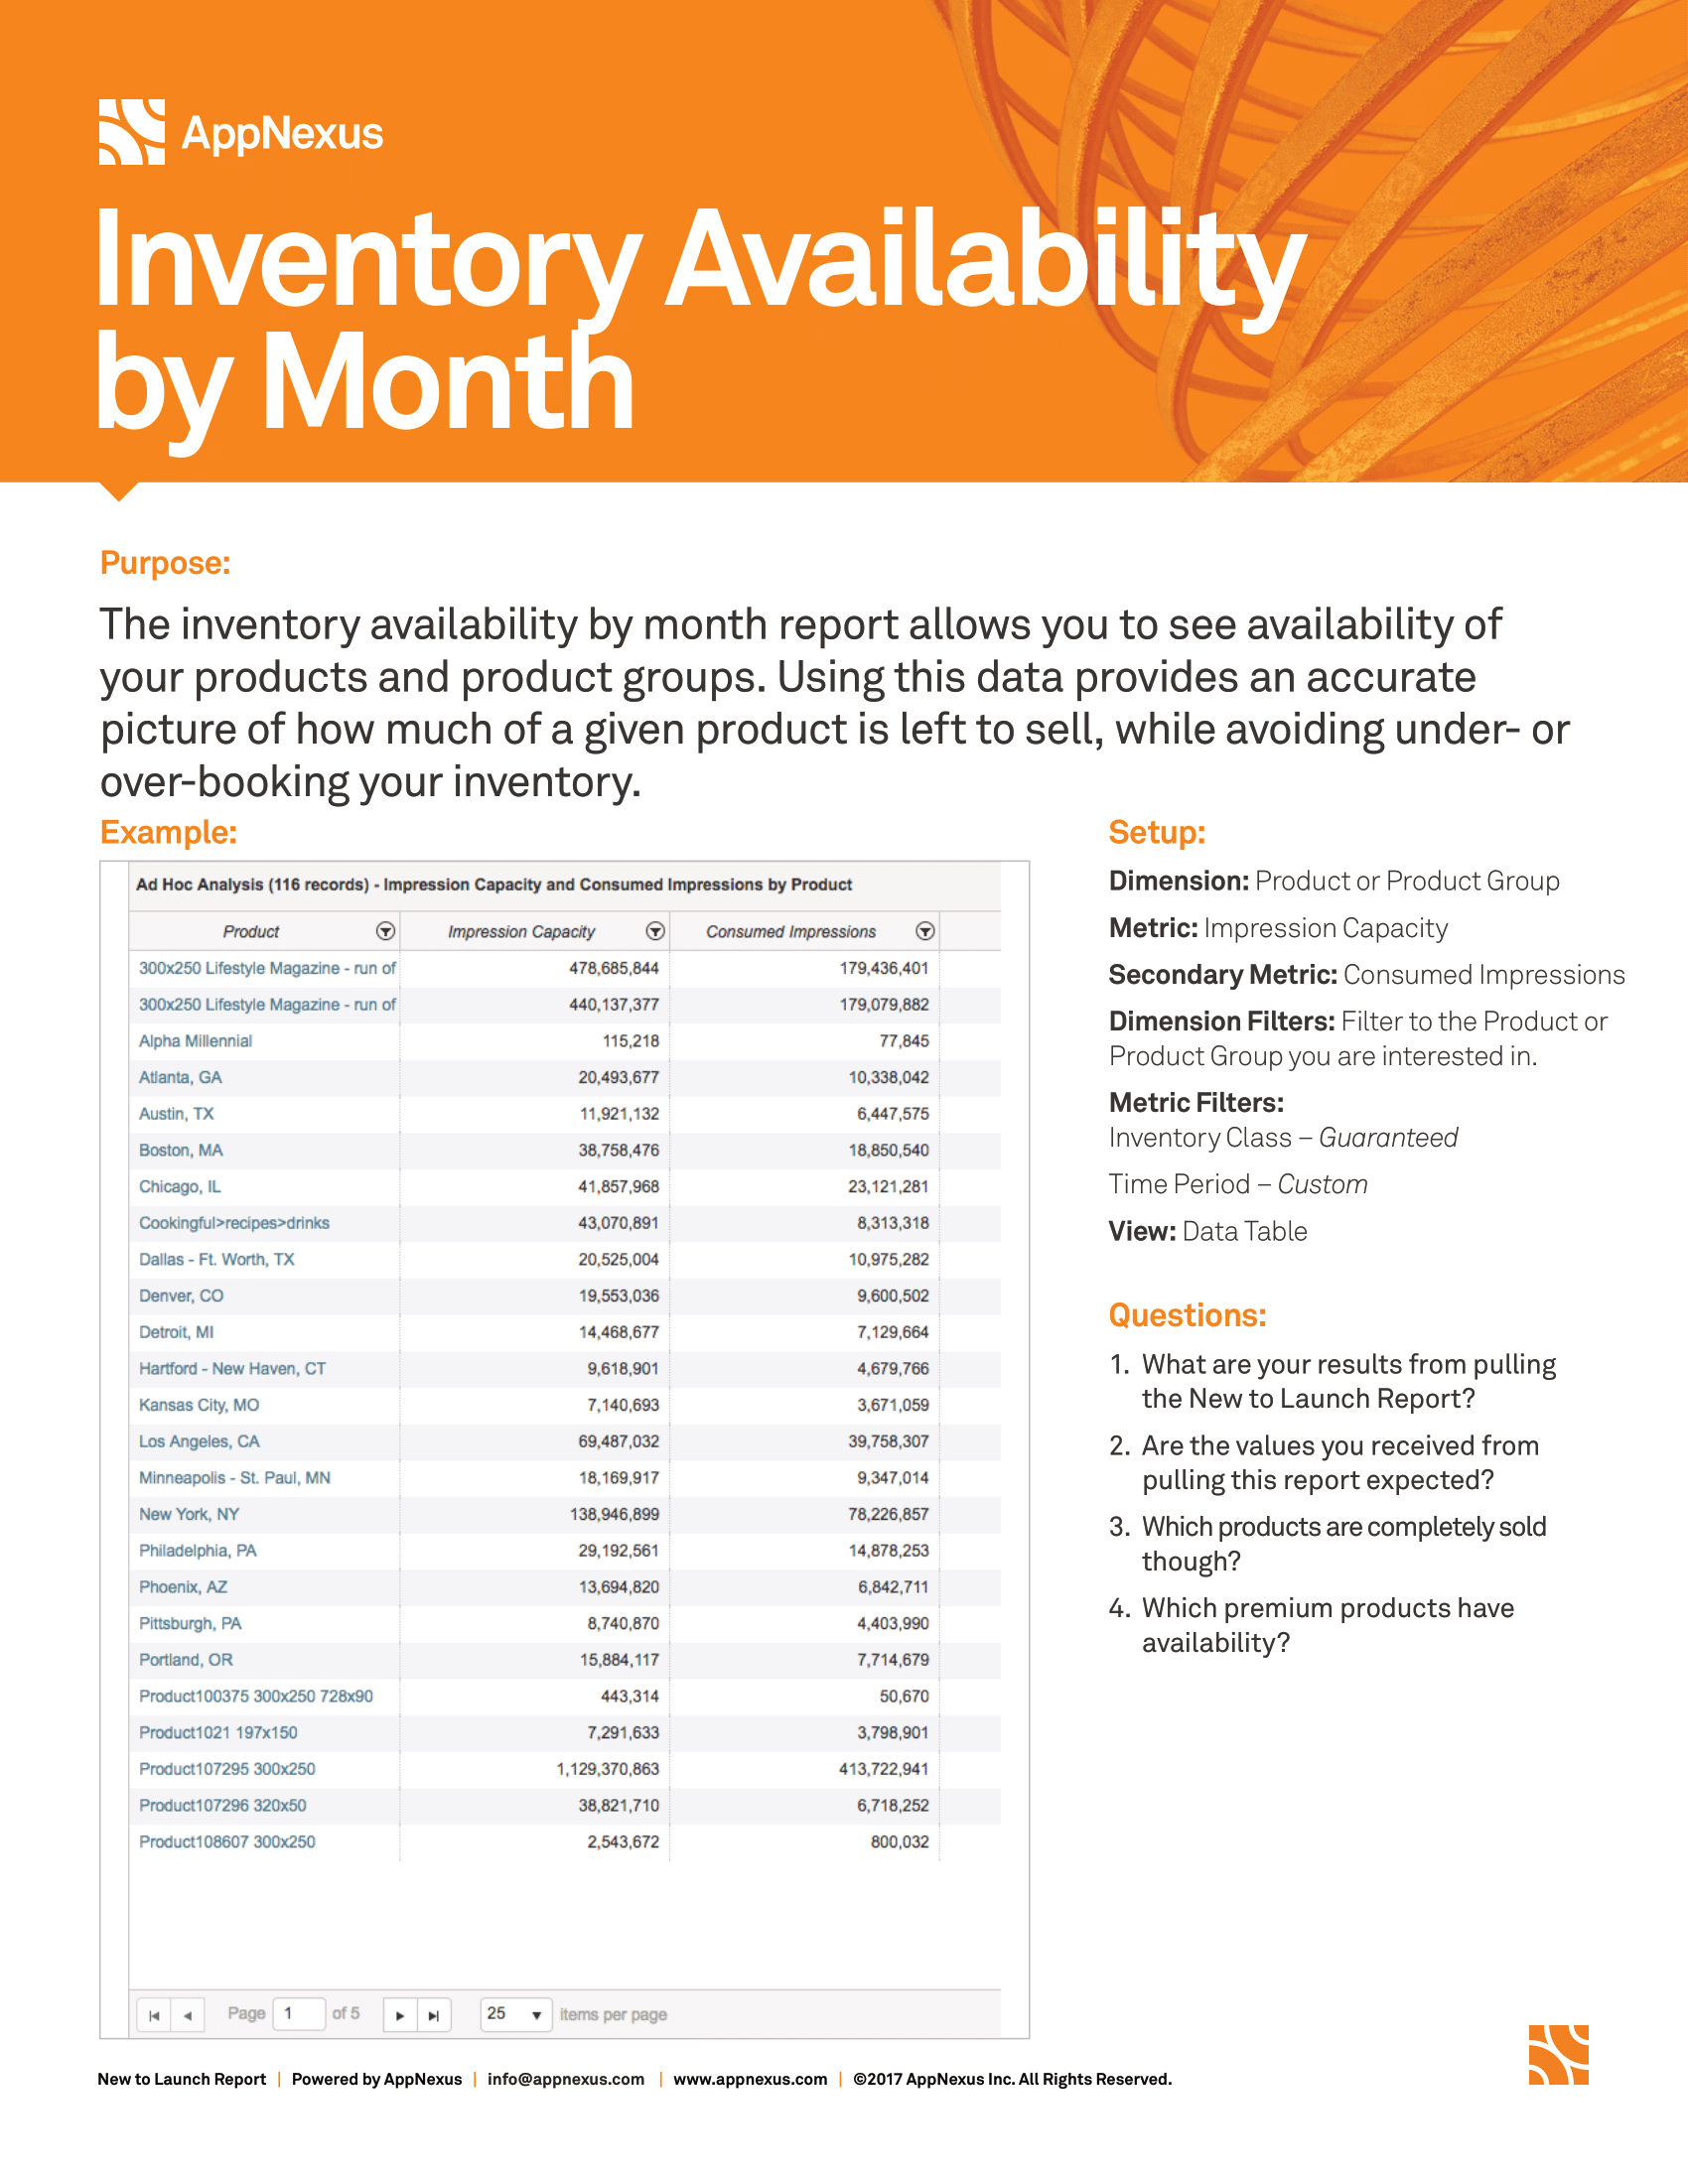
Inventory Availability by Month report