Note
Access to this page requires authorization. You can try signing in or changing directories.
Access to this page requires authorization. You can try changing directories.
This page deals with concepts on seasonality in Yield Analytics.
What is seasonality in Yield Analytics?
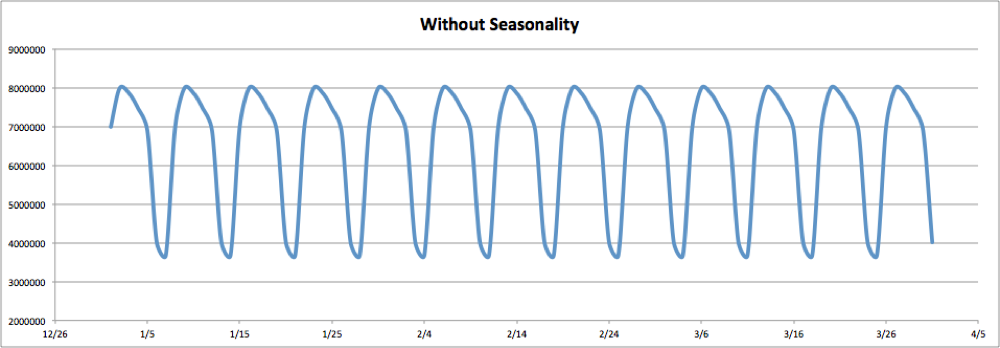
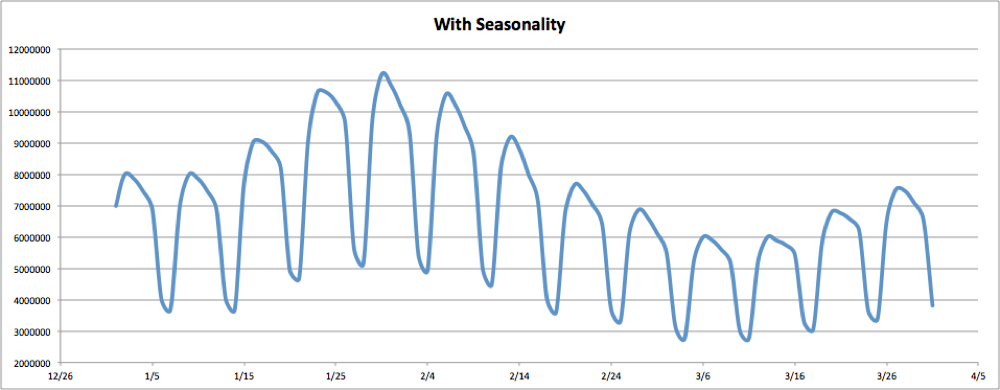
The basic input into a Yield Analytics capacity forecast is ad server log data. Yield Analytics can forecast your inventory using log data alone, but the forecast will not account for changes in the traffic pattern and amplitude, based on the time of year or on events or holidays that recur year after year. Without seasonality, all future Mondays will have the same capacity. All future Tuesdays will have the same capacity, and so on. With your help, a Technical Client Manager can implement seasonal models in Yield Analytics to ensure forecasts reflect the seasonality of your inventory.
How do I know whether my inventory has seasonality?
Start exploring your seasonality by pulling historical capacity for your entire network for the last two or three years, preferably at a daily level, and graphing it year over year. Barring major changes to your site such as a redesign, if your inventory has seasonality you should see a similar traffic pattern from year to year. The amplitude does not need to be the same, as there will naturally be organic growth or decline. Once you've established that you have seasonality at the network level, consider whether you may have any broad sections of inventory that have a significantly different seasonal pattern than the network. Repeat the graphing process for those sections to determine whether it makes sense to consider handling them separately from a seasonality standpoint.
I want to implement seasonality in Yield Analytics. What’s involved?
Reach out to your Account Manager or Technical Client Manager (TCM) to start the process. First, the TCM will ask you to provide historical capacity data for your network or for the sections of inventory that follow seasonal patterns that are important to you from a sales perspective. For example: If you had a sports site and you sold each sport separately, you might provide one dataset for soccer and another for hockey, since they exhibit different seasonal trends. It’s best if you can provide two to three years of daily history for each dataset.
Next the TCM will collaborate with you to create one or more seasonal models based on the provided history. Your help may be needed to interpret that history. For example, if two years of history for the same inventory don’t align, the TCM will ask for your insight into what year is the best representation of the seasonal curve you expect going forward. The TCM will create a Seasonal Model Product for each model, which will define the pool of inventory that pertains to the associated model.
Finally, the TCM will load the seasonal models into Yield Analytics. Once this has been done the forecast for any given product will be influenced by any overlapping seasonal models in proportion to the overlap.
My inventory is influenced by a seasonal event that falls on a different date every year. How does Yield Analytics handle that?
An event is a seasonal occasion or holiday that corresponds with a specific traffic pattern that is different than the norm. The event-related traffic pattern will be built into the corresponding seasonal model so it can be forecast for future years.
Yield Analytics maintains an event calendar for each client that can be customized to ensure event behavior is applied on the appropriate dates in future years. Some events and holidays are standard, such as Christmas. Other holidays and events are created custom based on your specific seasonality. For example, if a yearly industry conference were an important seasonal event for your inventory, the TCM would load the dates for that event into the calendar several years into the future. You may be asked to help provide those future dates.
I have at least a year of history stored in Yield Analytics. Doesn’t Yield Analytics automatically know the seasonality of my inventory?
Seasonal models are the mechanism that enables Yield Analytics to apply seasonality in forecasting, and seasonal models are not automatically updated as history accrues in Yield Analytics. Seasonal models must be manually maintained over time to ensure they continue to represent the most up-to-date seasonal curve for the inventory. Reach out to your Account Manager or Technical Client Manager to schedule a periodic review of your seasonal models. Typically, seasonal models are initially reviewed for accuracy 6 months after implementation. If all remains correct, an annual review will be conducted unless forecasting issues arise due to seasonal changes.