Note
Access to this page requires authorization. You can try signing in or changing directories.
Access to this page requires authorization. You can try changing directories.
APPLIES TO:  Power BI Desktop
Power BI service
Power BI Desktop
Power BI service
A visual calculation is a DAX calculation that you author directly on a report visual, rather than in the underlying semantic model. Visual calculations let you perform business calculations, such as running sums or moving averages, for a single visual without adding measures or calculated columns that affect other reports.
This article shows you how to add and edit a visual calculation, and walks through an example that uses a visual calculation to drive conditional formatting. For background on how visual calculations behave and when to use them, see Visual calculations.
Prerequisites
- A report in Power BI Desktop or the Power BI service with a table or matrix visual that contains at least one numeric column or measure.
Add a visual calculation
Select the visual that you want to add a calculation to.
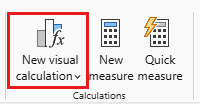
On the Home tab of the ribbon, select New visual calculation.
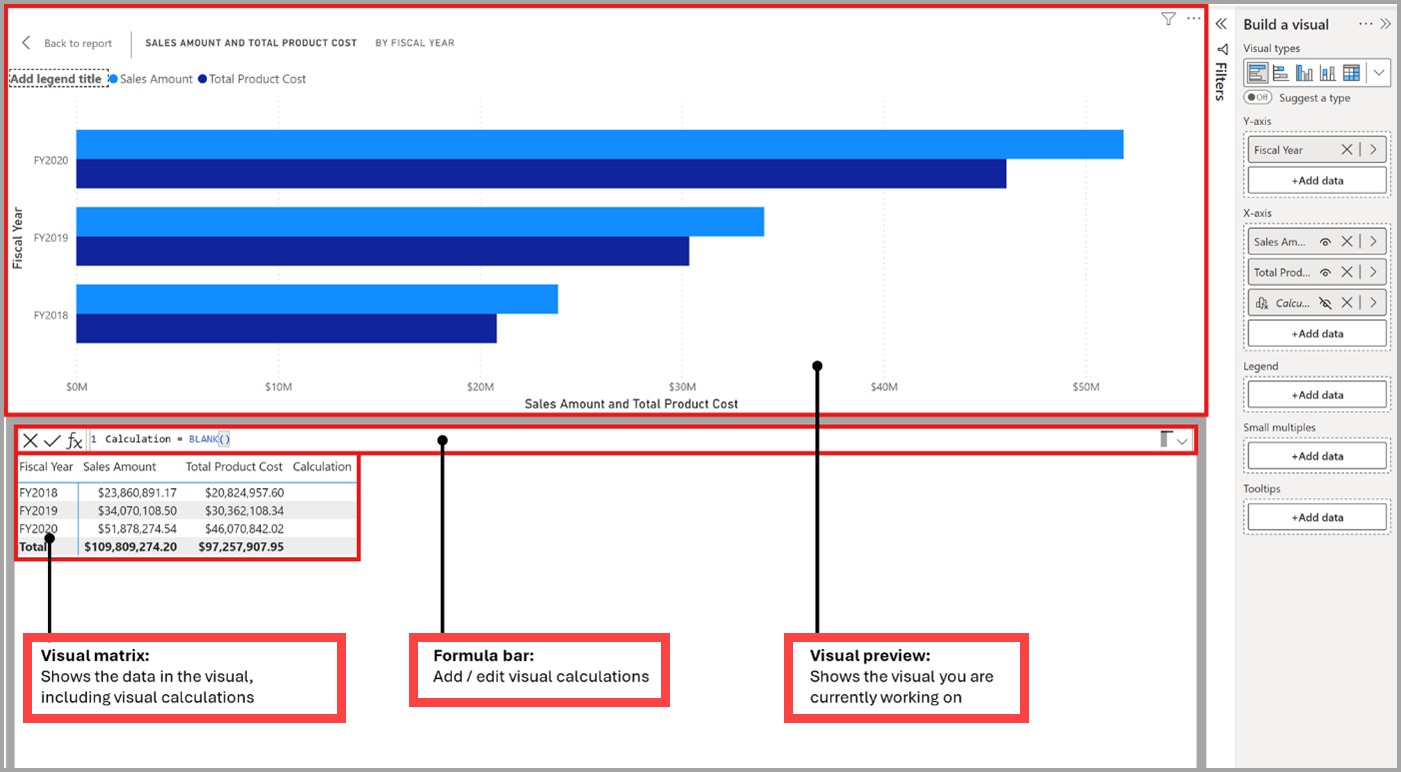
The visual calculations window opens in Edit mode. The Edit mode screen has three major sections, shown from top to bottom in the following image:
- The visual preview shows the visual you're working with.
- A formula bar is where you enter the visual calculation expression.
- The visual matrix shows the data in the visual and displays the results of visual calculations as you add them. Styling or theming that you apply to your visual isn't applied to the visual matrix.
Type the expression in the formula bar. For example, in a visual that contains Sales Amount and Total Product Cost by Fiscal Year, you could add a calculation that returns the profit for each year:
Profit = [Sales Amount] - [Total Product Cost]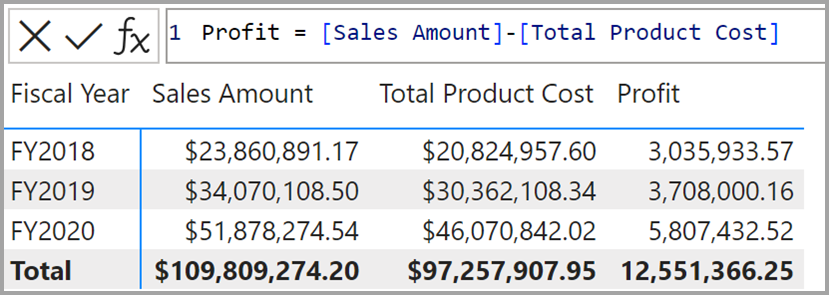
For each row of the visual matrix, the current
Sales AmountandTotal Product Costare subtracted, and the result is returned in theProfitcolumn. You don't need to add an aggregation function like SUM; most visual calculations evaluate row-by-row like a calculated column.Select Back to report to exit the visual calculation editor.
To create a calculation from a prebuilt template instead, select the bottom part of the New visual calculation button and choose a template. For the list of available templates, see Visual calculation templates.
Edit an existing visual calculation
To edit a visual calculation in Power BI Desktop, right-click the visual calculation in the field list of the Visualizations pane and select Edit calculation. The visual calculations edit screen reopens in Edit mode, where you can change the expression in the formula bar and see updated results in the visual matrix.
Example: Return a hex color code for conditional formatting
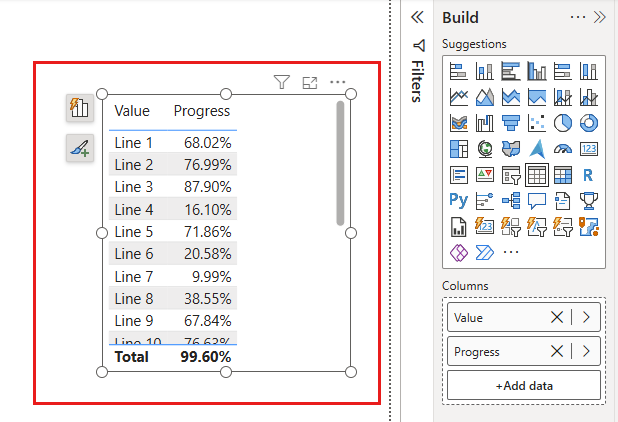
Use a visual calculation to return a hex color code, and then apply the color code through conditional formatting.
Select the visual where you want to use conditional formatting.
On the Home tab, select New visual calculation.
Write your visual calculation. Here's an IF statement that returns either green or red based on whether a measure is greater or less than 0.5:

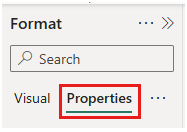
Conditional Hex Code = IF ( [Progress] > .5, "#5BA300", "#E91C1C" )Expand the Formatting pane and select Properties.
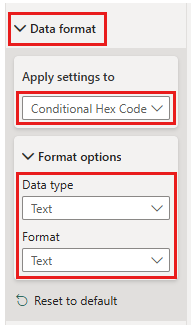
Expand the Data Format section, select your visual calculation, and set both the data type and format to Text.
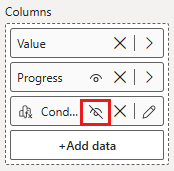
Before you exit the visual calculation editor, select the hide icon next to the visual calculation to hide it.
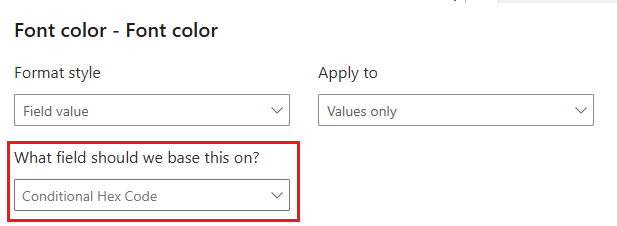
Use the visual calculation in a conditional formatting section.
Select Back to report to exit the visual calculation editor.

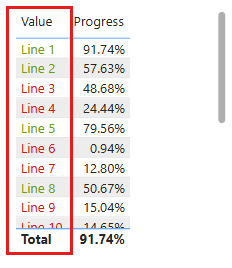
Your table now shows conditional formatting driven by the visual calculation.