SQL Server Reporting Services
A SQL Server technology that supports the creation, management, and delivery of both traditional, paper-oriented reports and interactive, web-based reports.
2,921 questions
This browser is no longer supported.
Upgrade to Microsoft Edge to take advantage of the latest features, security updates, and technical support.
' cx='32' cy='32' r='32' /%3E%3Ctext x='50%25' y='55%25' dominant-baseline='middle' text-anchor='middle' fill='%23FFF' %3EK%3C/text%3E%3C/svg%3E)
Hi,
I am using sql report Builder 2014.
I try in a vertical data bar, with dynamicly visibility of amounts of bars, to fix the width of the bars to be the same.
I know the amount of bars in each data line, so can someone tell me where in the properties I can use this information to override the dynamic width adaption to have each bar in the same width no matter how many bars are in the data bar diagram?
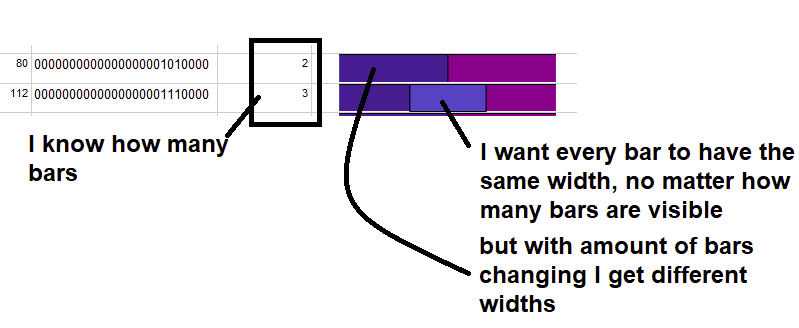
I messing around in the "custom attributes" of the datarows (all the PixelPointWidth Properties, I added a formulas like "= my_fixed_width * barcount") but nothign seems to be working.
Thank you in advance.
Regards,
Klaus6001

Hi @klaus6001 ,
I did one test with some dummy data, try if my solution works for your scene:
2.In the value(werte) windows. Set count(fileds!yourfiled.value) as value for each catteam field. This is my test result :
Regards,
Joy
If the answer is helpful, please click "Accept Answer" and upvote it.
Note: Please follow the steps in our documentation to enable e-mail notifications if you want to receive the related email notification for this thread.
Hi Joyzhao
works fine for me.
And is so much easier than solution with DataCloumn and Formuale for width, I do not even have to do anything to get the bars left aligned.
Two thumbs up for this.
Thank you
Hi Klaus,
Are you using stacked bar for this ? As I understand , using 100% Stacked Bar is not suitable for this scene.
Could you try use Count(yourfield.value) as Value for the databar ?
Since this is not direct setting like this, you could provide more so we could try to find some work around.
You could provide more detail about you report design. E.g. what was the data groups show in the data bar.
Also you could provide some dummy sample data so we could work on it.
Regards,
Joy
If the answer is helpful, please click "Accept Answer" and upvote it.
Note: Please follow the steps in our documentation to enable e-mail notifications if you want to receive the related email notification for this thread.
Hi Joyzhao,
thanks for you quick response.
No I am not using stacked bar. The answer below, found a solution that works fine for me!
Hi,
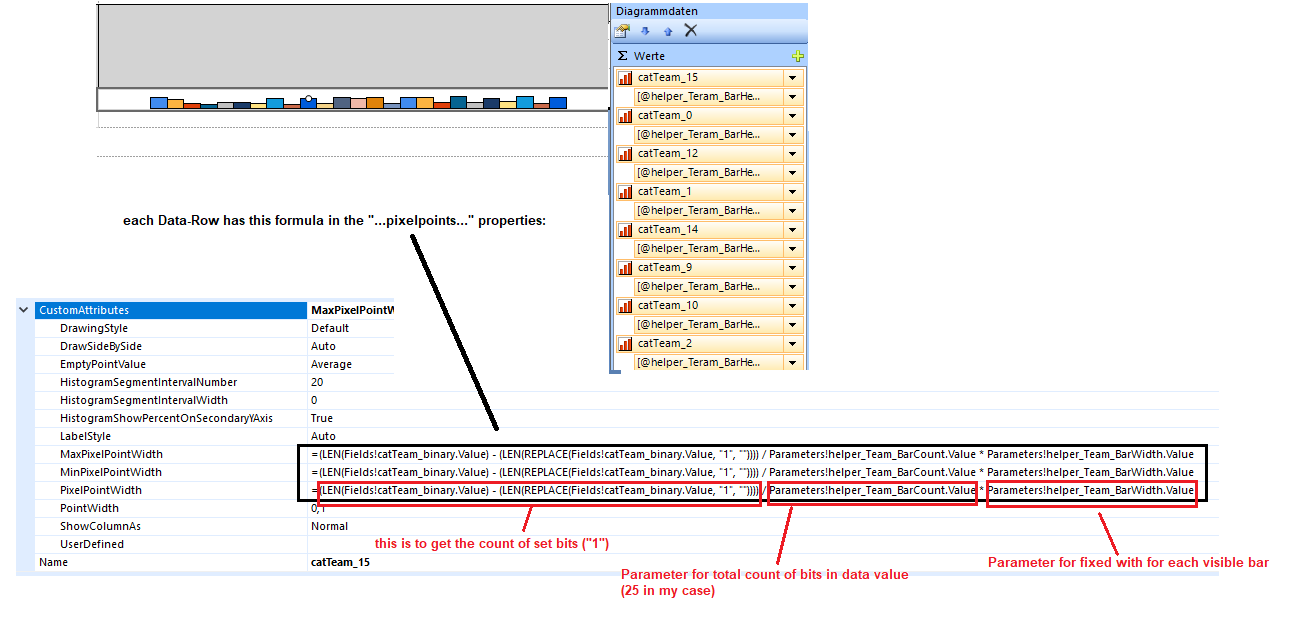
found the answer myself now, I was on the right path but worked with wrong formular for the bar width.
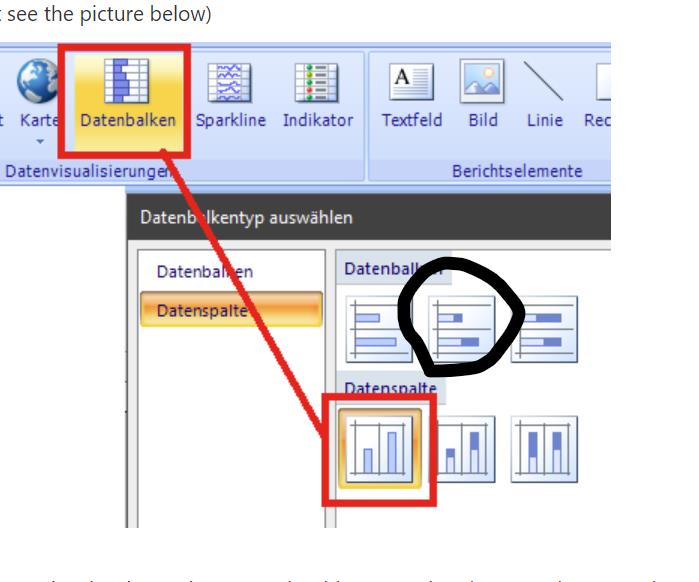
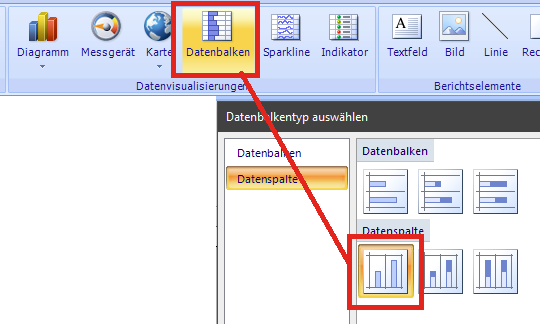
For clarification: I am not using "100% stacked bar" but "DataBar->Datacolumn->Bar" (only have german language installed, so I do not know how it excectly named in english, but see the picture below)
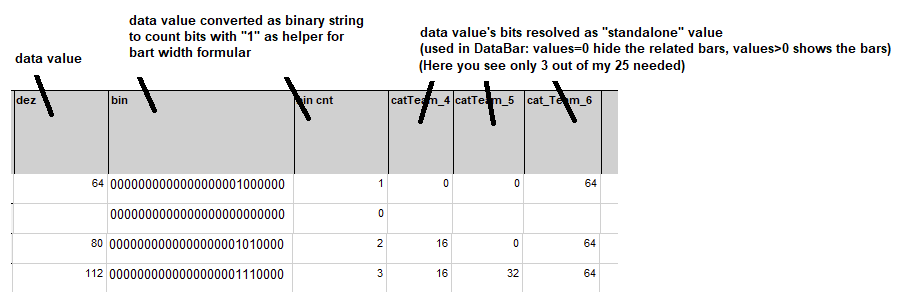
The data is an integeger value, but has to interpreted as binary number, in a way that a "0" shows that bit is not set while a "1" shows that bit is set.
Before I used indicators to visualize this in the report (every bit got a report column on its own) but customer is not satisfied and ask for a single column in which "0" values are supressed and only the "1" values are visible. My Idea was now to use DataBar->DataColumn->Bar, use a datarow for each of the bits and use the bits value to hide ("0") or show ("1") the related datarows bar.
My Data looks like that:
My solution is:
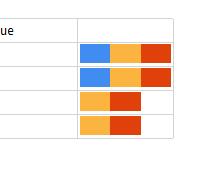
And with that I finally got what I wanted:
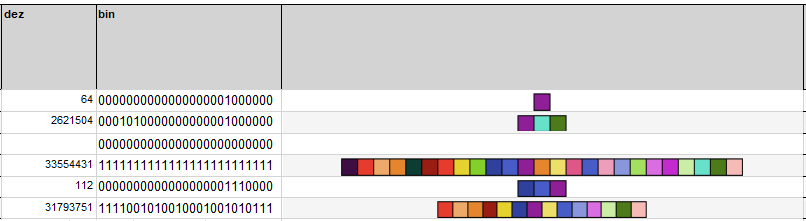
Hope it helps other, too.
Klaus6001