Note
Access to this page requires authorization. You can try signing in or changing directories.
Access to this page requires authorization. You can try changing directories.
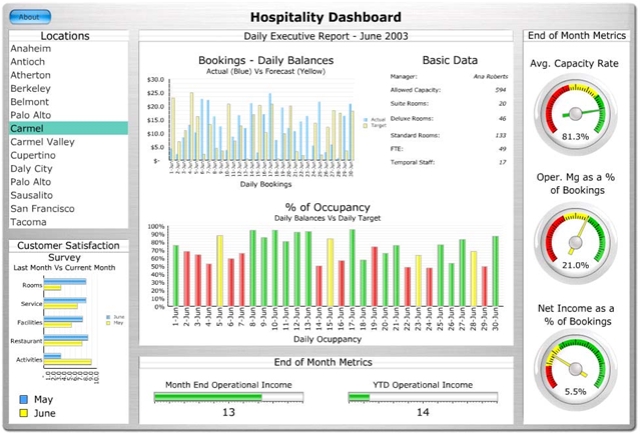 Over the last few days, I was experimenting with ways to create a snazzy looking dashboard using MOSS 2007. Among the various options, I found a pretty cool option using XCelsius (Thanks Will, for the pointer). I downloaded the trial version to see how good it was and was pretty amazed with the quality of the data visualization. To test it out, I used Excel 2007, connected to backend SQL Data, and pulled in some sales data. I then used XCelsius and generated a swf file that I posted to a Sharepoint document library. To display this in Sharepoint, I used a content editor webpart and used the following code that I gleaned from Henrik Lovgret :
<object classid="clsid:d27cdb6e-ae6d-11cf-96b8-444553540000" codebase="https://download.macromedia.com/pub/shockwave/cabs/flash/swflash.cab#version=6,0,0,0" width="202" height="93" id="worldtime" align="middle">
<param name="allowScriptAccess" value="sameDomain" />
<param name="movie" value="https://your_domain/flashfile.swf" />
<param name="quality" value="high" />
<param name="bgcolor" value="#ffffff" />
<embed src="https://your_domain/flashfile.swf" quality="high" bgcolor="#ffffff" width="202" height="93" name="worldtime" align="middle" allowScriptAccess="sameDomain" type="application/x-shockwave-flash" pluginspage="https://www.macromedia.com/go/getflashplayer" />
</object>
Comments
- Anonymous
July 15, 2010
hey.. im kinda having my training in Dprmnt of HR. and they asking me to do this dashboard and simulations. i like to download it.. where do u download it?