Prometheus alerts in Azure Monitor
As part of Azure Monitor managed services for Prometheus, you can use Prometheus alert rules to define alert conditions by using queries written in Prometheus Query Language (PromQL). The rule queries are applied on Prometheus metrics stored in an Azure Monitor workspace.
Whenever the alert query results in one or more time series meeting the condition, the alert counts as pending for these metric and label sets. A pending alert becomes active after a user-defined period of time during which all the consecutive query evaluations for the respective time series meet the alert condition. After an alert becomes active, it's fired and triggers your actions or notifications of choice, as defined in the Azure action groups configured in your alert rule.
Create Prometheus alert rules
You create and manage Prometheus alert rules as part of a Prometheus rule group. For details, see Azure Monitor managed service for Prometheus rule groups.
View Prometheus alerts
You can view fired and resolved Prometheus alerts in the Azure portal together with all other alert types. Use the following steps to filter on only Prometheus alerts:
On the Monitor menu in the Azure portal, select Alerts.
If Monitor service doesn't appear as a filter option, select Add Filter and add it.
Set the Monitor service filter to Prometheus to see Prometheus alerts.
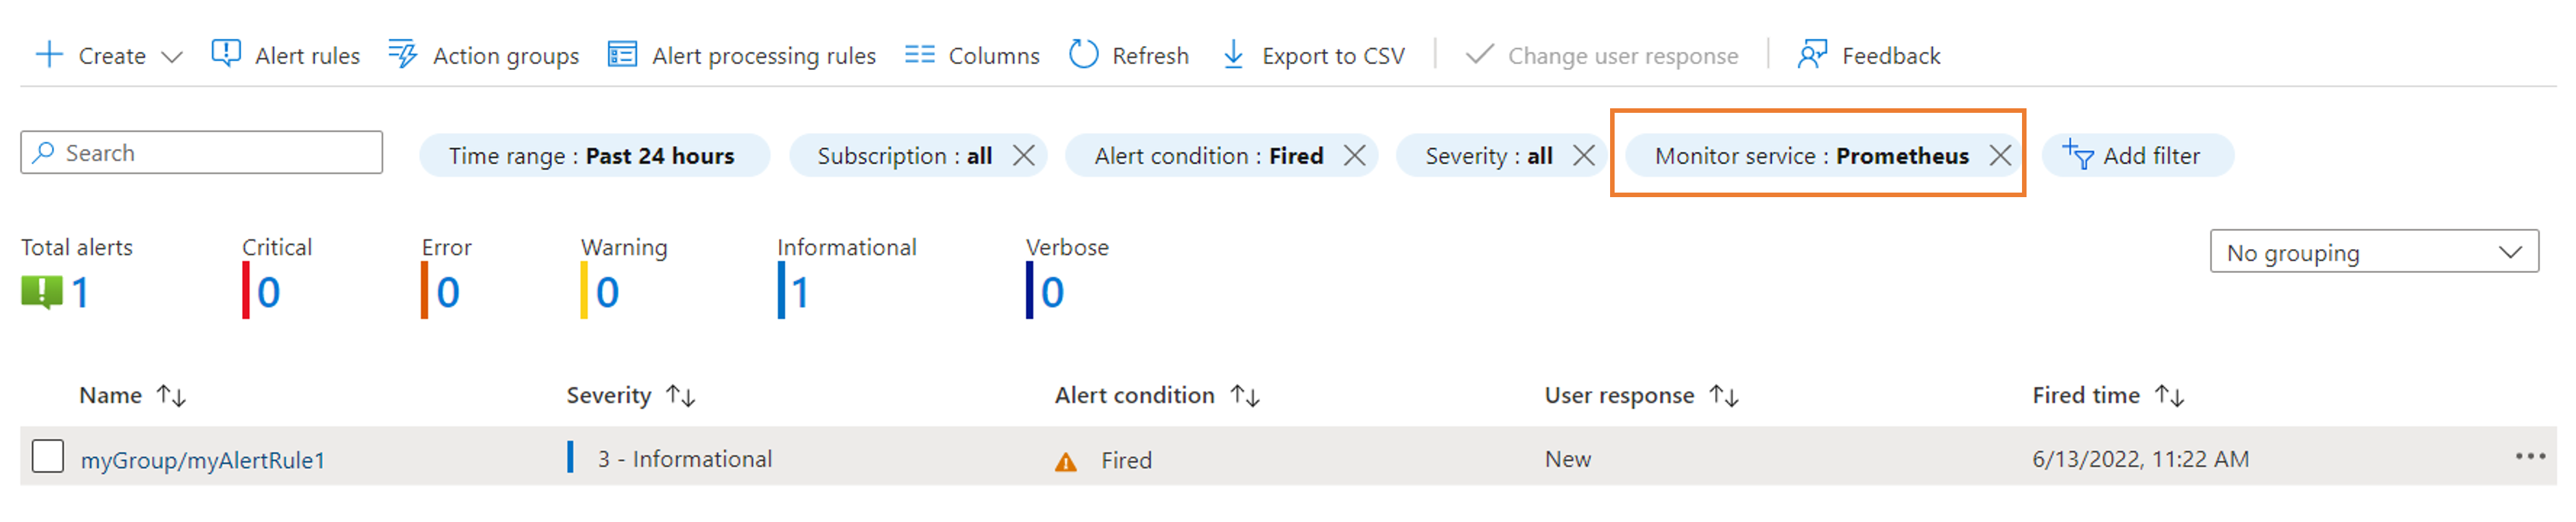
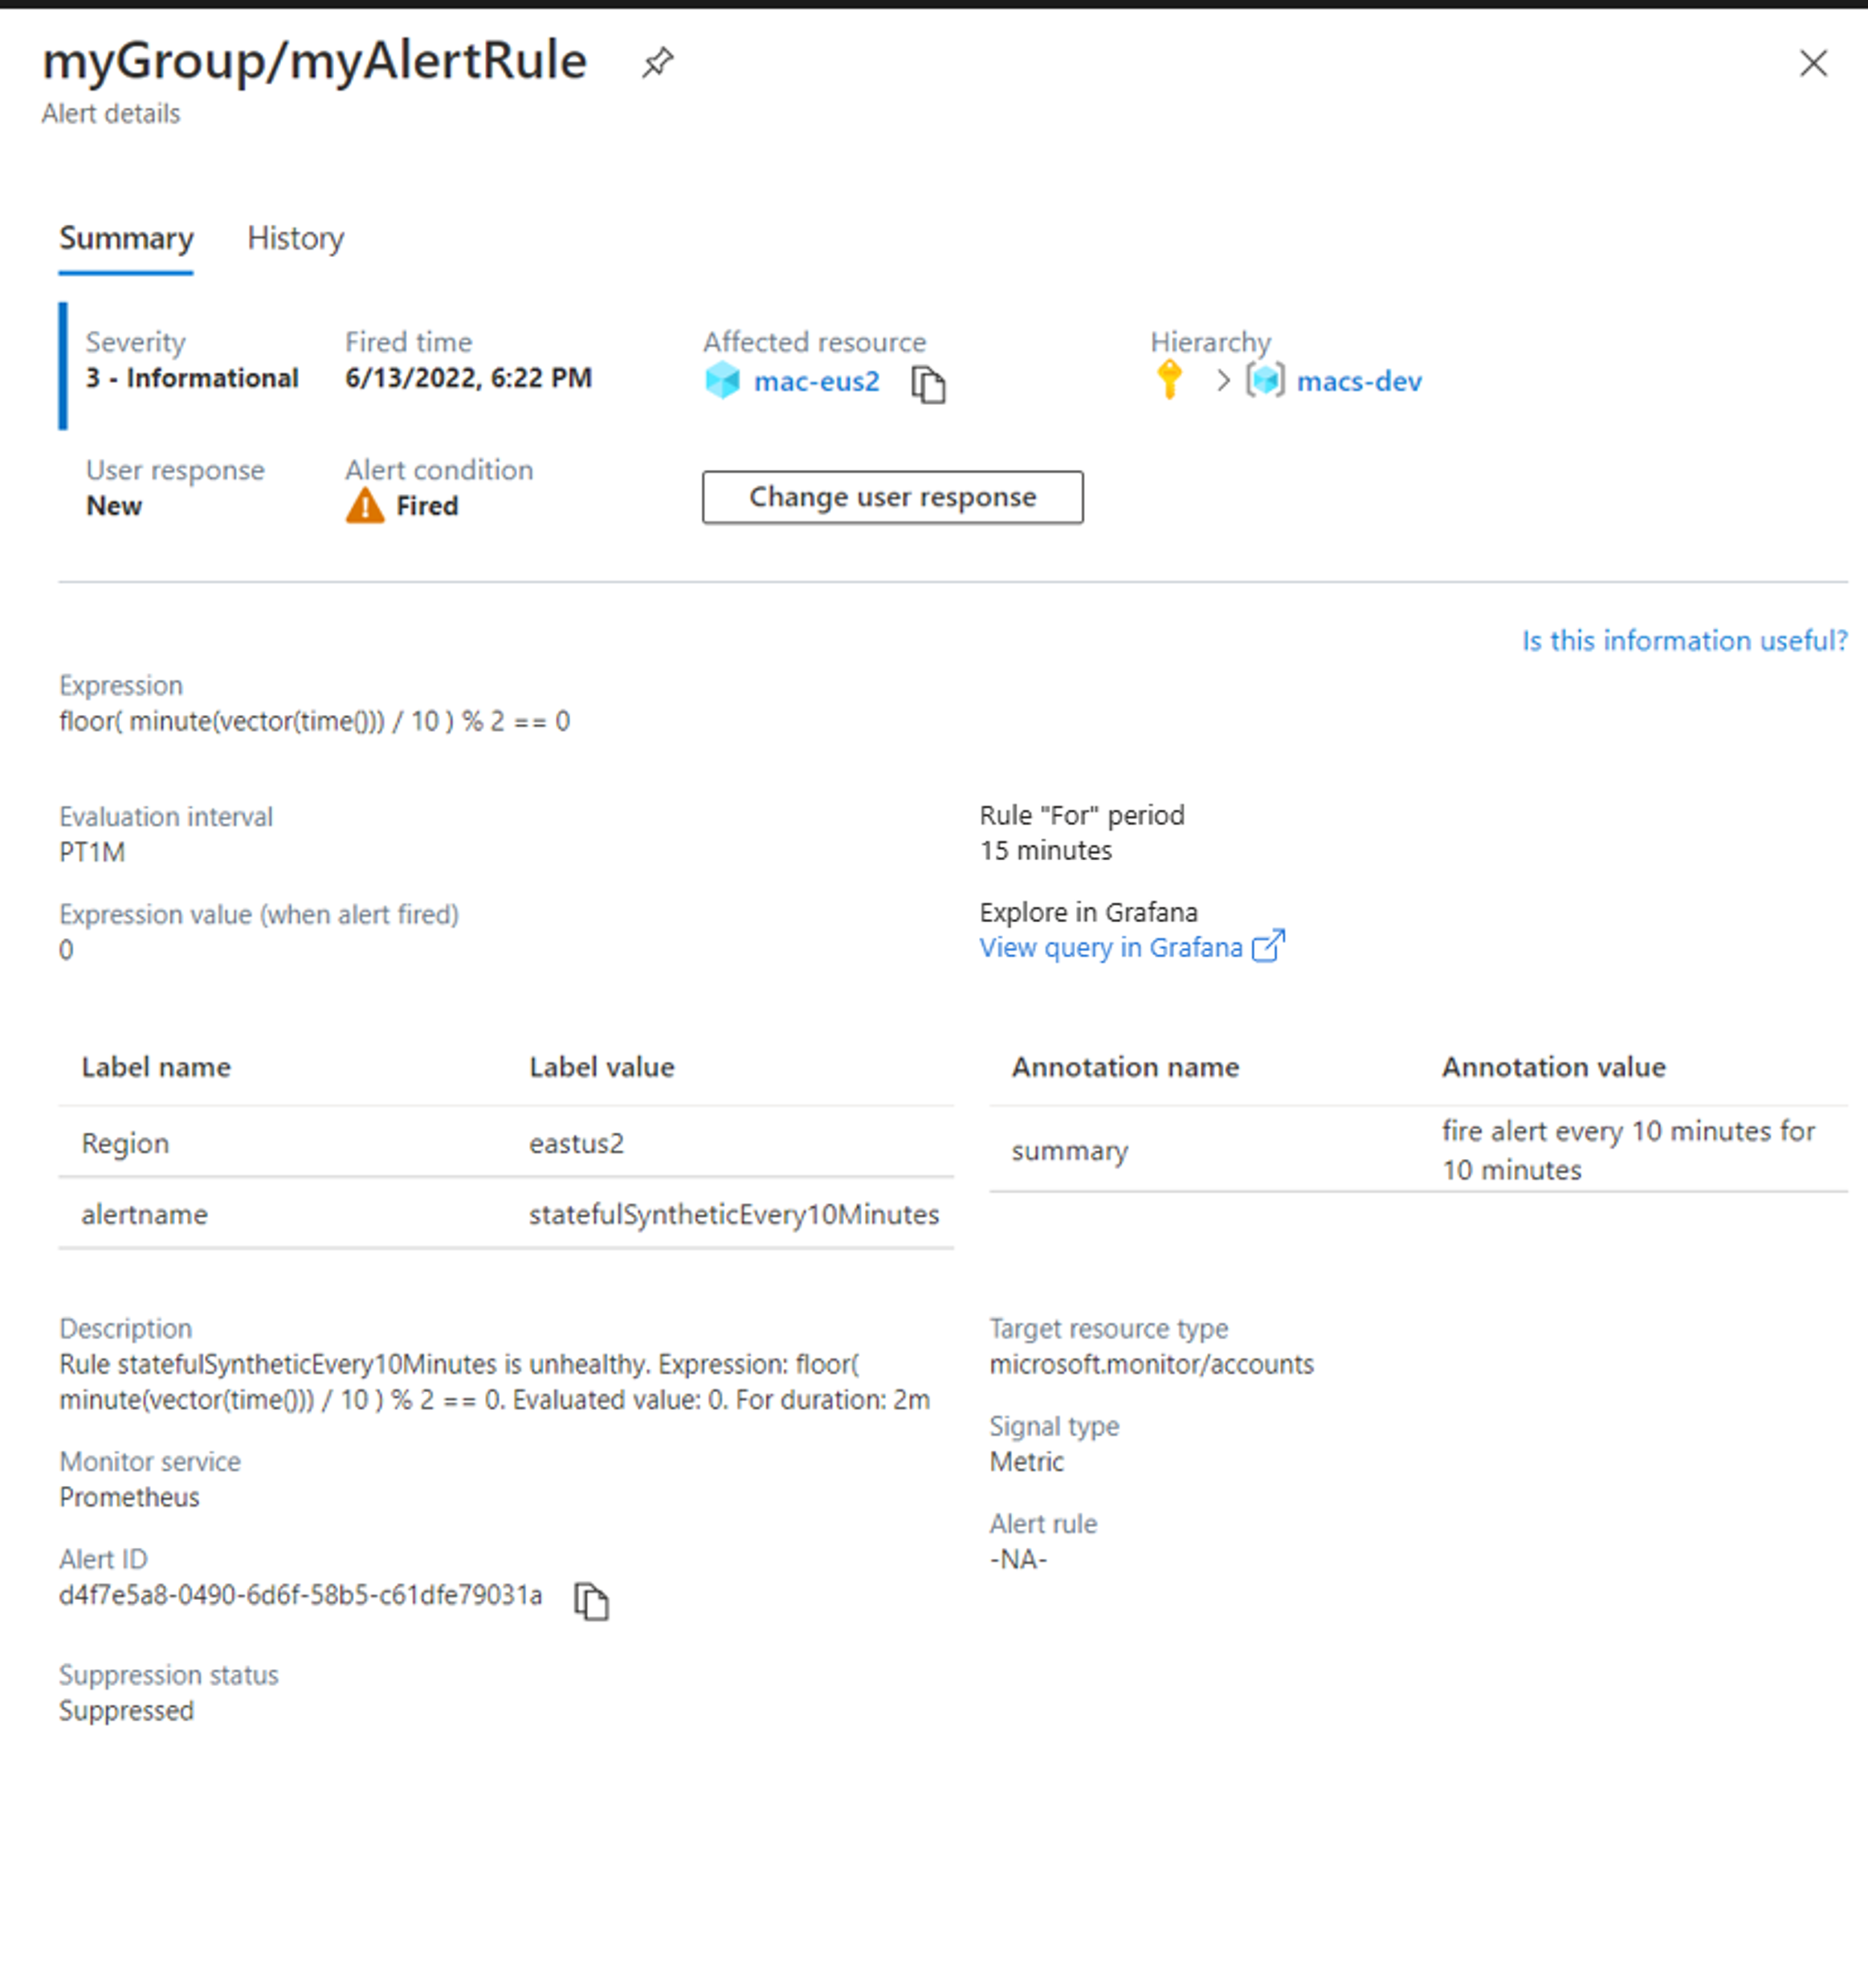
Select the alert name to view the details of a specific fired or resolved alert.


If your rule group is configured with a specific cluster scope, you can also view alerts fired for this cluster. On the Cluster menu in the Azure portal, select Alerts. You can then filter for the Prometheus monitoring service.
Explore Prometheus alerts in Grafana
On the pane that shows the details of fired alerts, select the View query in Grafana link.
A browser tab opens and takes you to the Azure Managed Grafana instance that's connected to your Azure Monitor workspace.
Grafana opens in Explore mode and presents the chart for your alert rule expression query around the alert firing time. You can further explore the query in Grafana to identify the reason that the alert is firing.
Note
- If no Azure Managed Grafana instance is connected to your Azure Monitor workspace, a link to Grafana isn't available.
- To view the alert query in Explore mode, you must have either Grafana Admin or Grafana Editor role permissions. If you don't have the needed permissions, you get a Grafana error.