Note
Access to this page requires authorization. You can try signing in or changing directories.
Access to this page requires authorization. You can try changing directories.
[This article is prerelease documentation and is subject to change.]
The Variance analysis feature revolutionizes the approach to analyzing financial variances such as forecasts, budgets, and more with its AI-driven capabilities. In addition to quickly highlighting critical variances, the feature instantly identifies main contributors, and generates a structured narrative explaining key insights, allowing for a more efficient and accurate analysis.
Use the Variance analysis feature in an assistive capacity or autonomously.
- Assistive: the Variance analysis feature assists users "in the moment" as they actively analyze variances in financial data.
- Autonomous: set the feature to perform the analysis autonomously for even greater efficiency.
Note
The following sections discuss how to use the Variance analysis feature in an assistive capacity. To enable autonomous use, you must first create a template. After you complete the steps in the Start working with the Variance Analysis feature in Excel section of this article, follow the steps in Use templates to perform variance analyses in Excel to create a template. To use the feature autonomously, follow the steps in Create a new AI action for Variance analysis.
Work with the Variance analysis feature in Excel
To begin working with the Variance analysis feature in Excel, follow these steps:
- Open an Excel workbook that contains the data to be analyzed. The Variance analysis feature allows you to analyze data presented in a pivot table by performing a deeper analysis of the source data behind the pivot table. The pivot table must reside in one worksheet in the workbook and the source data must reside in another worksheet within the same workbook.
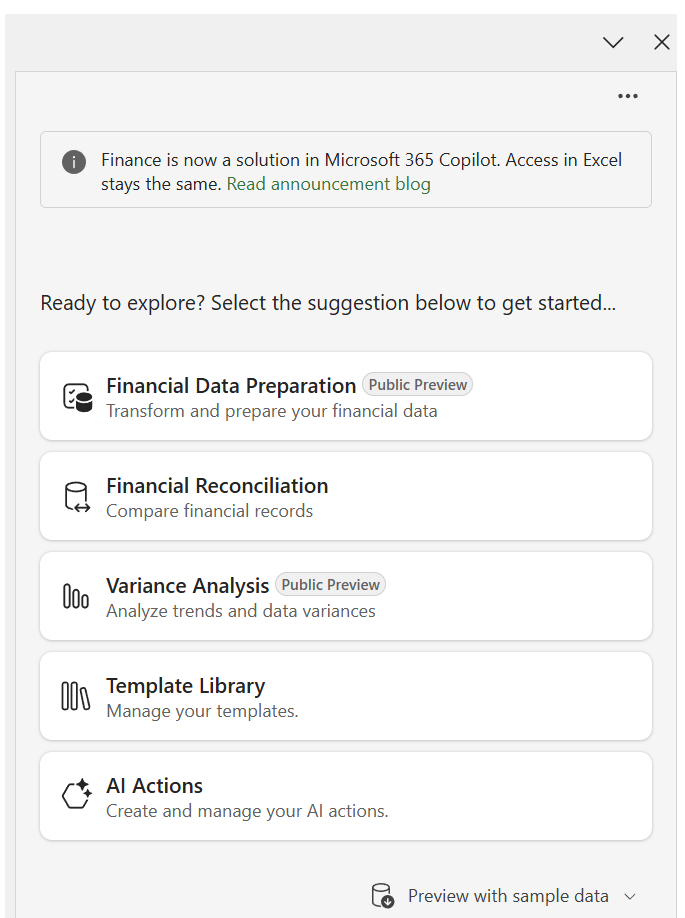
- On the Excel ribbon, go to the Home tab, and then select the Finance add-in to open the Finance in Microsoft 365 Copilot sidecar.
Note
If the Finance add-in isn't visible or unavailable, follow the instructions in Install Finance agents Add-in (business user-deployed).
Prepare data for variance analysis
Accurate variance analysis depends on properly collecting and organizing data, such as sales figures, production costs, or budgeted versus actual expenses. Without this step, you can't reliably identify deviations between data, such as planned and actual performance, and your results might be ineffective.
To tune the analysis, the Variance Analysis feature requires you to create a pivot table in another worksheet. You must build the pivot table on a single flat table. This flat table provides a structured foundation for effective variance analysis.
The Variance Analysis feature requires two pieces of data (two worksheets within a single Excel workbook):
- A worksheet containing the source data formatted as a flat table. The flat table provides a structured foundation for effective variance analysis.
- A pivot table built from the source data/flat table.
Note
A pivot table is only required for the assistive, in-the-moment use, including saving a template. It's not required when using the variance analysis feature autonomously. For more information, see Create a new AI Action for Variance Analysis.
Finance solution in Microsoft 365 Copilot provides a sample dataset that includes both the flat table source data and a pivot table. To use the sample dataset, follow these steps:
Open the Finance agents add-in in Excel.
Go to Home > Finance add-in on the ribbon bar to open the Finance in Microsoft 365 Copilot sidecar. If you don't see the Finance agents add-in, or if it's unavailable, follow the instructions in Install Finance Agents Add-in.
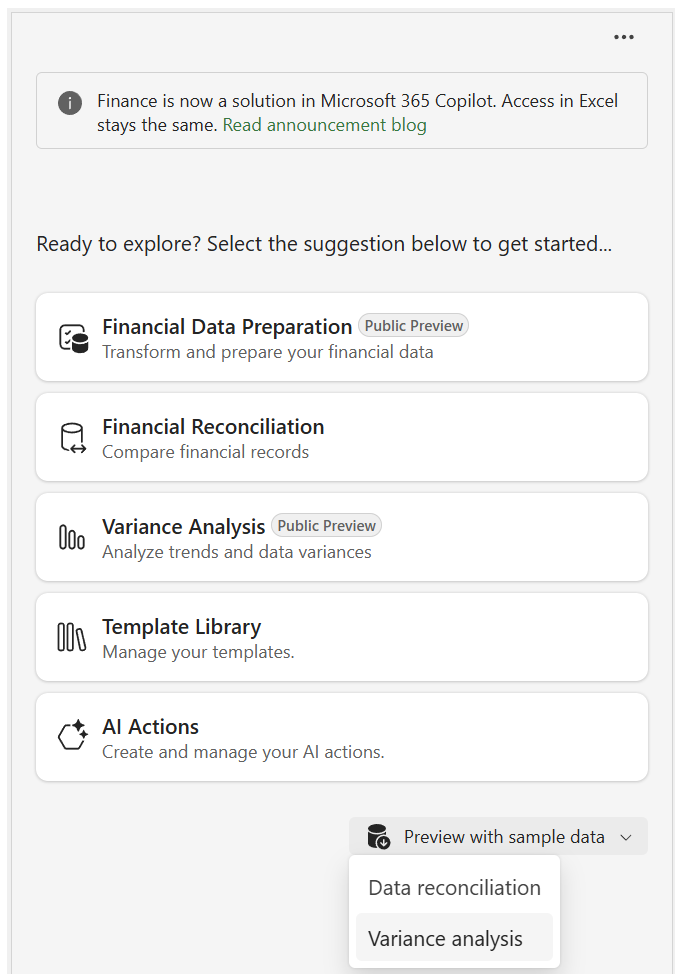
Select the Preview with sample data selection at the bottom of the sidecar. From the drop-down, select Variance analysis. The sample set is then created in two worksheets of the workbook.
Select data for analysis
To start the process and select data for analysis, follow these steps:
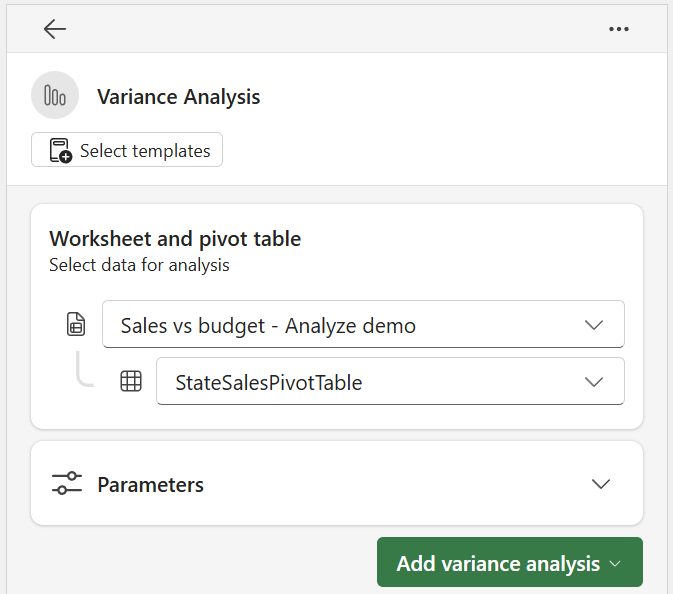
- In the sidecar, select Variance analysis.
- In the Worksheet and Pivot table card, the worksheet and pivot table references autopopulate according to their order in the workbook. If the suggested worksheet and pivot table are correct, proceed to Define Variance Analysis Criteria (in the following section). If not, select the correct worksheet and table from the dropdown list.
Define variance analysis parameters
Note
Analysis Parameters is an optional step in the process.
While automated tools can help identify top variances, different users have specific needs based on their job-to-be-done (JBTD) and focus areas. For example, field sales teams might prioritize variance analysis by product and sales region, while finance teams could focus on cost centers or profit margins. Without the flexibility to include user-defined attributes in the analysis, the insights might not align with the user's actual concerns, limiting the effectiveness of the variance review.
To align with the intended objectives, users can provide "focus" within the overall analysis. For example, ask the feature to consider products, regions, and departments while it analyzes the data. This approach lets the feature produce more relevant and tailored insights that match the criteria provided.
Note
Parameters have a global nature and apply to all analysis within a given session. Parameters become read-only when you have at least one variance analysis in progress.
The parameters card includes two components:
Data attributes focus (provided through the prompt box): parameters can provide control over which data attributes are most important for the analysis output. Rather than relying solely on default algorithms, depending on business need, you might be required to specify which factors, such as products, regions, or departments, you want the Variance analysis feature to prioritize. This approach lets the feature produce more relevant and tailored insights that match the intended focus areas. To provide specific priorities and ensure the output aligns with your needs, follow these steps:
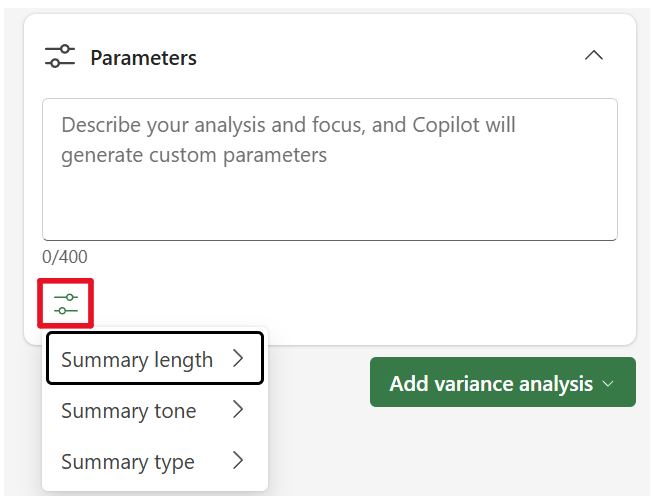
- Expand the Parameters card.
- In the provided Prompt box, use natural language to describe your analysis and focus to instruct the Variance analysis feature to consider during the analysis. For example, if your sales data has a business regional component and the intention is to note how specific product lines performed by region, you might write "Focus on regions and product line."
Structure and format options (length, tone, and type): Select Analysis options to expand a selection to change summary length, tone, and type.
Variance identification and analysis
In the criteria definition step, specify the individual criteria for identifying and analyzing variances. You can define criteria as specific cells to compare, such as Cell K10 vs J10, or use natural language input. For example, you might enter "Identify negative variances in December" or "Identify the top five variances in region X." You can also use variance criteria to analyze variances from a period-over-period perspective to explain variances across time periods such as month-over-month, year-over-year, and more. For more information about how to perform period-over-period variance analyses, see the Analyze Period-Over-Period Variances section of this article.
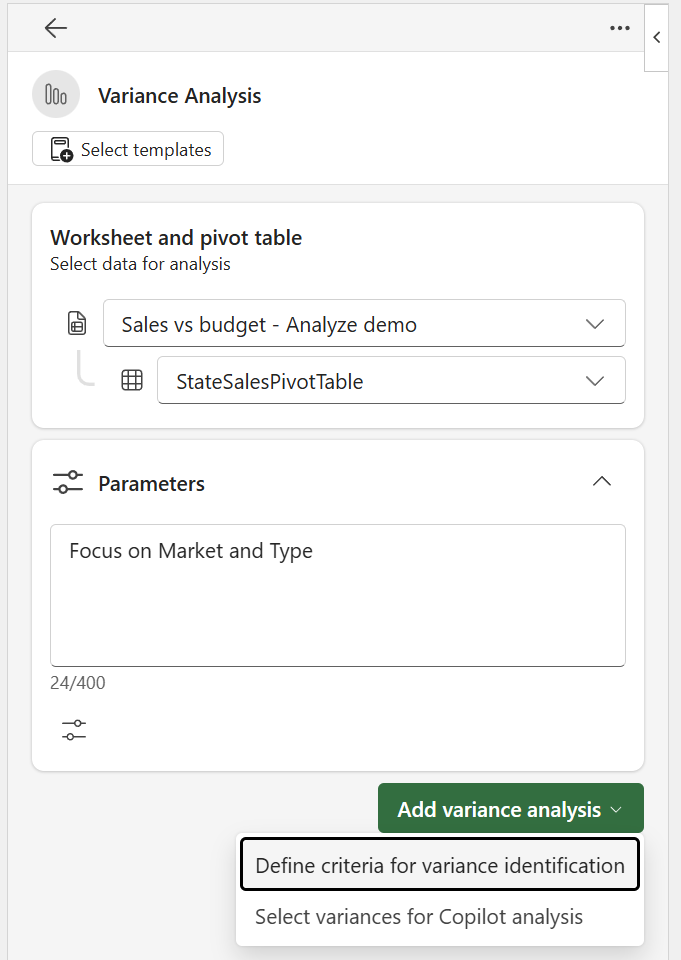
To describe criteria with natural language input, select Define criteria for variance identification from the Add variance analysis dropdown. To specify criteria as specific cells to compare, select Select variances for Copilot analysis. Learn more in the Select variances for Copilot analysis section of this article. You can also view sample natural language prompts by selecting View prompts above the input box.
- Select Add variance analysis, and then select Define criteria for variance identification.
- In Criteria, use natural language to describe the criteria you want to apply for variance identification.
- Select Enter or the submit arrow button to send the instruction and get variances for analysis.
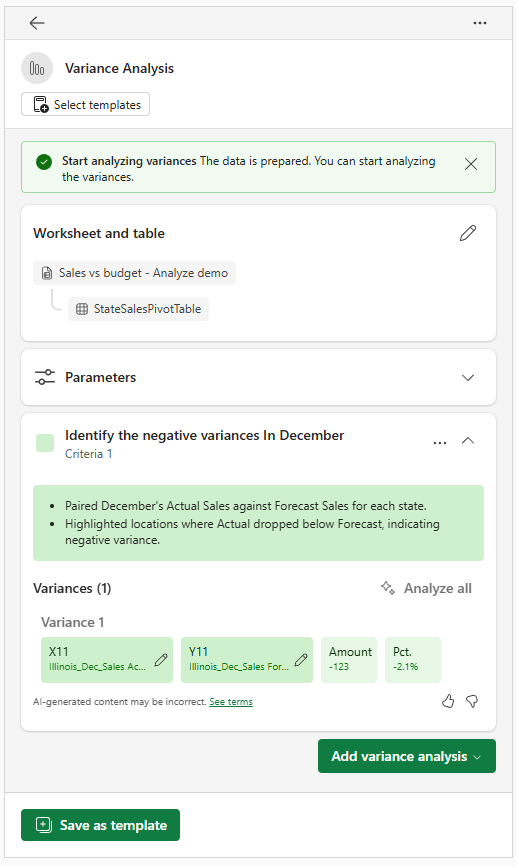
- The agent provides an action plan summarizing the steps it takes to perform the variance analysis. If the plan doesn't accurately reflect the user’s natural language defined variance criteria, edit the criteria and resubmit.
- The pivot table spreadsheet updates with highlighted cells to show where the results from the criteria are located in the data.
- Review individual results, including impact-related information such as the variance amount and percentage variance:
- listed variances - the two data points you're comparing.
- Amount - the calculated difference between the two data points.
- Pct - the calculated variance percentage using the formula: (Data point 2 – Data point 1)/Data point 1.
Note
If multiple columns are available for analysis, be more specific in the criteria definition. Referring to a quarter, month, or other specific column can help refine the results. To see examples, select View prompts to open the Prompt guide.
Analyze variances
To view a deeper analysis and insights for each variance, analyze the results. You have two options for analyzing results:
- Individual Analysis to analyze an individual result by hovering over the specified result and selecting Analyze to the right of the indicated Percent (Pct.) label for the result.
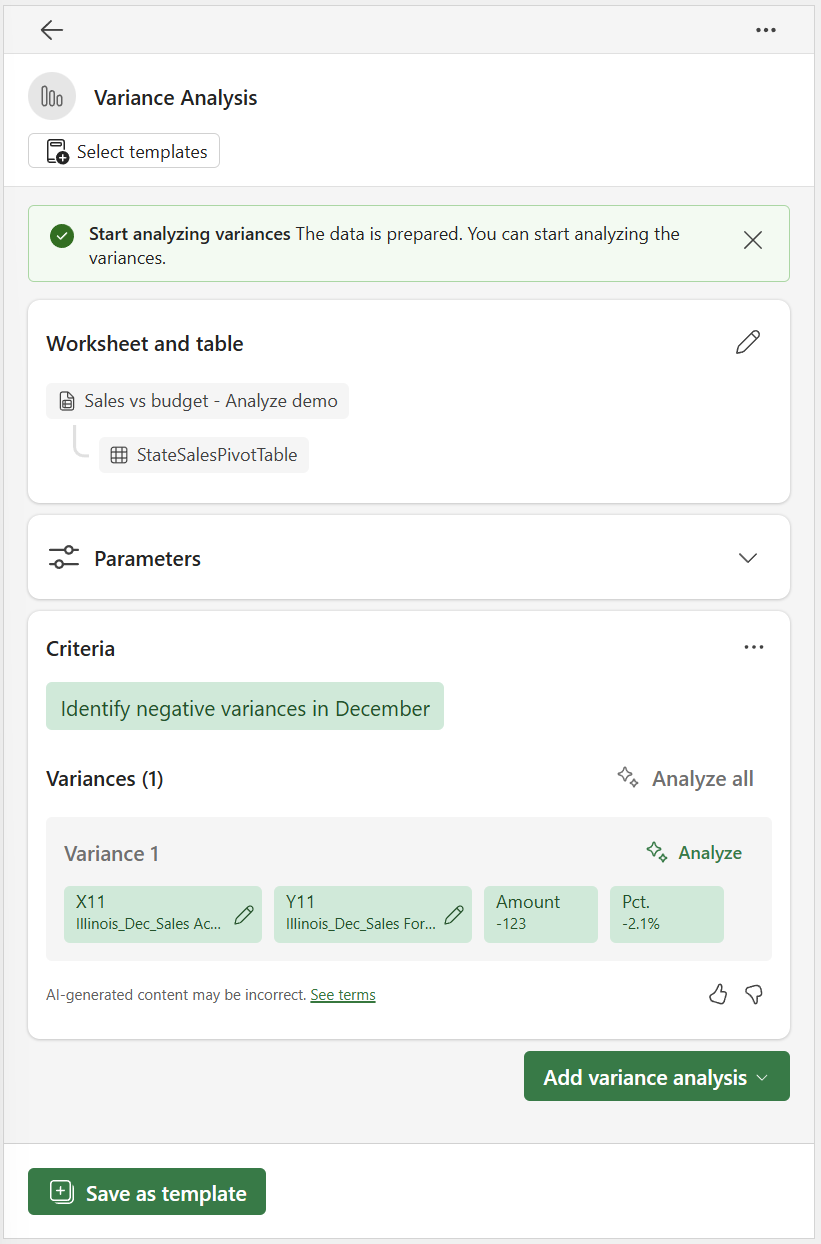
- Analyze all to analyze all results for a given criteria by selecting Analyze all which sits above all of the listed variances.
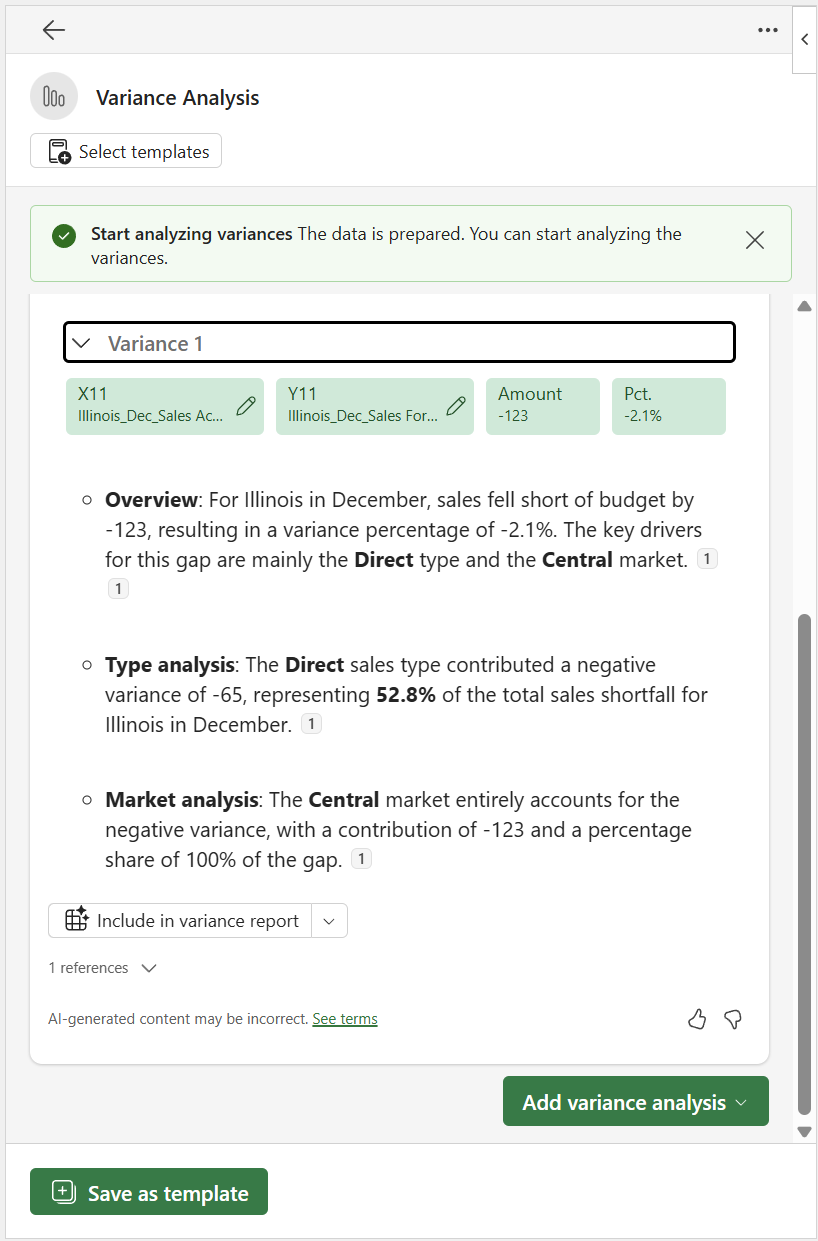
Select the arrow next to the individual variance finding to expand and display the insights.
Editing and publishing results
You can edit the commentary provided by the Copilot. The sidecar saves your edits to the displayed information and includes them in the Copilot-prepared Variance report. Learn more in Variance analysis summary reporting.
To edit the commentary, review the detailed data supporting conclusions for each data source:
Scroll down to the section below the summary and select the drop-down next to Include in variance report.
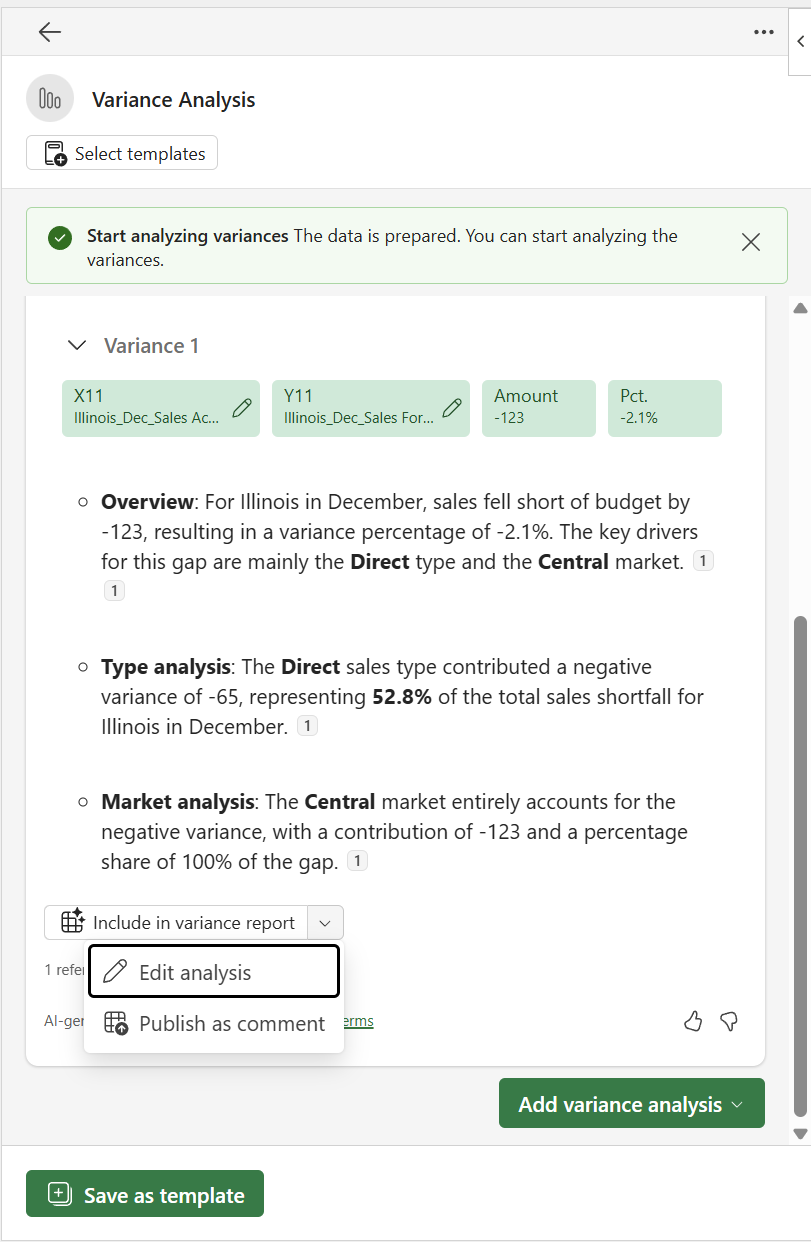
Select Edit analysis.
To save your edits, select Save.
Publishing results as a comment in Excel
You can publish variance results summaries as a comment to the first cell of the specific variance result. Published comments use the native cell comment feature of Excel. You can review published comments by using the Show Comments option in the Review section of the Excel ribbon menu. To publish the comment, select Publish as comment.
View underlying details and references for variance result
To review the detailed data that supports conclusions for each data source:
Scroll down to the section below the summary and expand References.
Select the Create pivot icon to the right of the DataSource.
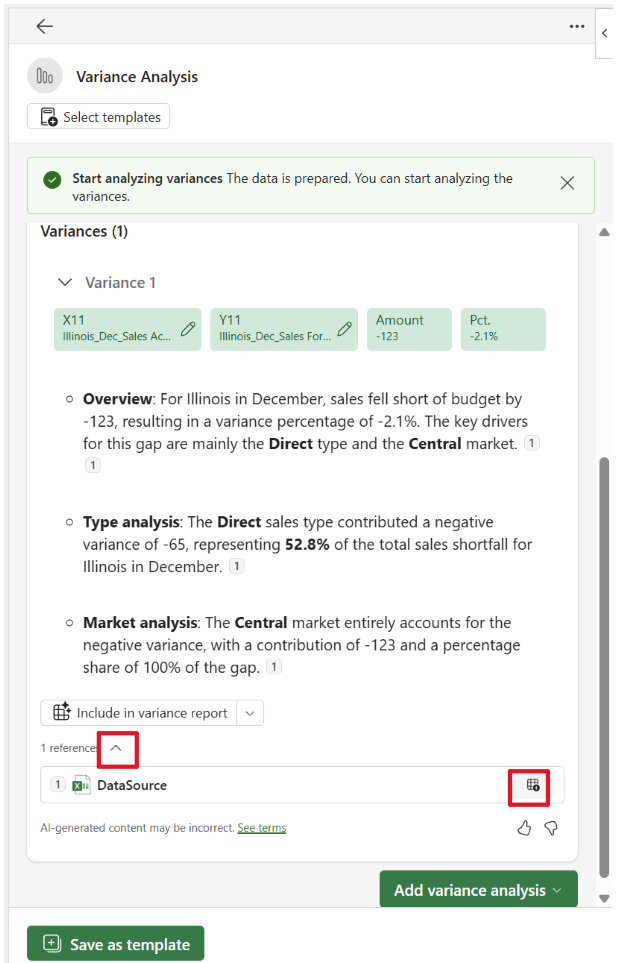
Review the newly created "__variance details" and "__variance analysis" worksheets.
Note
Both sheet names start with a reference to the variance you analyze, such as X15 Y15. The Details sheet shows the subset of data used for analysis after initial filtering. The variance analysis sheet shows pivot tables for all the attributes used to arrive at variance analysis results, including those not presented in the summary. You can conduct further variance analyses on the newly created pivot table.
Add extra criteria
Add extra criteria through another natural language submission by using the Define criteria for variance identification (indicated earlier) or by selecting variances through Select variances for Copilot Analysis (Learn more in the following section).
To help with the reuse of variance analysis criteria, save natural language prompts provided through the Define criteria for variance identification by using templates. Learn more in Use templates to perform variance analyses.
Note
You can't save variances created through Select variances for Copilot Analysis to a template. If you add manually selected criteria through this method, it disables the ability to Save as template. If you delete the manually selected criteria, the Save as template option re-enables.
If you don't need to add extra variance criteria and don't need to save a template, proceed to Variance analysis summary reporting.
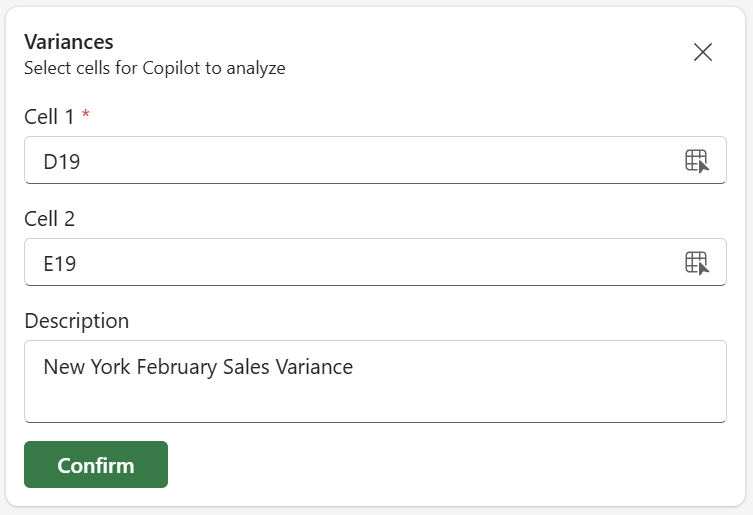
Select variances for Copilot analysis
To manually select variances, follow these steps:
Select Add variance analysis, and then choose Select variances for Copilot analysis from the dropdown.
In the dialog, in Cell 1, type or select cell D19 in the spreadsheet and refer to it. For example, B15. Repeat the same steps for Cell 2 by typing or selecting cell E19 in the spreadsheet.
In the Description field, provide a name or description that describes the intention for the cell selection.
To save the submission and detect the variance, select Confirm.
Select Analyze to view deeper insights for the result.
To the left of the variance to view the findings, select the arrow.
Analyze period-over-period variances
The analyze period-over-period capabilities in the variance analysis feature in Finance Agent use AI-driven capabilities to help you identify and explain financial variances across time periods, such as month-over-month, quarter-over-quarter, or year-over-year comparisons. In addition to surfacing critical variances, the feature identifies the top contributing factors and generates a structured narrative with key insights. This approach allows for more efficient and accurate period-over-period analysis.
Note
The following sections describe how to use the Variance analysis feature in an assistive capacity for period-over-period comparisons. To enable autonomous use, you must first create a template. Learn more in Use templates to perform variance analyses and Create a new AI action for Variance analysis.
Structure your data for period comparisons
Accurate period-over-period variance analysis depends on how you structure your data. Without properly organized time-series data, the feature can't reliably identify deviations between periods. The structure of your pivot table columns determines how the feature groups and compares periods. The following suggested guidelines help ensure accurate results:
| Comparison type | How to structure columns | Example column names |
|---|---|---|
| Month-over-month | One column per month | Jan 2025, Feb 2025, Mar 2025 |
| Quarter-over-quarter | One column per month, compared in groups of 3 or quarters separately stated | Jan 2025, Feb 2025, ..., Dec 2025 |
| Year-over-year | One column per month, compared in groups of 12 or stated years | Jan 2024, ..., Dec 2024, Jan 2025, ..., Dec 2025 |
| Custom periods | Group any set of columns together | H1 2024, H2 2024, H1 2025 |
The feature supports several period comparison approaches:
Sequential period-over-period comparison
Use this approach when you want the feature to automatically group ordered time columns and compare consecutive periods.
Example prompts:
- "Compare each month to the prior month"
- "Show year-over-year variance by quarter"
- "Identify the top five variances quarter-over-quarter"
The feature detects the ordered period columns in your pivot table (for example, Jan 2025, Feb 2025, Mar 2025, ...), groups them according to the period size you specify, and compares consecutive groups. For year-over-year analysis across monthly columns, it automatically groups 12 months at a time.
Note
If multiple column sets are available for comparison, be specific in your criteria. For example, "Compare Q1 2025 to Q1 2024" rather than "compare quarters" to ensure the correct period columns are selected.
Specific period group comparison
Use this approach when you want to compare explicitly specified, nonsequential periods - for example, H1 vs H2, Q1 vs Q3, or a specific quarter against its prior-year equivalent.
Example prompts:
- "Compare H1 2025 to H2 2024"
- "Show variance between Q1 2025 and Q1 2024"
- "Compare this year's Q3 to last year's Q3"
Period over Period results appears in the sidecar. You can analyze results by following the existing instructions for analyzing variances.
Note
Unlike non-Period over Period analyses, the results for these types of criteria aren't highlighted in the pivot table contained in the data. They're only displayed in the sidecar.