Expression-based titles in Power BI Desktop
APPLIES TO: ![]() Power BI Desktop
Power BI Desktop ![]() Power BI service
Power BI service
You can create dynamic, customized titles for your Power BI visuals. By creating Data Analysis Expressions (DAX) based on fields, variables, or other programmatic elements, your visuals' titles can automatically adjust as needed. These changes are based on filters, selections, or other user interactions and configurations.
Creating dynamic titles, sometimes called expression-based titles, is straightforward.
Create a field for your title
The first step in creating an expression-based title is to create a field in your model to use for the title.
There are all sorts of creative ways to have your visual title reflect what you want it to say or what you want to express. Let's take a look at a couple of examples.
You can create an expression that changes based on the filter context that the visual receives for the product's brand name. The following image shows the DAX formula for such a field.
![Screenshot showing the DAX formula: Line chart title = "Units by Time and Class for " & SELECTEDVALUE(Sales[BrandName]).](media/desktop-conditional-formatting-visual-titles/expression-based-title-02.png)
Another example is using a dynamic title that changes based on the user's language or culture. You can create language-specific titles in a DAX measure by using the USERCULTURE() function. This function returns the culture code for the user, based on their operating system or browser settings. You can use the following DAX switch statement to select the correct translated value.
SWITCH (
  USERCULTURE(),
  "de-DE", “Umsatz nach Produkt”,
  "fr-FR", “Ventes par produit”,
  “Sales by product”
)
Or, you can retrieve the string from a lookup table that contains all the translations. You place that table in your model.
These are just a couple of examples you can use to create dynamic, expression-based titles for your visuals in Power BI Desktop. What you can do with your titles are limited only by your imagination and your model.
Select your field for your title
After you've created the DAX expression for the field you create in your model, you need to apply it to your visual's title. To select the field and apply it:
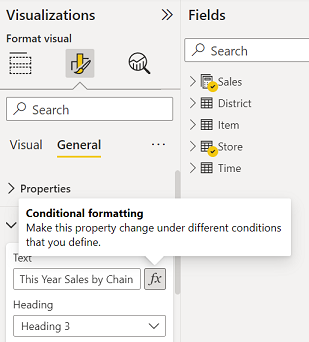
Go to the Visualizations pane. In the Format area, select the General tab, and then set Title to On to show the title options for the visual.
Next to the Title text, select Conditional formatting (fx).
The Title text - Title dialog box appears.
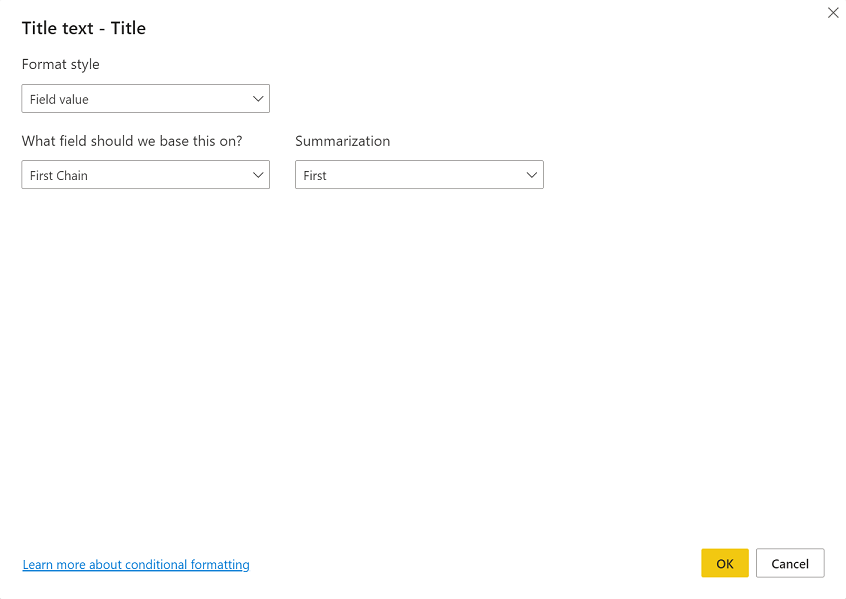
From the dialog box, select the field that you created to use for your title, and then select OK.
Considerations and limitations
There are a few limitations to the current implementation of expression-based titles for visuals:
- Expression-based formatting isn’t currently supported on Python visuals, R visuals, or the Key Influencers visual.
- The field you create for the title must be a string data type. Measures that return numbers or date/time (or any other data type) aren't currently supported.
- Expression based titles aren't carried over when you pin a visual to a dashboard.
- Conditional formatting can only use measures defined in the underlying model and can't use measures locally created in a report (semantic model connection).
Related content
This article described how to create DAX expressions that turn the titles of your visuals into dynamic fields that can change as users interact with your reports. You might find the following articles useful as well.