Create a Q&A visual in a report in Power BI
APPLIES TO: ![]() Power BI Desktop
Power BI Desktop ![]() Power BI service
Power BI service
The Q&A visual allows users to ask natural language questions and get answers in the form of a visual. Business users can use the Q&A functionality to quickly get answers from their report data. Designers can use the Q&A features to quickly create visuals. If you're a report designer, this article is for you. You can double-click anywhere on a report and use natural language to get started.
In this article, you create, format, and customize a Q&A visual. This visual type supports themes and other default formatting options available in Power BI. After you create the visual and save the report, the Q&A visual is available to your report users. Report users use the Q&A visual to ask questions about the data in the report, and see the answers to those questions in the form of charts and graphs. The one Q&A visual can be used over and over again. If the end user has edit permissions, they can save the charts and graphs as standalone visuals in the report. If the end user doesn't have edit permissions, they can use the Q&A visual to explore the report data but can't save the answers to their questions (in the form of charts and graphs) to the report. The Q&A visual behaves like any other Power BI visual and supports cross-filtering, cross-highlighting, and bookmarks.
The following demonstration video shows how to ask questions and use suggestions with the Q&A visual in Power BI. When Power BI successfully interprets the question, it displays the corresponding data as the answer. When you select a column or data point in the Q&A visual, Power BI cross-highlights and cross-filters the related data in other visuals in the report.
If you're looking for more background about Q&A in Power BI, see Introduction to Power BI Q&A.
The Q&A visual consists of four core components:
- Q&A question field: Enter your question in this box to see possible answers and suggestions from Power BI.
- Suggestions: Choose a question from a prepopulated list of suggestions generated by Power BI.
- Convert icon: Select this icon to convert the Q&A visual into a standard visual.
- Gear icon: Select this icon to open the Q&A Tooling pane, which allows designers to configure the underlying natural language engine.
Prerequisites
Review the following prerequisites for using the Q&A visual in Power BI Desktop or the Power BI service.
This tutorial uses the Sales and Marketing Sample .pbix file.
Download the Sales and Marketing Sample PBIX file to your desktop.
In Power BI Desktop, select File > Open report.
Browse to and select the Sales and Marketing Sample .pbix file, and then select Open.
The Sales and Marketing Sample .pbix file opens in report view.

At the bottom, select the green plus symbol
 to add a new page to the report.


Note
If you want to share your report with a colleague, you both need to have individual Power BI paid licenses. If both parties don't have individual Power BI paid licenses, the report needs to be saved in Premium capacity to enable sharing. For more information, see sharing reports.
Create a Q&A visual with a suggested question
In this exercise, we select a suggested question from Power BI to create a custom Q&A visual.
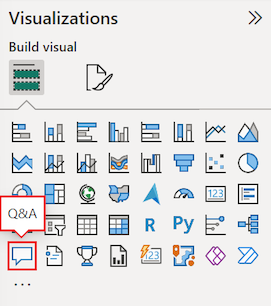
Start on a blank report page and select the Q&A visual icon on the Visualizations > Build visual pane.
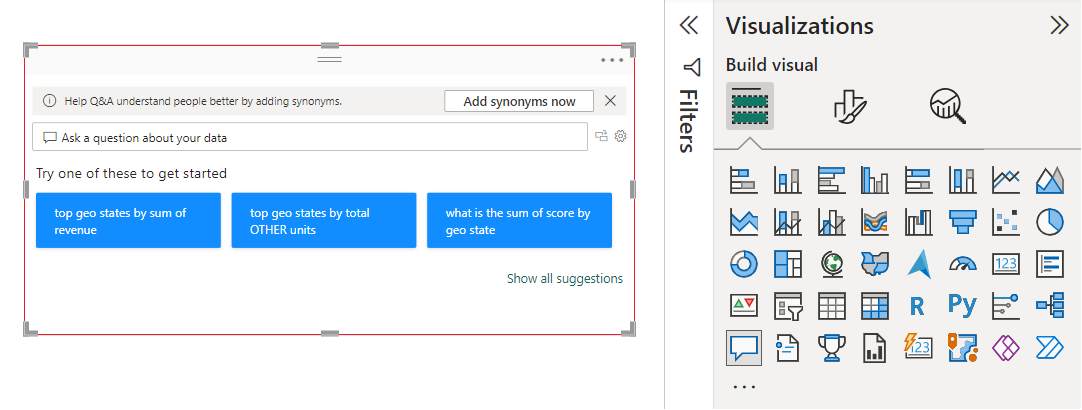
Power BI creates a new Q&A visual and supplies several Q&A suggestions to get you started, such as top geo states by total OTHER units.
Select the Q&A visual and drag the border to resize the visual.
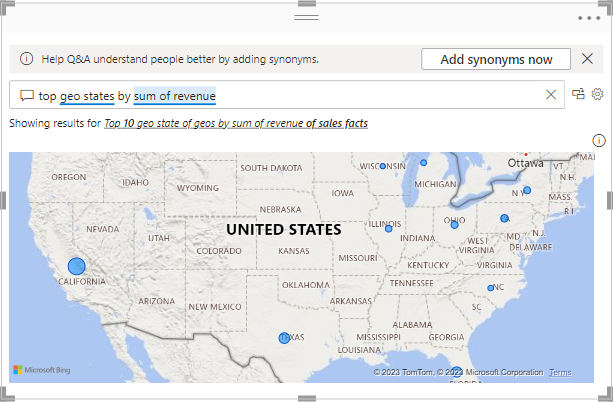
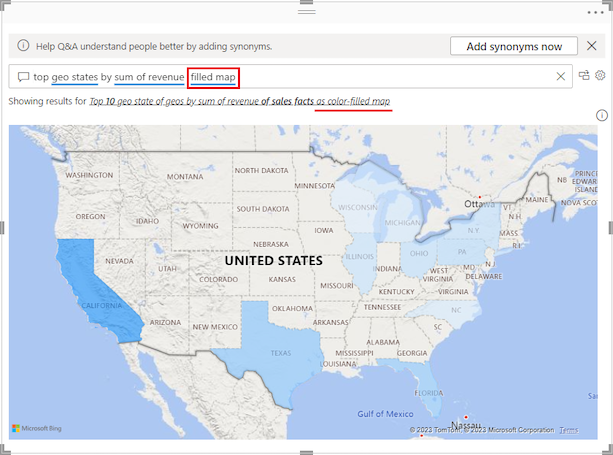
To customize your visual, select a suggested question or enter text in the Q&A question field, where it says Ask a question about your data. In this example, we select the suggestion top geo states by sum of revenue.
Power BI determines the appropriate visual type based on the selected suggestion or entered text. In our example, Power BI determines that a map visual is best suited to display the data.
You can also instruct Power BI to use a specific visual type by adding the type to the text you enter in the Q&A question field.
Keep in mind that not all visual types are useful for presenting all types of data. Certain visuals only make sense for specific types of data. For example, the data in our example isn't meaningful when presented on a scatter chart, but it's helpful when shown as a filled map.
Create a Q&A visual with a natural language query
In the previous example, you selected a suggested question from Power BI to create a custom Q&A visual. In this exercise, you enter your own question. As you enter your question text, Power BI assists you with autocompletion by showing suggestions and providing text feedback.
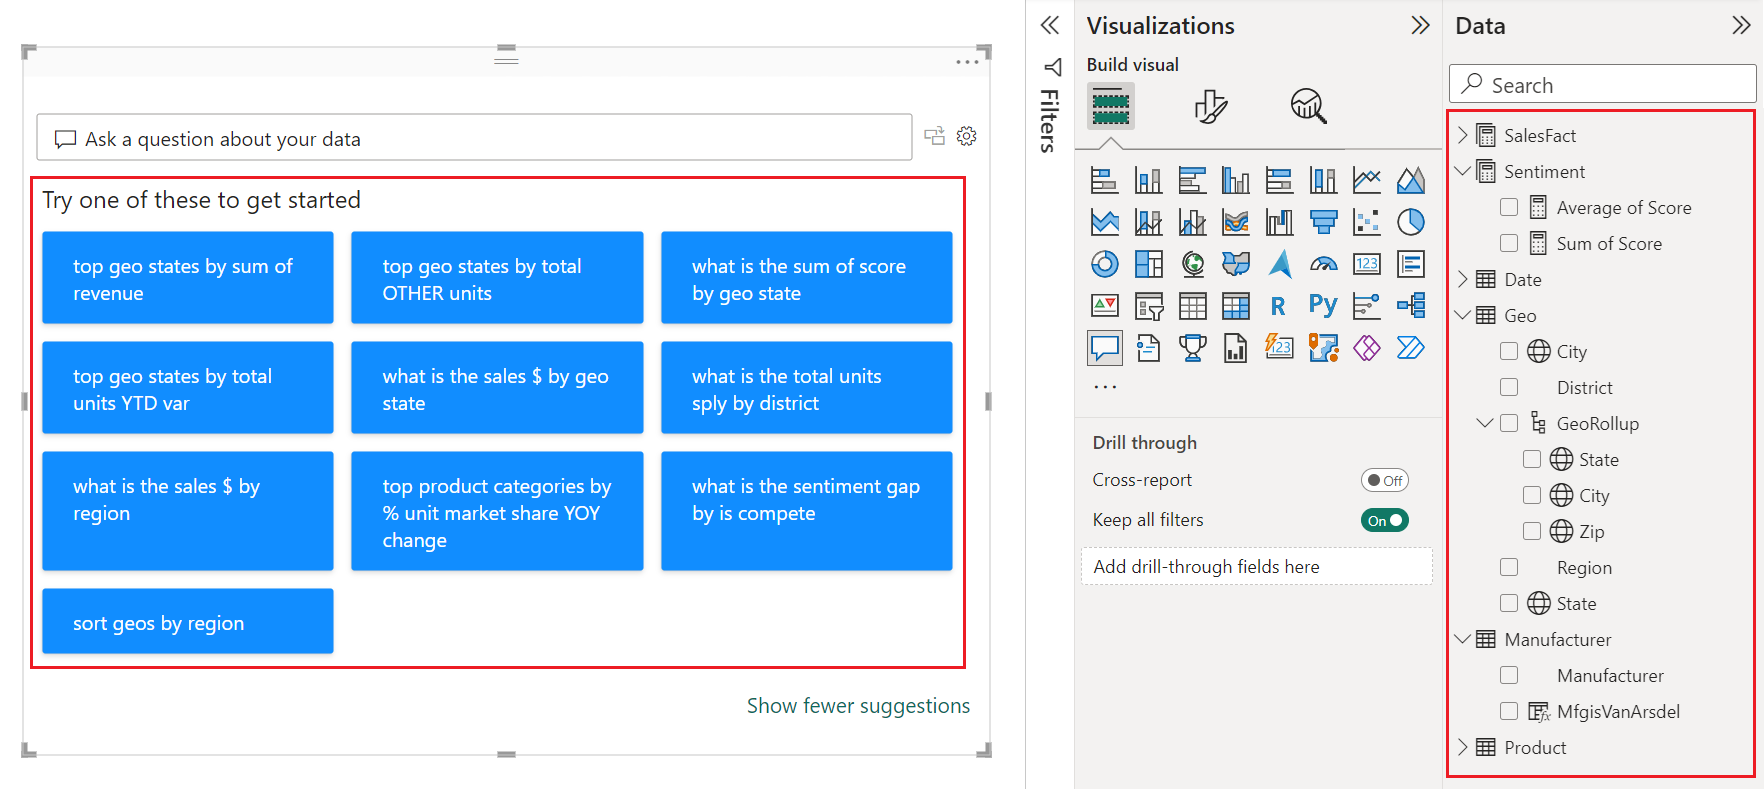
If you're unsure what question to ask or what text to use, select the Show all suggestions link on the report canvas to see all the suggestions from Power BI. Another approach is to scan the data fields in the Data pane. You can get ideas for specific topical questions to ask and unique terms for the semantic model to use in your query.
The following image shows the report canvas with all Power BI suggestions visible and some of the Data pane fields expanded. After you select the link to see all suggestions from Power BI, the link option changes to show fewer suggestions.
Start to enter a question in the Q&A question field.
As you enter text, Power BI adds a red double underline to words it doesn't recognize. When possible, Power BI helps define unrecognized words. The following example shows suggestions from Power BI for an unrecognized term. The last two suggestions can satisfy our intended question.
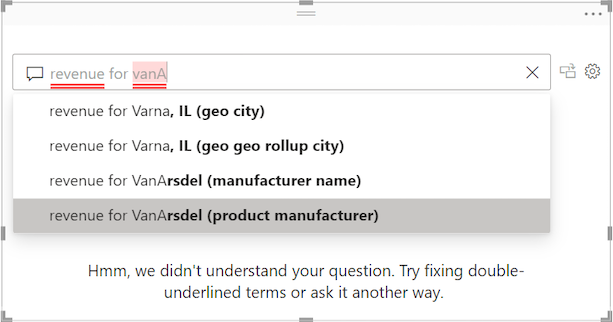
Let's choose the last suggestion in the list.
Enter more text for the current question.
As you enter more text for the question, Power BI lets you know when it doesn't understand the question and tries to help. In this example, Power BI suggests a different way to word the question by using terminology from the semantic model. The suggested terms are underlined in blue.
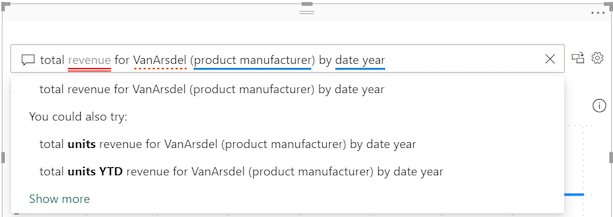
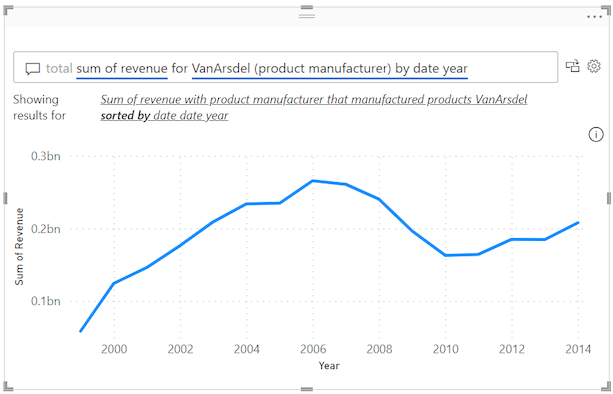
With Power BI's help, we're able to ask a question with all recognizable terms. Power BI displays the results as a line chart.
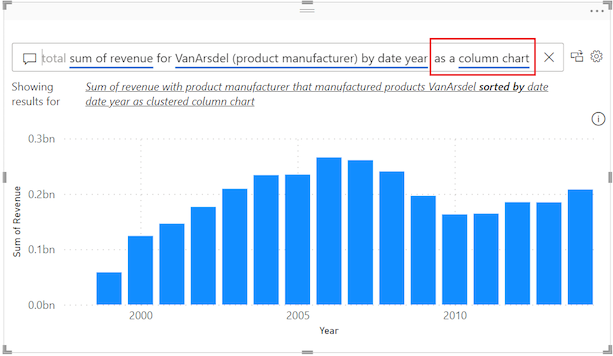
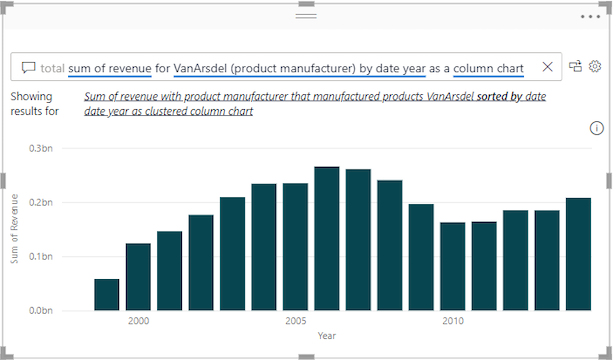
Instruct the Q&A visual to show the data in columns by adjusting your question. At the end of your current query, enter the text "as a column chart."
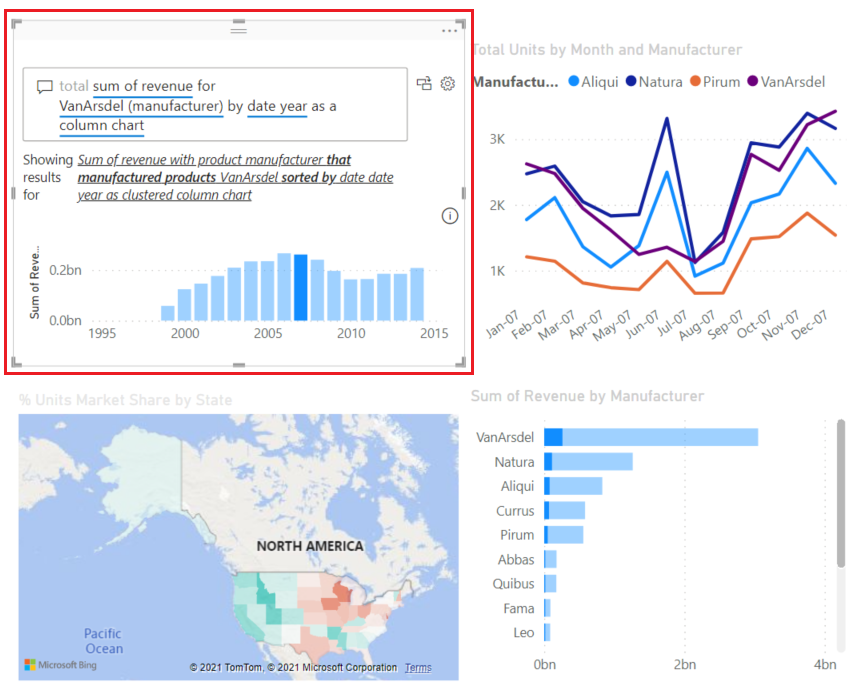
Add more visuals to the report canvas and see how the Q&A visual interacts with the other visuals on the page.
In the following example, we have a line chart, column chart, map, and bar chart. Power BI cross-filters the line chart and map, and cross-highlights the bar chart.
Format and customize the Q&A visual
The Q&A visual can be customized by using options on the Visualizations > Format visual pane, and by applying a theme.
Apply a theme
When you select a theme, the theme is applied to the entire report page. There are many themes to choose from. Explore the themes and test them on your report to find a presentation that works well for your semantic model and users.
On the Power BI menu bar, select View, and then select the Themes drop-down menu.
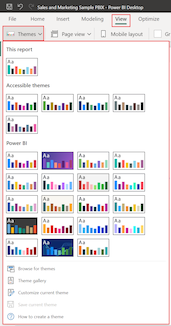
The current theme for This report is shown at the top. Our current theme is "Classic."
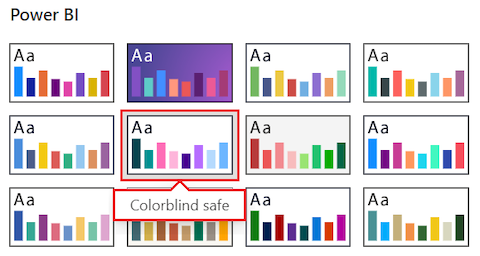
Let's change the theme for our report. In the Themes > Power BI section, select the Colorblind safe theme. This theme colors all elements in the visual to help ensure all content is readable for people with color blindness.
Power BI updates the report view to use the color-blind safe theme:

Format the Q&A visual
Power BI lets you format the Q&A visual, including the Q&A question field and how to display suggestions. You can change everything from the background of a title to the hover color for unrecognized words.
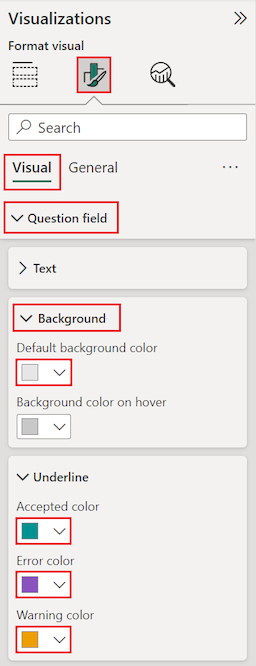
Select the paintbrush icon to open the Visualizations > Format visual pane, and select the Visual section. Scan the options on the pane.
In this example, we configure settings in the Question field section. We add a gray background for the text that appears in the Q&A question field and change the underline colors for accepted and unrecognized terms.
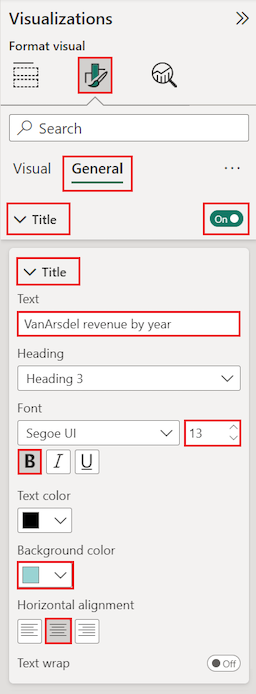
Now select the General section on the Visualizations > Format visual pane, and scan the options.
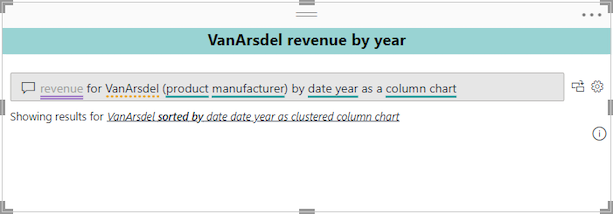
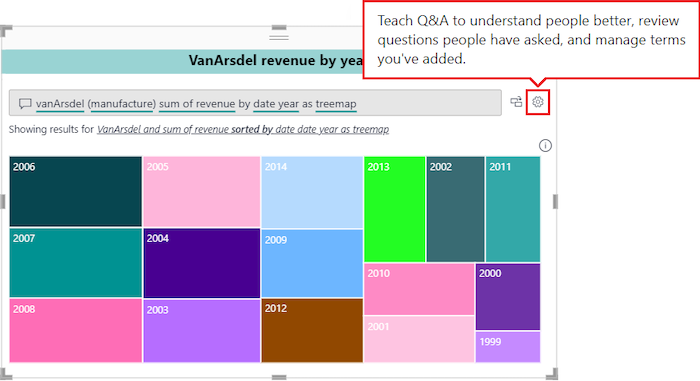
In this example, we adjust settings in the Title section. We add the title "VanArsdel revenue by year" and center the text on a cyan blue background.
Here's what our updates look like in the Q&A visual on the report canvas. An unrecognized term "revenue" is shown with a double underline in purple. Power BI indicates a warning for the term "VansArsdel" by applying the dotted underline in orange. Accepted terms are underlined in cyan blue.
Convert your Q&A visual into a standard visual
At this point, you have a Q&A visual that displays data as a column chart. In our example, we added a custom title and custom coloring, and applied the color-blind safe theme. Now you're ready to convert your work into a standard visual in your report. After you have a standard visual, you can pin the visual to a dashboard in the Power BI service.
At the top right of the Q&A visual, select the convert icon
 to turn the Q&A result into a standard visual.
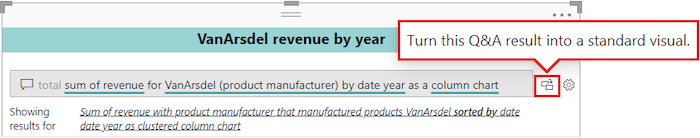
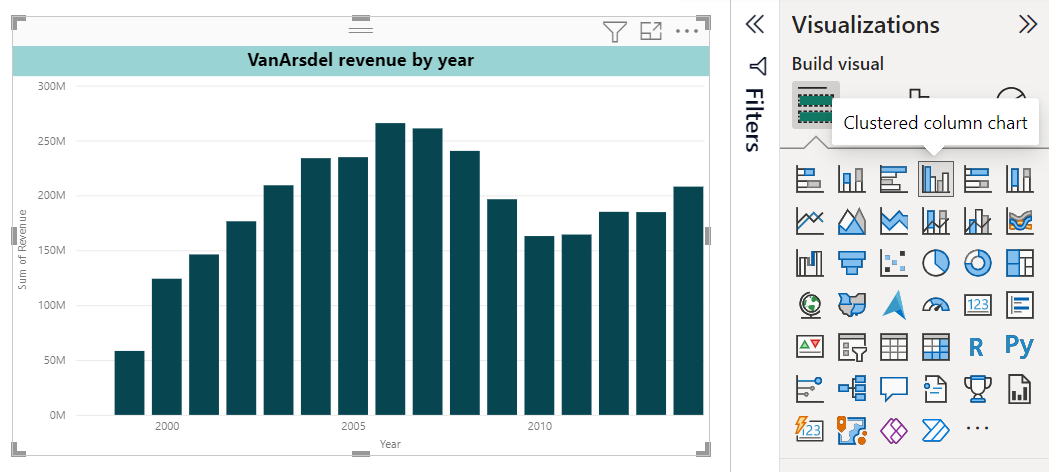
After Power BI completes the conversion, your visual is no longer a Q&A visual. It's now a standard column chart that can be pinned to a dashboard. In your report, this new visual behaves the same as other standard visuals.
Select the converted visual and notice the change to the Visualizations pane. The standard visual is a Column chart and not a Q&A visual.
In the Power BI service (
app.powerbi.com), you can pin the standard visual to a dashboard by selecting the pin icon.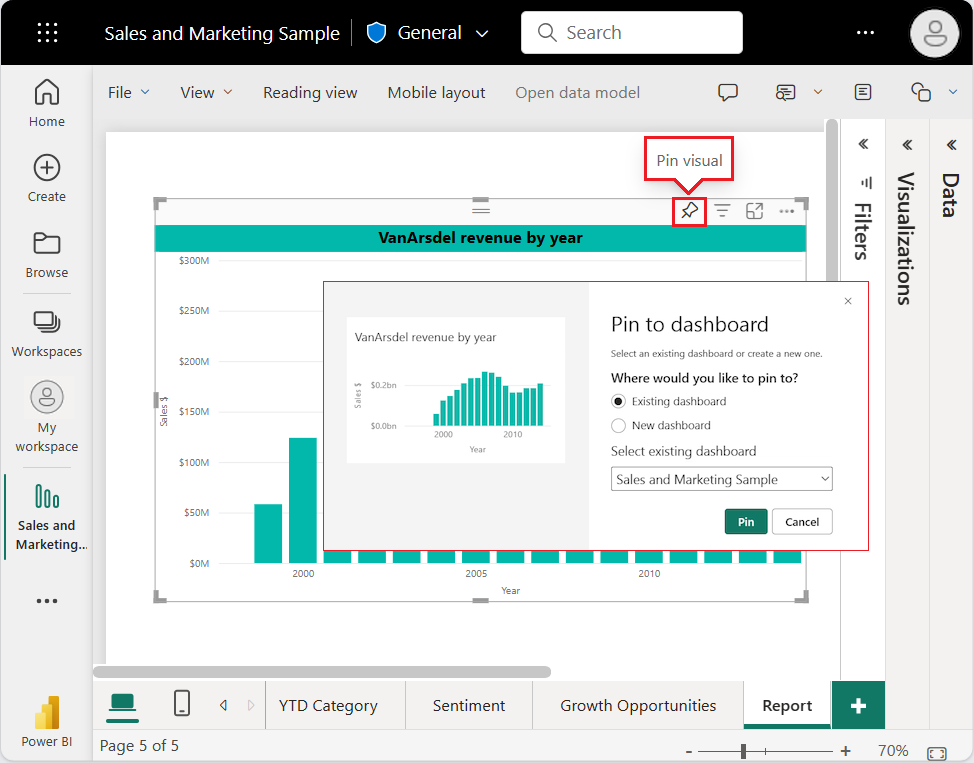
Advanced features of the Q&A visual
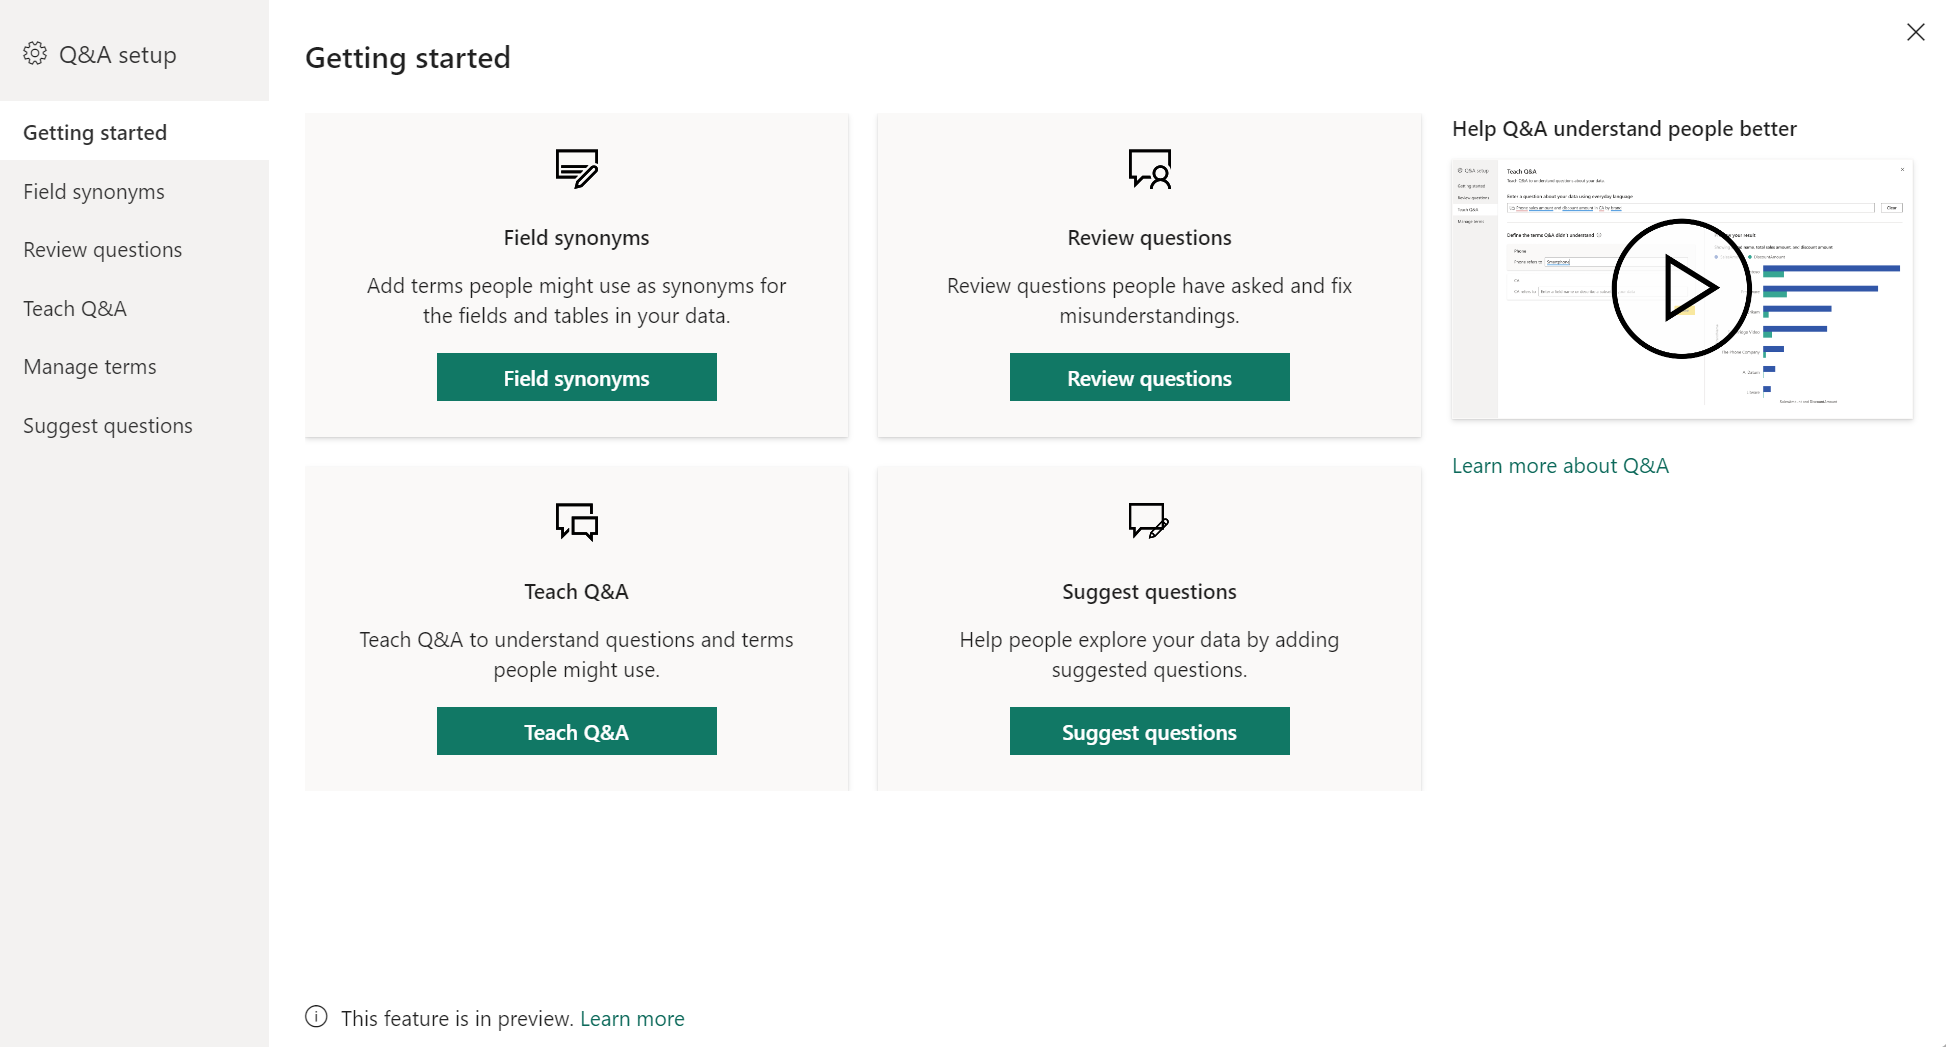
To access advanced features for your Q&A visual, select the gear icon ![]() at the top right to open the Q&A Tooling pane.
at the top right to open the Q&A Tooling pane.
Use the Tooling pane to teach Q&A terms it doesn't recognize, how to manage those terms, and how to manage the suggested questions for this semantic model and report. In the Tooling pane, you can also review questions users have asked in this Q&A visual and see questions flagged by users. For more information, see Intro to Q&A tooling to train Power BI Q&A.
Considerations and troubleshooting
Keep in mind the following points when creating Q&A visuals in Power BI.
If you encounter an error when creating a Q&A visual, check the Q&A limitations article. Confirm your data source configuration is supported.
The Q&A visual integrates with Microsoft Office and Bing to attempt to match unrecognized common words with fields in your semantic model.
Related content
There are several ways you can integrate natural language with Q&A in Power BI. For more information, see the following articles:
Feedback
Coming soon: Throughout 2024 we will be phasing out GitHub Issues as the feedback mechanism for content and replacing it with a new feedback system. For more information see: https://aka.ms/ContentUserFeedback.
Submit and view feedback for