Nota
El acceso a esta página requiere autorización. Puede intentar iniciar sesión o cambiar directorios.
El acceso a esta página requiere autorización. Puede intentar cambiar los directorios.
There are certain situations when your Java web application is not performing as you expect it to. To understand where the problem lies, you may need to profile your application and understand its behavior for different flows.
Azure App Service environment being a sandbox environment, does not support to install JProfiler and not even expose the JMX information, which can be read by Jconsole to profile your application. The way to profile you application on Azure App Service environment is by using the New Relic tool.
Follow these steps -
1. Create a New Relic APM account on Azure portal.
[caption id="attachment_1303" align="alignnone" width="909"]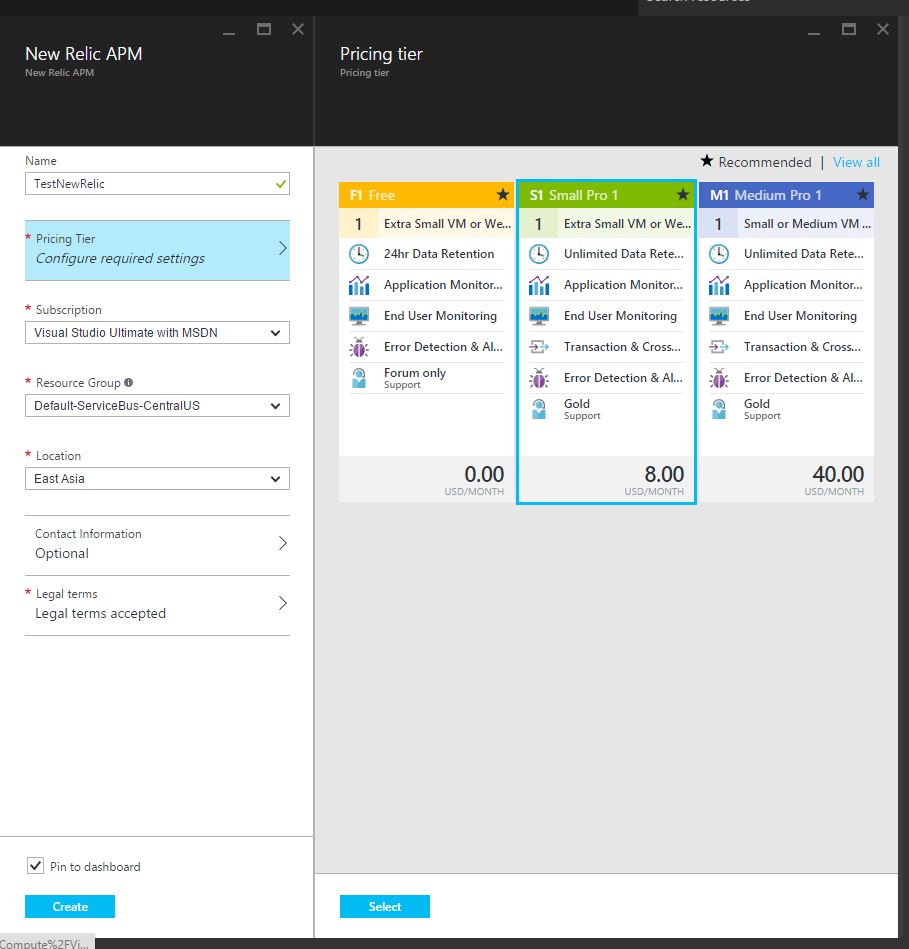 New Relic account[/caption]
Make sure you select at least the Small Pro in the pricing tier.
2. Open the New Relic APM and click on the View at New Relic link as highlighted.
[caption id="attachment_1312" align="alignnone" width="247"]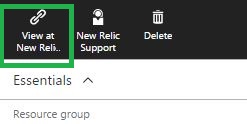 View at New Relic[/caption]
3. Click on Browser and Install a New Relic APM agent.
[caption id="attachment_1321" align="alignnone" width="927"]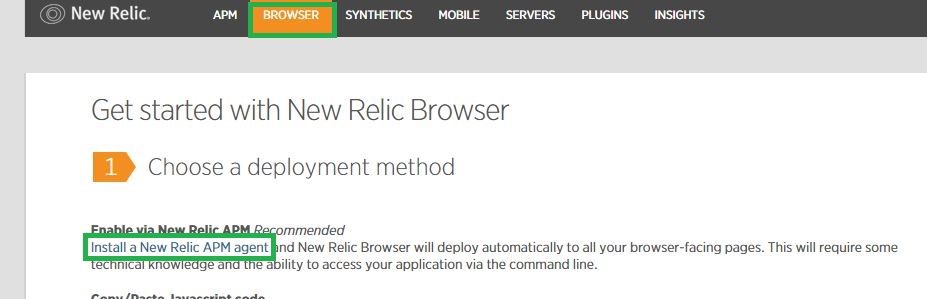 New Relic Java agent[/caption]
4. Select "Java" and then Download the Java agent mentioned at step 2.
5. Unzip the downloaded file and copy the newrelic folder to your wwwroot folder or any folder within your application.
[caption id="attachment_1322" align="alignnone" width="493"]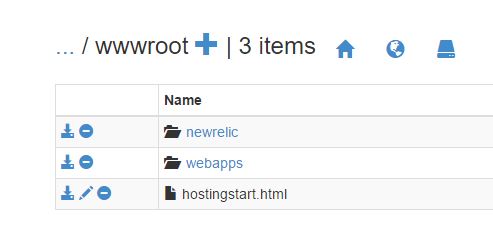 newrelic folder[/caption]
6. Add the Application Settings for CATALINA_OPTS in your webapp on Azure Portal with value as
-Djavaagent:"D:\home\site\wwwroot\newrelic\newrelic.jar" .
Make sure you modify the path accordingly.
Note - Please add the letter "D" before javaagent only if you are using Tomcat 8 or earlier. For Tomcat 8.5 onwards, don't use the letter "D" before javaagent.
[caption id="attachment_1332" align="alignnone" width="881"]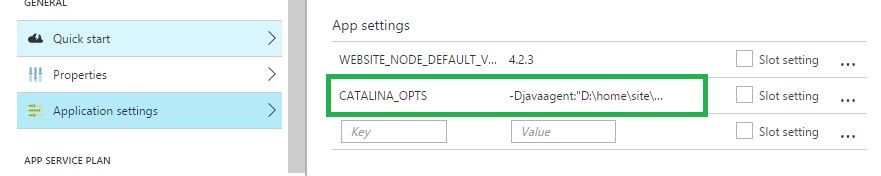 App Setting for Catalina options[/caption]
7. Once your website is accessed, you should see the JVM listed on your New Relic Dashboard.
[caption id="attachment_1341" align="alignnone" width="344"]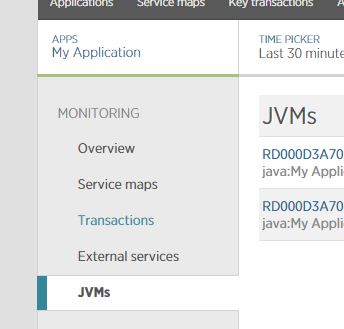 New Relic Dashboard with JVMs info[/caption]
8. Using the Profile JVM link, you can profile your Java process and take thread dumps.
[caption id="attachment_1361" align="alignnone" width="907"]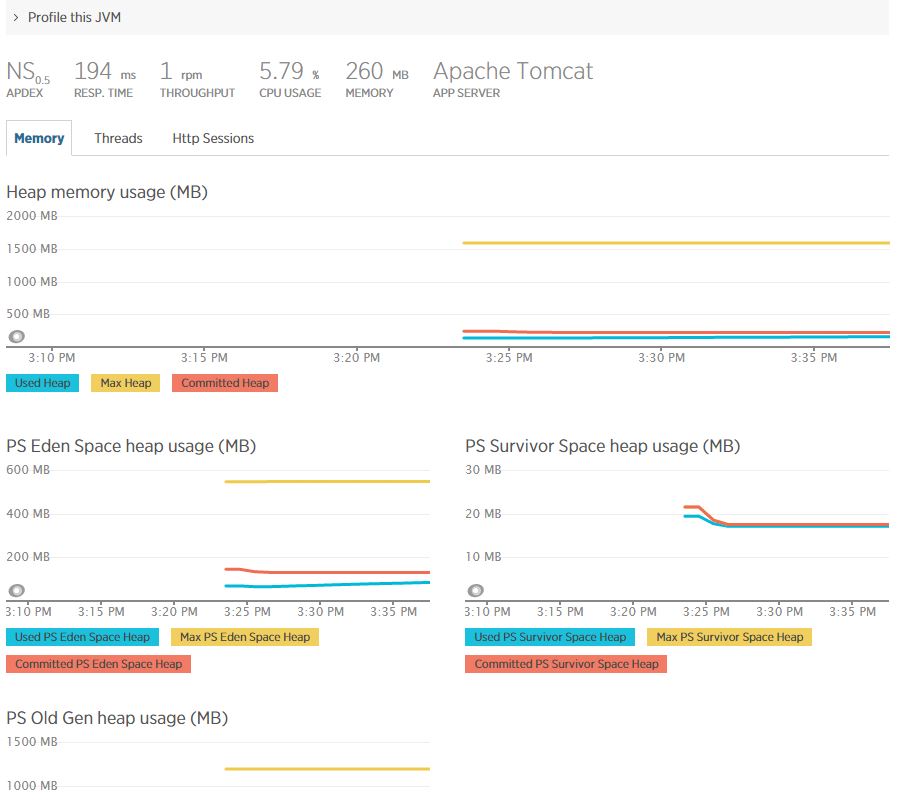 JVM Information[/caption]
Sample Profiled data
[caption id="attachment_1371" align="alignnone" width="1532"]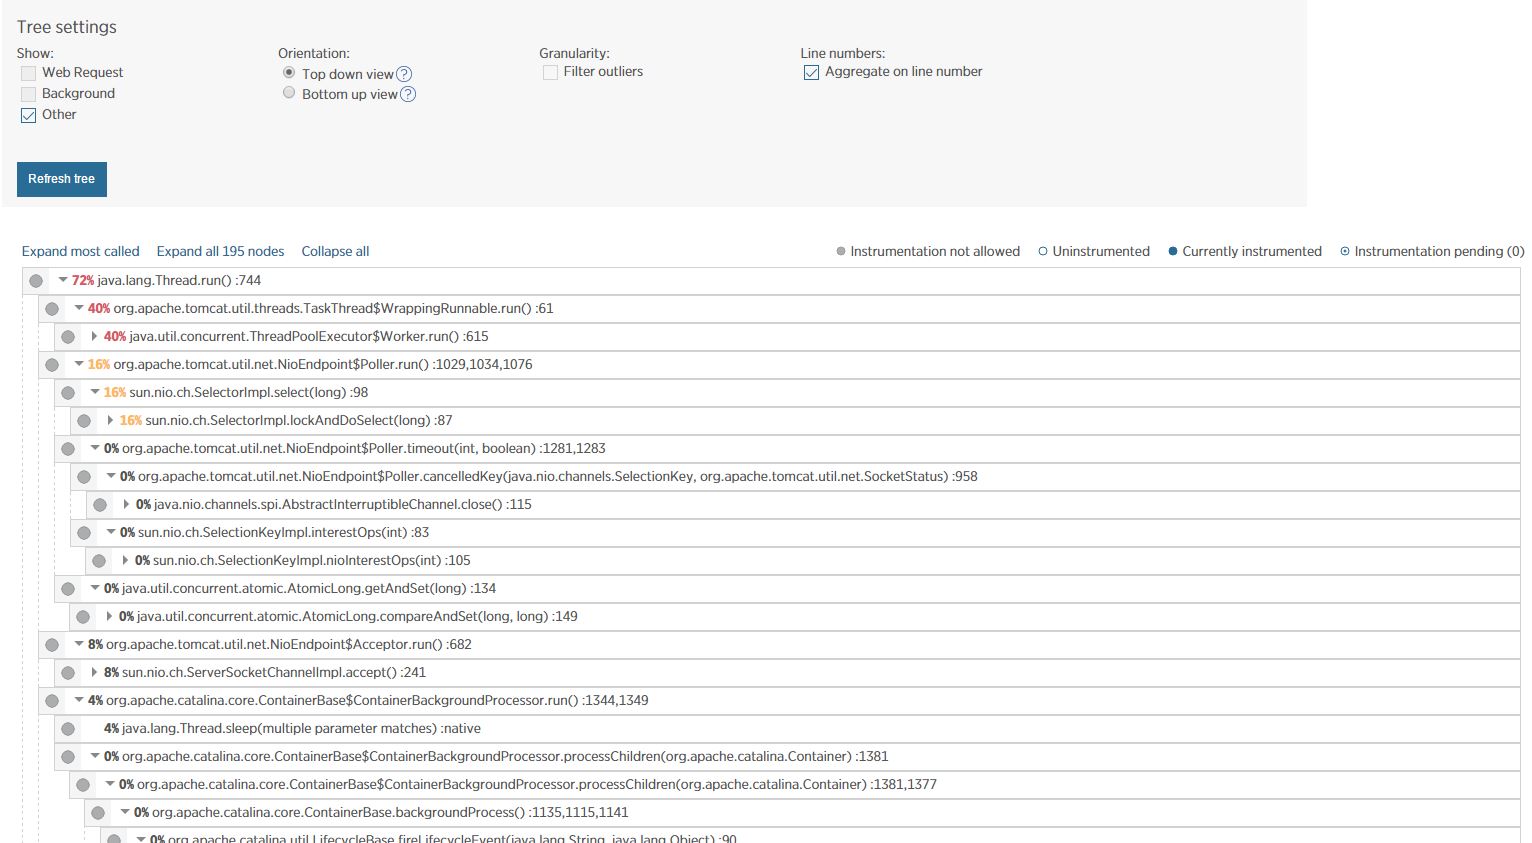 Tree View for Profiled data[/caption]
Hope this helps you debugging issues with your webapp!
Comments
- Anonymous
July 26, 2016
Hello,I would like to mention that I had to change CATALINA_OPTS valuefrom -Djavaagent:"D:\home\site\wwwroot\newrelic\newrelic.jar"to -javaagent:"D:\home\site\wwwroot\newrelic\newrelic.jar"in order to be able to use New Relic.(Note that the starting "D" is dropped).Regards.- Anonymous
August 27, 2016
what about license key or any other configuration? no any other setting?my app does not work after following your post mmm- Anonymous
March 07, 2017
Thanks @Pablo. I edited the post to accommodate the letter "D" addition in the value. @Kang - You can check your catalina logs to understand if the correct parameter is being passed on or not.
- Anonymous
- Anonymous
- Anonymous
August 27, 2016
I have a question, how about license key? or any other configuration doesnt need to be done ?my app doesnt work after i followed your post- Anonymous
September 08, 2016
Hello Kang,Thanks for your comments. The license key will be present in the jar that you downloaded from New Relic. Hope this helps!
- Anonymous