Steps to Log all .net Exceptions to a Log file with DebugDiag 1.2
These steps were written for DebugDiag 1.2.
Steps to do this with DebugDiag 2.0 can be found here:
Sometimes it's good to know what exceptions a process like w3wp.exe is throwing. ASP.net is pretty good about making its complaints known in the form of exceptions. Many or perhaps most exceptions can be ignored. But if you're trying to troubleshoot a mysterious problem that isn't leaving clues in the event logs, this may be a good way to begin to unravel the problem. Sometimes you can see them logged in the Application event log—but usually not. Sometimes you can see them in the ULS logs of SharePoint servers—but usually not. You could get the developer can add some additional instrumentation to the code to log the exceptions to a log file. Or you might use Todd Carter's SNAP tool to see what .net exceptions are being thrown. Or you can, as I'll suggest here, try to use Debug Diagnostics 1.2 to log all .net exceptions to its log file while reproducing a problem.
Launch Debugdiag from the Programs Menu
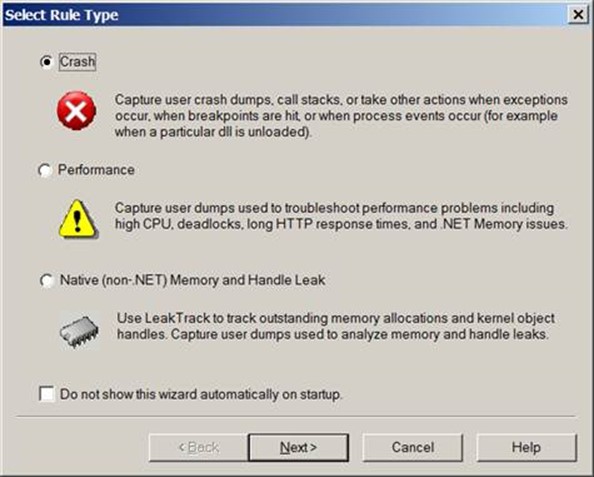
Select "Crash" as the rule type
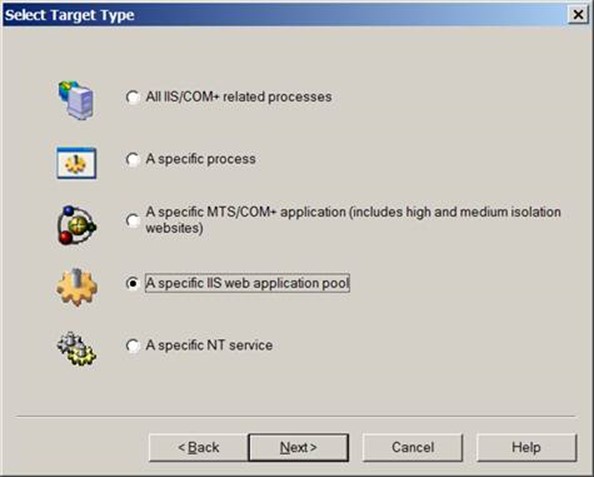
Assuming you're troubleshooting a problem that is occurring in an IIS/ASP.net process, try to select
"A Specific IIS Web Application Pool"
If you know which application pool to focus upon.
If you need to figure out which w3wp.exe matches which IIS Application Pool,
you can visit the processes tab of DebugDiag to get this information.

If you're not sure which IIS process to focus on, you can select
"All IIS/Com+ related processes."
If it's not an IIS process but another process throwing .net exceptions, you can select
"A specific process"
In this demo I'm selecting a specific AppPool and clicking Next.
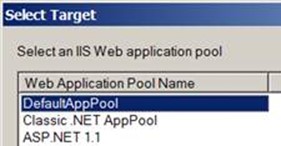
Select the AppPool to focus on and click Next again
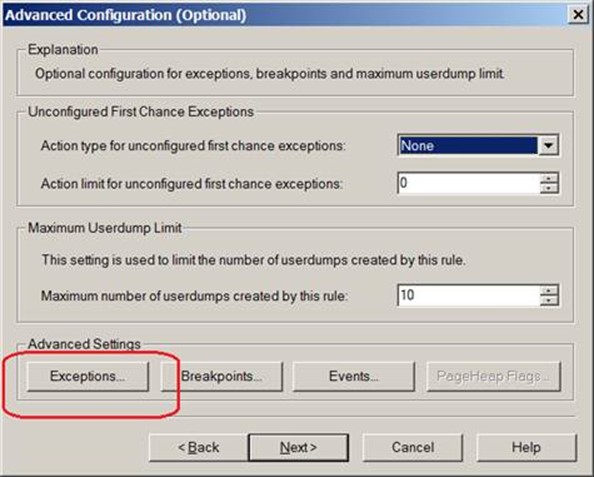
Select the Exceptions button
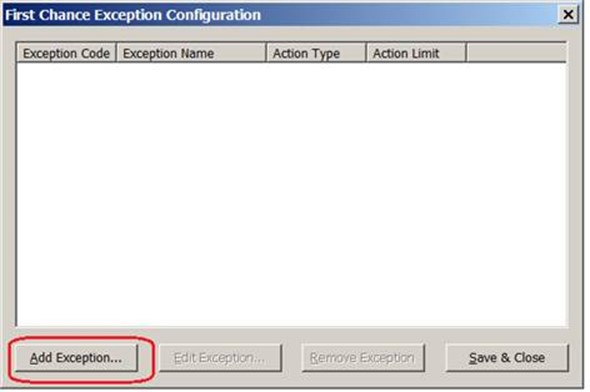
Select the Add Exception button
Highlight the Exception Code E0434F4D in the left pane.
This assumes that the web application we're troubleshooting is written in asp.net 2.0, 3.5, 1.1 or 1.0.
(But if it's asp.net 4.0, select the E0434352 code of course.)
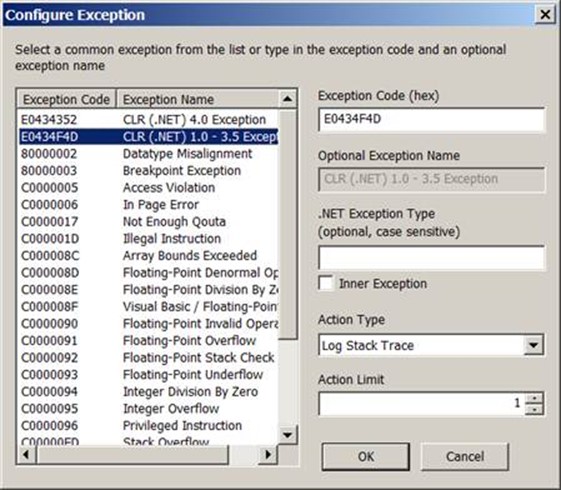
For now, let's keep the exception type blank,
Keep the action type set to "Log Stack Trace,"
And bump the Action Limit up from 1 to some high number – 9999, for example.
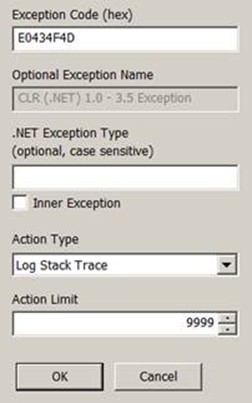
Click OK
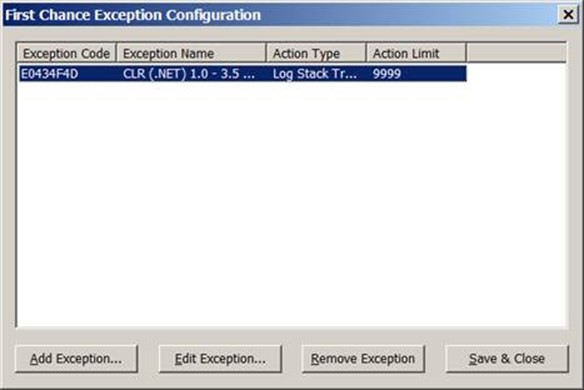
Click the "Save and Close" button.
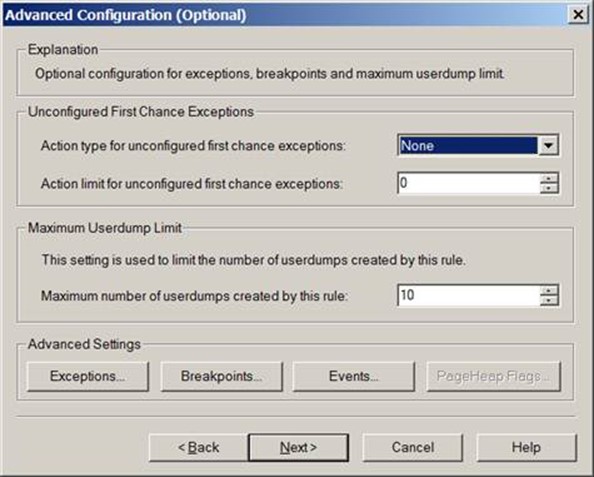
On the Advanced Configuration (Optional) window, simply click NEXT.
There is no need to make changes here.
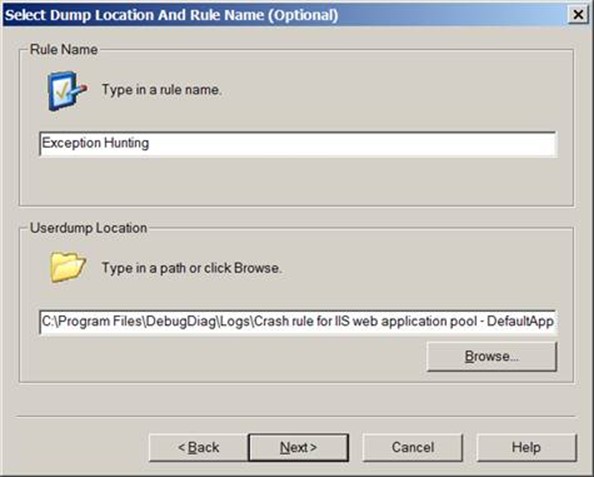
On the Select Dump Location and Rule Name window, feel free to change the rule name and the userdump location.
Neither is relevant at this point. No userdumps will be created as things are so far configured.
And the logfiles that are produced will probably go to C:\Program Files\DebugDiag\Logs regardless.
Click Next.
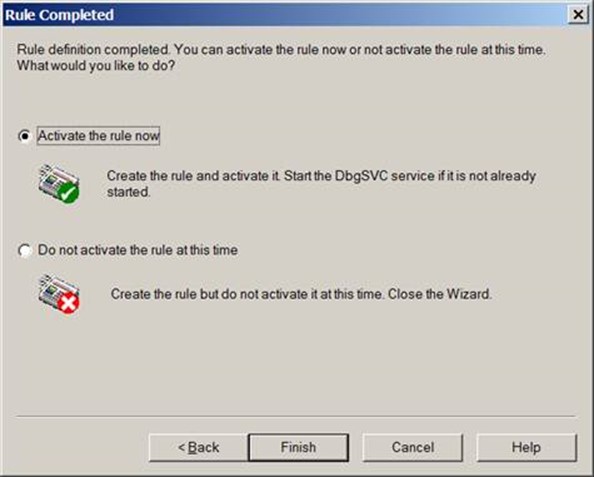
On the Rule Completed window, you have a choice on whether you're ready to activate the rule or not.
If you're ready to reproduce the problem (one or two mouse clicks away) then activate it now.
Otherwise select "Do not activate the rule at this time" for now and activate it later.
Click Finish.
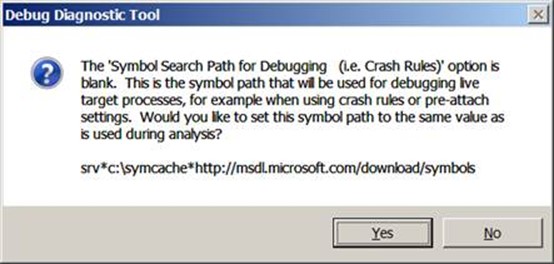
If you see this message about Symbol Paths, you can select YES.
Assuming the rule was not activated upon rule finish, you can activate the rule when you are ready to reproduce the problem.
If possible, activate the rule when you are one or two mouse clicks away from reproducing the problem.
Also, if possible, reproduce the problem in a test environment rather than in a production environment.
If you do reproduce the problem while logging exceptions with debugdiag, try to reproduce the problem when traffic to the application pool or process that you're monitoring is at its lowest levels.

Once the rule is activated, most of the asp.net exceptions thrown inside of the selected process should be logged to a logfile.
After reproducing your problem, you can locate the log file by clicking the icon of the manila folder.
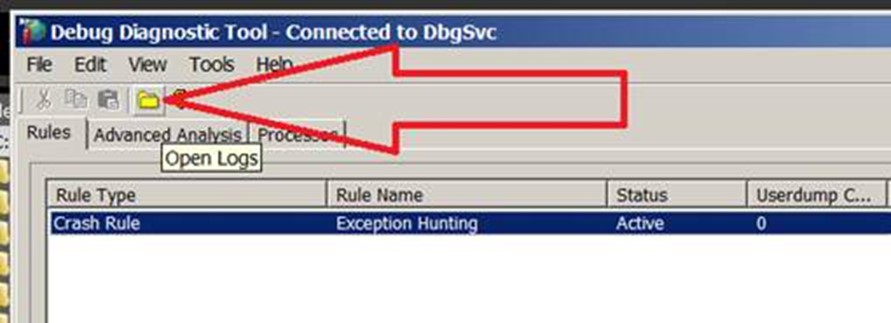
This will open the folder C:\Program Files\DebugDiag\Logs
The file you're looking for may look a little like this one:
w3wp__DefaultAppPool__PID__4840__Date__07_19_2013__Time_04_02_18PM__81__Log.txt
Post scripts:
The exceptions logged in the log file will not have verbose information. They will not show full stack traces, for example. Mainly this is useful for knowing which exceptions are occurring when the problem is reproduced. You can then use that information to help you produce a dump file of the iis process at the right time the next time that exception is thrown. (That's in one of my next blogs!)
Ideally, you can isolate that asp.net application into its own application pool if possible, make sure no one else is browsing to that application, activate the rule, reproduce the problem, deactivate the rule, and check your log files to see which exception is thrown. Several exceptions may be thrown. Not all exceptions are bad. You can do some logging of exceptions while running the application in a way that does NOT reproduce the problem to get a baseline and know better which exceptions are "normal" and expected.
I do not recommend doing this with DebugDiag 1.1. Use DebugDiag 1.2 instead of 1.1. v1.2 has a few good improvements in this area.
Unfortunately sometimes DebugDiag 1.2 can detect that a .net exception is being thrown in a process, can log the fact that it occurred, but it's not able to log the type of exception that is being thrown. More often than not, DebugDiag 1.2 can get the job done. Hopefully DebugDiag 2.0 won't have this limitation.
If your application is throwing several exceptions every second, doing this type of logging can really bog down the machine. Beware.
Comments
- Anonymous
October 14, 2015
It seems that there is a little bug in DebugDiag 2.1 that is good to know about. When “enable raw debugger logging” is check-marked (Tools Menu > Options > Crash Rule Preferences Tab), the exception logs are placed in *ProgramFilesDebugDiagLogs. But when "enable raw debugger logs" is unchecked there, the logs will be placed into the *ProgramFilesDebugDiagLogs{Crash rule for XYZ} folder. I reported this to the amazing Wade Mascia (social.msdn.microsoft.com/.../wade%20mascia) and imagine it'll be fixed in vnext.