Experiences with SQL Server Database Compression
I want to share some customer experiences with database compression we gathered in a large SAP migration project in EMEA.
Most of the public available data about SAP database compression ratios only shows values for compression of an existing SQL Server database, like:
· Using SQL Server Database Compression with SAP NetWeaver:
· Quanta case study:
https://www.microsoft.com/casestudies/casestudy.aspx?casestudyid=4000003962
In our project we performed a heterogeneous system copy of a whole SAP landscape based on Netweaver 7.0 from SUN/Oracle to Windows SQL Server including a Unicode conversion of the SAP systems. So we combined the change of the operating system and database software (SAP OS/DB migration) together with the Unicode conversion of the systems. The technical procedure is based on the SAP migration tool R3load, which converts the system during the export of the data to Unicode.
The target database software is SQL Server 2008 R2 and we are using Page compression for all the database tables. Source database software is Oracle 10.2.0.4.
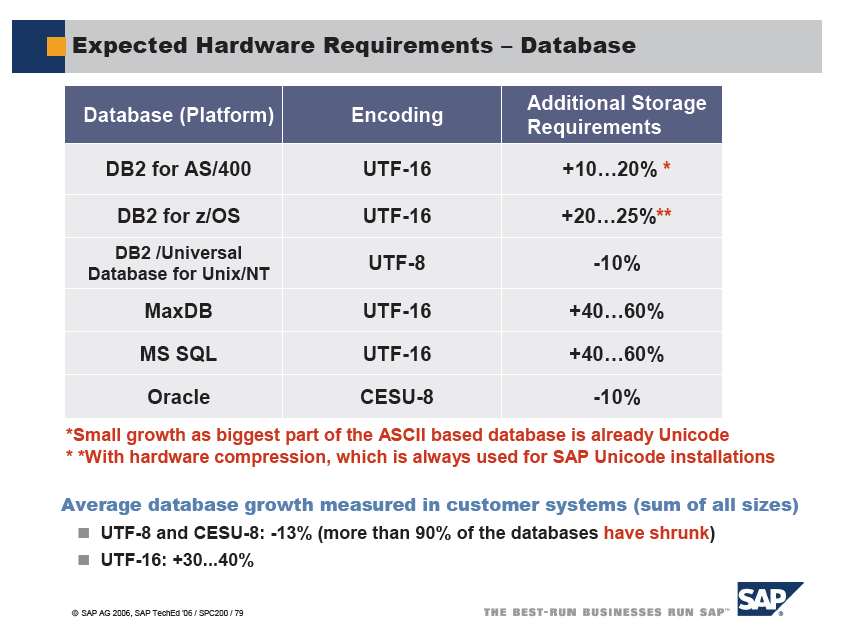
Until SQL Server 2008 R2, we had the disadvantage of storing the data in a UCS2 format which resulted in a growth of the database after the Unicode Conversion. SAP officially provided the following sizing information for databases in regard of Unicode Conversions:

With SQL Server 2008 R2, Microsoft introduced UCS-2 compression on top of our existing compression functionality, which removes our disadvantage in case of a Unicode conversion of a SAP system: (https://blogs.msdn.com/b/saponsqlserver/archive/2009/09/16/sql-server-2008-r2-ucs2-compression-what-is-it-impact-on-sap-systems.aspx)
Now back to the customer example. In the following table you find the database sizes and compression ratios of five productive (PRD) and development (DEV) SAP systems:
|
SAP System |
Instance |
Oracle |
SQL Server |
|||
|
DB Size Total |
DB Size Used |
DB Size Total |
DB Size Used |
Saving %(Used) |
||
|
ECC 6.0 |
PRD |
2.800 |
2.450 |
1.220 |
1.170 |
52 |
|
|
DEV |
230 |
160 |
126 |
65 |
59 |
|
HR |
PRD |
477 |
405 |
255 |
199 |
51 |
|
|
DEV |
174 |
125 |
112 |
76 |
39 |
|
CRM |
PRD |
311 |
230 |
133 |
121 |
47 |
|
|
DEV |
67 |
51 |
42 |
24 |
53 |
|
BW |
PRD |
152 |
85 |
100 |
59 |
31 |
|
|
DEV |
110 |
37 |
50 |
16 |
57 |
|
BW |
PRD |
1.161 |
890 |
634 |
452 |
49 |
|
|
DEV |
120 |
60 |
50 |
21 |
65 |
|
SUM |
5.602 |
4.493 |
2.722 |
2.203 |
51 |
|
As you see in the saving column, even with a Unicode conversion, which normally ends up with a growth of the data, we came up with an average saving of 51% for the used database size. If we include the QAS systems, which are 1:1 copies of the PRD systems, the customer came down from app. 10TB total DB space on the Oracle side to app. 5TB on the SQL Server 2008 R2 side.
We only found one strange phenomena in regards to the compression. For legal and compliance reason the customer needs to store his data online for 10 years and needs to protocol all changes to the database tables. Inside a SAP system this changes are stored in the standard table DBTABLOG. In the large ECC 6.0 system this table has > 15millions rows and uses app. 280GB of disk space on the Oracle side. After the migration the size of the table grows up to 520GB on SQL Server 2008 R2, which means near the half of the database size is occupied by one table. This difference is due to Oracle’s BLOB/CLOB compression; a functionality which will compress content in BLOB/CLOB columns. Since DBTABLOG keeps the main content in such columns, there is a reduction in size of such a table compared to SQL Server. SQL Server so far doesn’t have compression implemented for BLOB/CLOB data types. Except for the fact that SQL Server would apply its Page compression algorithms on BLOB/CLOB content which is stored in-row.