APM object model
It has been a while since we posted some new information about APM in OpsMgr 2012. Michael wrote a post in August, about working with Alerts, which was following up on a couple of previous ones about how to get things running, how APM works, and how to simulate errors for testing. Also Sergey has followed in September about how APM in OM12 is easier to setup, simpler to configure, cheaper to maintain, and Adam in November (shortly following RC release) showed that it really is as easy to configure as 1…2…3…
More recently, I have been talking to a number of people such as TAP customers, colleagues doing internal testing, etc. One question that came up was about understanding, when you run thru the APM Template/Wizard, what objects are in fact being created by the template – in other terms, how do the options I select in the wizard influence the way my application will be monitored? How will my application “look like” in OpsMgr once APM Monitoring has been set up for it?
To be completely clear, we have published a fair chunk of official documentation on Technet for APM to guide users thru the process and describe the various settings and thresholds in details. In particular you should be referring to the following two locations:
- The authoring/configuration experience of the APM template is described in the Authoring Guide - https://technet.microsoft.com/en-us/library/hh457578.aspx
- Operational Activity (working with application alerts, etc.) are in the Operations guide – https://technet.microsoft.com/en-us/library/hh212856.aspx
Anyway, to make things a bit more clear about how the object model actually looks like (for the geeks out there), I created the following diagram, essentially mapping the Wizard elements to the objects that get created by the template:
As you can see, every template instance that you create by running the wizard, represents a single application – this is called an “Application group” and it is a singleton object – similar to a Distributed Application, although it does not appear in the “distributed application” view because it has a different base class.
The diagram above can be accessed from the “Monitored Applications” state view (which shows all the applications that have been configured thru the APM template) by right clicking an app and selecting the Diagram View for that object:
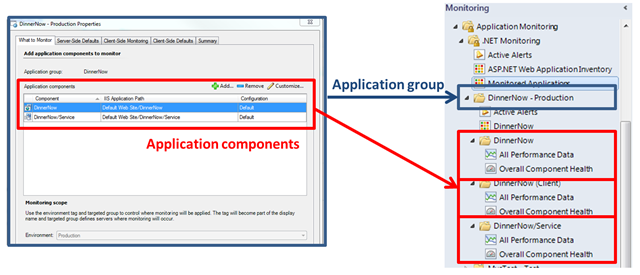
The template also creates Folders and Views, following the same hierarchy:
So, as already written, the “top level” object is called an “Application group” and it is a singleton object – similar to a Distributed Application. It hosts other singleton objects – the “Application components” – which typically represent the “tiers” of your SOA Application. In the current (RC) implementation they can be Web Application or Web Services (both .asmx web service and WCF services hosted in IIS), but there could be more “types” appearing in the future. Some components (Web Applications) are considered appropriate for Client-Side monitoring – some are not, and are only appropriate for Server-Side monitoring, since they probably do background processing, or serve XML files as opposed to HTML web pages, and so on. Enabling Server-side or Client-side monitoring for the components, enables the “third” level – the green rectangles in the illustrations above – those are “component roles” – these represent if the component (“tier”) hosts a Web Application, a Web Service, an IIS-hosted WCF Service and if it has been enabled for Client-Side monitoring. You can also see this breakdown in “application components” and which “component roles” they host/are monitoring, in the first State view for the “Application group”:
All the objects described so far (those in the dark blue, red and green rectangles in the illustrations above) are singleton classes which get created on management servers – like other singletons, they live in the “All Management Servers” resource pool. All these objects are created to give a distinction in “groups” or “tiers” for applications that can be running the same component on multiple machines in a server farm that can scale horizontally.
The fourth level in the diagram is, finally, the actual monitored instances on the Agents – those are the “worker bees” collecting data from the APM Service and feeding it thru the OM channel, as described in my first post on this blog. These instances are contained within the component roles above, and at the same time they are hosted by the APM Agent object.
The “per component” folders and views we have shown above are the place where you can see both state and alerts for these agent instances (driven by Rules and monitors previously described by Michael), as well as the performance data collected:
And that should be it, we have come full circle from the high-level configuration in the console to the agent. To be fair, there is one additional set of objects that I am not showing here, that come into play when defining transactions. I’ll maybe get to that in a separate post, since it requires an understanding of what transactions are, in APM terminology. For now I hope this post helps clarify how the base/common object look like with APM in OM12, and enable you to understand more clearly what you are seeing!
Happy .NET Monitoring!


