Using Visual Studio 2005/2008 To Generate Load Against a Two-Way Request-Response WCF Receive Location
Introduction
We all know that testing is very important for every kind of solution. However, testing and in particular performance testing is often neglected for time or budget reasons. One of the things that I have found when working with customers is that the amount of performance testing done on a project tends to fall into a couple of categories. The first and in my opinion the worst is when no performance testing is done at all. I would call this a write once, go live and cross your fingers approach. The next type is when load/stress testing is performed right at the end of the project lifecycle, typically a few weeks before the go live date. If the application is not able to meet the expected performance goals in terms of scalability and latency, there’s a serious risk that architects and developers will have to spend a considerable amount of time to redesign, rewrite and test large portions of the solution.
Sometimes performance testing is done using a rig that does not accurately reflect the production environment, while in other cases I have seen people using different adapters that do not match those used in the production environment. All these bad practices and factors expose the project to the risk of delays and failure.
BizTalk Server is used in mission and business critical scenarios where it is not just part of the business, it is actually running the entire business. Overlooking performing testing increases the risk of failure which can cause not just technical problems but political problems as well.
The way to minimize the risk of a BizTalk project (and of any software project in general) is to adopt a strong and consistent testing strategy throughout the development phase and before deploying the final solution into production. For this reason, the BizTalk Customer Advisory Team adopts a consistent and reusable methodology when running performance labs with customers. This process is fully documented in the BizTalk Server Performance Testing Methodology of the Microsoft BizTalk Server 2009 Performance Optimization Guide.
The best approach is to leverage a test framework like BizUnit to automate test runs and possibly schedule their execution over night. Another key factor is to individuate the right tool to generate load against the application. To this purpose you can use the BizTalk LoadGen 2007 as I explained in my previous article. The LoadGen tool offers the following important features and benefits to provide a simple, generic, reliable, and consistent tool for generating message transmission loads. By default, LoadGen supports several transport protocols:
| Transport component | Description |
| File transport | The File transport creates files including message data in the destination folder. |
| HTTP transport | The HTTP transport sends messages with the POST method to the destination location that the BizTalk HTTP receive adapter hosts. |
| MQSeries transport | The MQSeries transport sends messages to the target MQSeries queue. |
| MSMQLarge transport | The MSMQLarge transport sends messages to the BizTalk MSMQT receive locations. Native message queuing cannot process a message with a body larger than 4 megabytes (MB). |
| MSMQ transport | The MSMQ transport sends messages smaller than 4 megabytes (MB) to the target MSMQ queue. |
| SOAP transport | The SOAP transport sends messages with the POST method to the target Web service. |
| WSE transport | The WSE transport sends messages to the target Web service hosted by Web Services Enhancements (WSE) 2.0. |
| WSS transport | The WSS transport sends messages with the PUT method to the target Windows SharePoint Services site. |
| WCF transport | The WCF transport sends message data to the target Windows Communication Foundation (WCF) service. |
However, LoadGen is a great tool, but it suffers of the following problems:
- Test definition is entirely done through XML configuration files. LoadGen does not provide any UI to model and define load tests.
- It doesn’t provide the possibility to create rules to generate warnings when a give performance counter exceeds a configurable threshold.
- Generating high loads against a BizTalk application is an intensive task and can easily lead to run out of system resources (CPU, Memory, Disk I/O, Network, etc.). For this reason, when running a performance lab against an enterprise level application is necessary to arrange multiple Test Agent machines in order to generate the expected load. Even though you can start several instances of LoadGen on separate machines, you can’t coordinate their work in a centralized manner. Multiple instances of LoadGen can be started using a script or the LoadGenExecuteStep class provided by BizUnit, but there’s no way to monitor their execution using a console.
- When invoking a Two-Way Receive Location, LoadGen provides the possibility to save response times to a log file, but not to a centralized database. Of course, when the test is over, it’s possible to collect the log files produced by the different Test Agents, each running on a separate machine, and upload their contents to a SQL Server table with a Bulk Insert. This allows to conduct an in-depth analysis of the test results and eventually run a set of queries to generate statistics and compare key performance indicators of different test runs. Nevertheless, this process must be manually built as it is not provided out of the box by LoadGen.
Sometimes customers/partners create a custom multi-threaded application in order to generate load against their BizTalk Application, correlate request and response messages and persist response times to a relational database. This approach requires time and resources to design and develop the multi-threaded application capable to generate the load against the BizTalk platform and store test results to a custom repository. Another common technique adopted by customers is to use a dedicated product like HP LoadRunner to measure end-to-end performance, diagnose application and system bottlenecks and tune for better performance. So the question arises: is there any Microsoft product that I can use to perform stress and load tests in a easy way? The answer is yes.
Visual Studio Team System Test Edition
In my opinion, the best solution to design, configure, execute and monitor performance tests against BizTalk is to leverage Visual Studio Team System Test Edition that includes a suite of tools that allow to conduct several kinds of tests (unit tests, load tests, web tests, etc.). In particular, Visual Studio Team System Test Edition provides a tool for creating and running load tests. For more information on this topic see Understanding Load Tests. Visual Studio Team System Test Edition provides the following advantages:
- It enables developers to set up a group of computers that generates simulated load for testing. The group consists of a single Controller and one or more Test Agents, each running on a separate machine. Collectively, this group is called a Rig. In particular, a Test Agent is the part of the Rig that is used to run tests and generate simulated load. For more information on this topic see Controllers, Agents, and Rigs.
- When you define a load test, you can choose between two different load patterns:
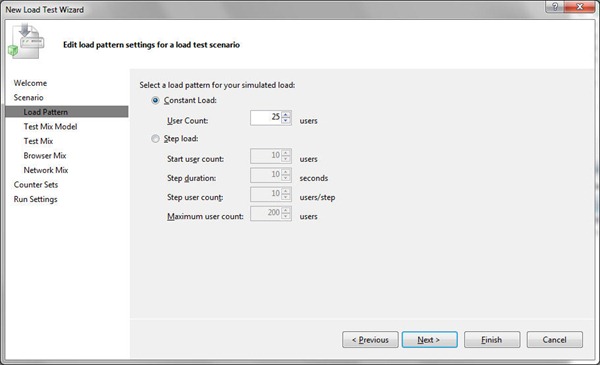
- Constant: the constant load pattern is used to specify a user load that does not change during the load test. For example, when you run a smoke test on a Web application, you might want to set a light, constant load of 10 users.
- Step: the step load pattern is used to specify a user load that increases with time up to a defined maximum user load. For stepping loads, you specify the Initial User Count, Maximum User Count, Step Duration (seconds), and Step User Count.For example a Step load with an Initial User count of one, Maximum User Count of 100, Step Duration (seconds) of 10, and a Step User Count of 1 creates a user load pattern that starts at 1, increases by 1 every 10 seconds until it reaches 100 Users.
- It’s possible to create a Load Test Results Repository to store the information gathered during a test run. This repository contains performance counter data and information about any errors. See Load Test Results Repository for more information on this topic.
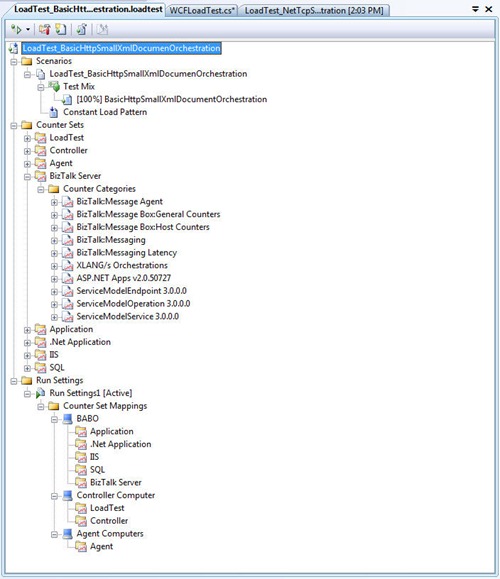
- When you create a load test, Visual Studio Team System Test Edition lets you specify multiple counter sets. A counter set is collection of performance counters that are useful to monitor during a load test run. Counter sets are part of the load test and apply to all its scenarios. They are organized by technology, for example, ASP.NET, IIS or SQL counter sets. Visual Studio allows developers to create their own Counter Sets to track any performance counters. Counter sets can be defined to gather performance counter data from all the machines composing the performance lab kit. (BizTalk Server, SQL Server, Test Agents, etc.).
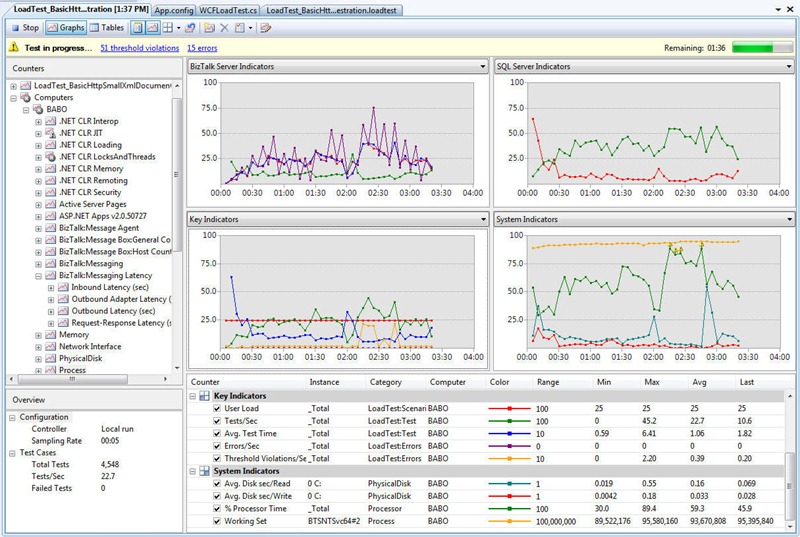
- This feature is extremely helpful because during a test run it allows to collect performance counter data (BizTalk Server, SQL, IIS, etc.) in a central storage and to create multiple diagrams to visualize the most relevant counters. When the test run is over, the summary page allows to browse and analyze test results.
How to use Visual Studio to generate load against a Two-Way WCF Receive Location
Recently I published an article in 2 parts (Part1, Part2) where I compare 4 different techniques to process an XLANGMessage within a method exposed by a business component invoked by an orchestration. In particular, I created a Two-Way Synchronous version and a One-Way Asynchronous version for each of these patterns. All of the 4 synchronous patterns share the same architecture depicted below:
Message Flow:
- A WCF-BasicHttp or WCF-Custom Request-Response Receive Location receives a new CalculatorRequest xml document from the Test Agent/Client Application.
- The XML disassembler component within the XMLTransmit pipeline promotes the Method element inside the CalculatorRequest xml document. The Message Agent submits the incoming message to the MessageBox (BizTalkMsgBoxDb).
- The inbound request starts a new instance of a given orchestration.
- The orchestration invokes a method exposed by a business component.
- The method in question returns a response message.
- The orchestration publishes the CalculatorResponse message to the MessageBox (BizTalkMsgBoxDb).
- The response message is retrieved by the Request-Response WCF-BasicHttp or WCF-Custom Receive Location.
- The response message is returned to the Test Agent/Client Application.
In order to generate the load against the WCF-Basic and WCF-Custom Receive Locations I proceeded as follows:
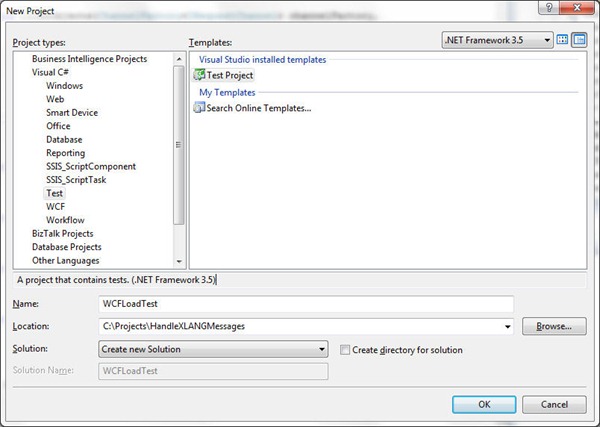
- I started creating a Test Project called WCFLoadTest.
- Then I created a Test Class called WCFLoadTest. This class is decorated with the Microsoft.VisualStudio.TestTools.UnitTesting.TestClassAttribute to indicate that the class contains test methods.
- I defined a Test Method for each combination of the following factors:
- Receive Location/Transport used to submit messages to BizTalk (WCF-NetTcp, WCF-BasicHttp)
- Message Size (small, medium, large)
- Orchestration Pattern (XmlDocumentOrchestration, StreamOrchestration, MessageClassesOrchestration, CustomBTXMessageOrchestration).
- Each combination of the factors above corresponds to a separate test case. I used the following naming convention for test methods:
- <Transport><Message Size><Orchestration Pattern>
- I created an helper method called InvokeTwoWayWCFReceiveLocation to allow test methods to exchange messages with a Request Response WCF Receive Location. This methods expects the following input parameters
- endpointConfigurationName: the name of one of the service endpoints defined in the app.config configuration.
- requestMessageFolder: the path of the folder containing the request documents.
- requestMessageName: the name of the request document to send.
- messageVersion: specifies the version of SOAP and WS-Addressing of the request and response messages.
- sessionMode: indicates the support for reliable sessions (Allowed, Required, NotAllowed).
- Each test method invokes the InvokeTwoWayWCFReceiveLocation passing a different combination of parameters.
The client endpoints used by the InvokeTwoWayWCFReceiveLocation method to exchange messages with the WCF Receive Locations are defined in the configuration file (App.config) of the project.
App.config
|
The following table contains the code of the WCFLoadTest class:
WCFLoadTest Class
|
Each test method corresponds to a separate Unit Test. Visual Studio permits to create a Load Test as a composition of one or multiple unit tests. Explaining in detail how creating a Load Test is out of the scope of the present post. This process is fully documented on MSDN at the following link: Walkthrough: Creating and Running a Load Test. However, for the sake of the completeness I’m going to describe the steps necessary to create a Load Test based on a single Unit Test:
-
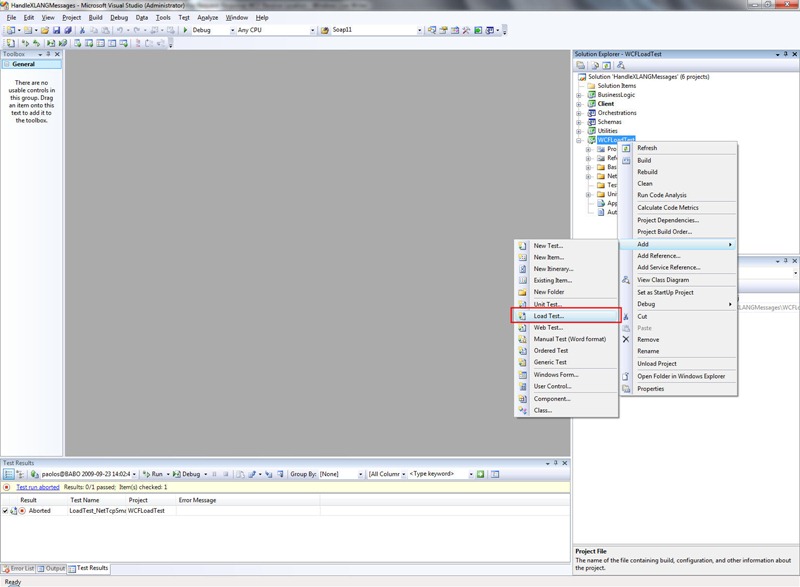
Right-click the Test project, expand the Add menu and select the Load Test menu item as shown in the picture below:
-
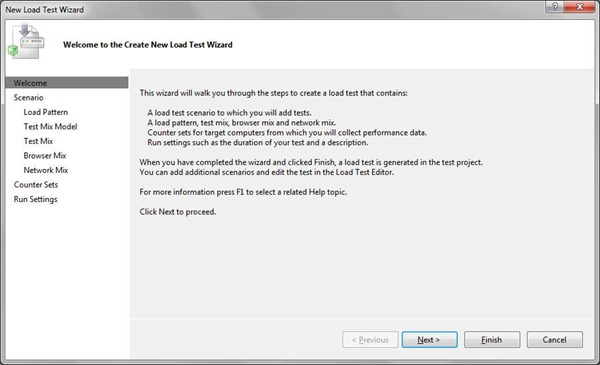
This opens a a Wizard that walks you through the creation of a Load Test. Click the Next button. See Creating Load Tests for more information on this topic.
-
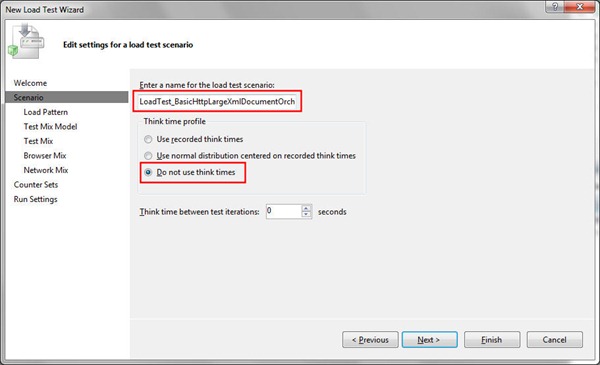
Enter a name for the load test scenario and select one of the available think time profiles (I always choose ‘Do not use think times’ to increase the load against the tested application). Click the Next button. See How to: Specify Scenarios for more information on this step.
- Choose a load pattern for your load test and configure parameters applicable to your choice. Click the Next button. See How to: Specify Load Patterns for more information on this step.
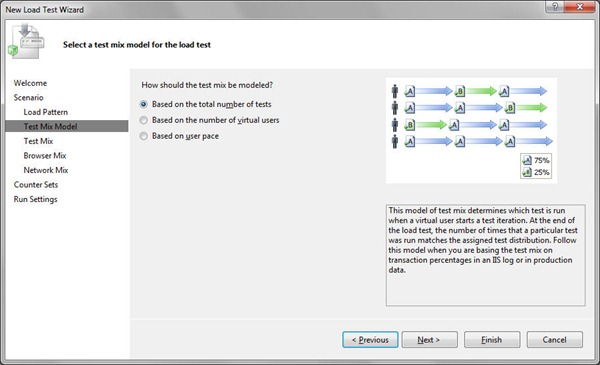
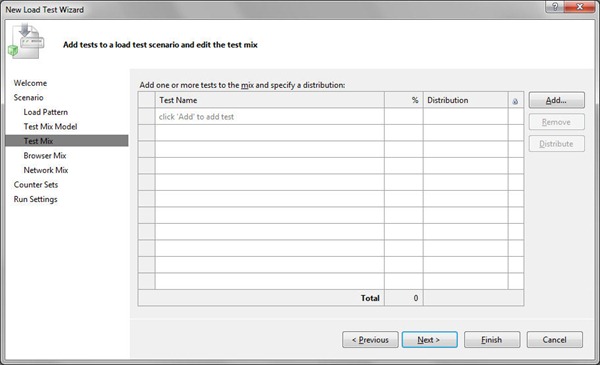
- Choose a Test Mix and click the Next button. See How to: Specify Test Mix for more information on this step.
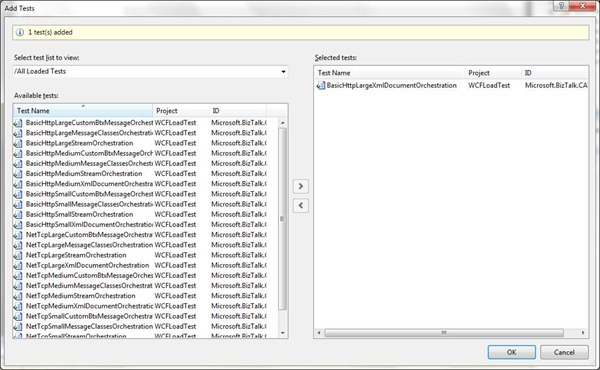
- A load test contains one or more scenarios, each of which contains one or more Unit Tests. Press the Add button to add one or multiple Unit Tests to your scenario. See How to: Specify Browser Mix for more information on this step.
- Select one or multiple Unit Tests and click the OK button. One again, each Test Method corresponds to a separate Unit Test.
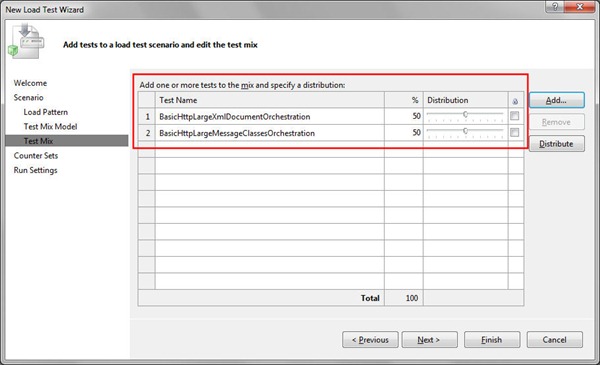
- If you selected multiple Unit Tests, as in the picture below, you can select your preferred browser mix by adjusting the sliders in the Distribution column, or by typing the percentage values directly into the % column, then click the Next button to advance to the next step.
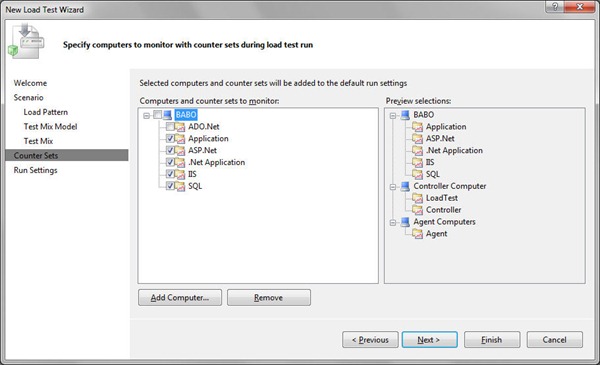
- The following dialog allows you specify which computers and counter sets to monitor during a load test run. After completing the wizard, you can define additional counter sets. This is very helpful because it allows to select any performance counters exposed by a product (BizTalk Server in our case) or by your application. When you have done, click the Next button to advance to the next step. See How to: Specify Counter Sets for more information on this step.
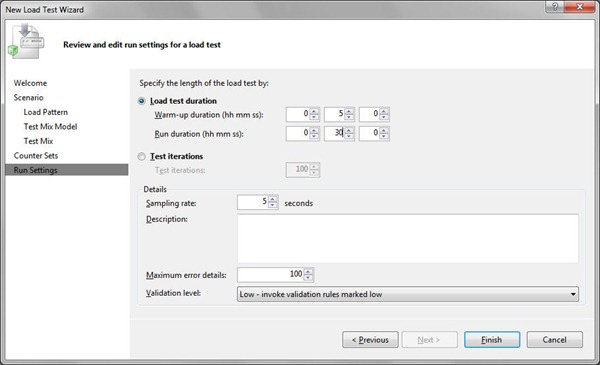
- In this dialog, you can specify Run settings that affect the entire load test. The run settings determine the length of the test, warm-up duration, maximum number of error details reported, sampling rate, connection model (Web tests only), results storage type, validation level and SQL tracing. The run settings should reflect the goals of your load test. For more information, see About Run Settings. When you have done, click the Finish button to complete the Load Test creation. See How to: Specify Run Settings for more information on this step.
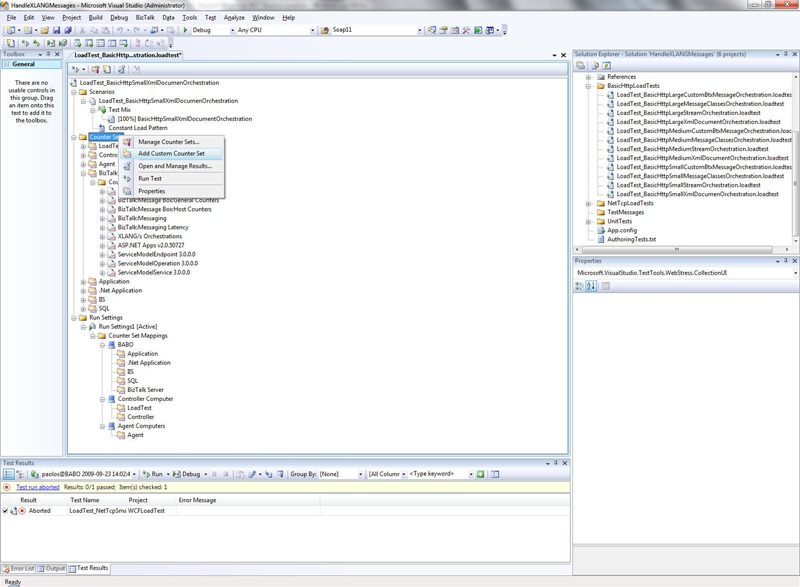
- At this point you can open the newly created Load Test, right click the Counter Sets and select Add Custom Counter Set from the drop menu. Rename your new Counter Set ‘BizTalk Server’.
Now, right click the BizTalk Server Counter Set and click the Add Counters menu item to add the most relevant BizTalk Server, System, .NET and WCF performance counters:
BizTalk Server performance counters
\\.\BizTalk:FILE Receive Adapter(*)\*
\\.\BizTalk:FILE Send Adapter(*)\*
\\.\BizTalk:FTP Receive Adapter(*)\*
\\.\BizTalk:FTP Send Adapter(*)\*
\\.\BizTalk:HTTP Receive Adapter(*)\*
\\.\BizTalk:HTTP Send Adapter(*)\*
\\.\BizTalk:Message Agent(*)\*
\\.\BizTalk:Message Box:General Counters(*)\*
\\.\BizTalk:Message Box:Host Counters(*)\*
\\.\BizTalk:Messaging Latency(*)\*
\\.\BizTalk:Messaging(*)\*
\\.\BizTalk:MSMQ Receive Adapter(*)\*
\\.\BizTalk:MSMQ Send Adapter(*)\*
\\.\BizTalk:POP3 Receive Adapter(*)\*
\\.\BizTalk:SMTP Send Adapter(*)\*
\\.\BizTalk:SOAP Receive Adapter(*)\*
\\.\BizTalk:SOAP Send Adapter(*)\*
\\.\BizTalk:SQL Receive Adapter(*)\*
\\.\BizTalk:SQL Send Adapter(*)\*
\\.\BizTalk:TDDS(*)\*
\\.\BizTalk:Windows SharePoint Services Adapter(*)\*
\\.\XLANG/s Orchestrations(*)\*
WCF performance counters
\\.\ServiceModelService 3.0.0.0
\\.\ServiceModelEndpoint 3.0.0.0
\\.\ServiceModelOperation 3.0.0.0
.NET performance counters
\\.\.NET CLR Exceptions(*)\*
\\.\.NET CLR Memory(*)\*
System performance counters
\\.\Cache\*
\\.\Distributed Transaction Coordinator\*
\\.\Enterprise SSO(*)\*
\\.\LogicalDisk(*)\*
\\.\Memory\*
\\.\Network Interface(*)\*
\\.\Paging File(*)\*
\\.\PhysicalDisk(*)\*
\\.\Process(*)\*
\\.\Processor(*)\*
\\.\System\*
\\.\TCPv4\*
\\.\IPv4\*
Repeat the last step to include the most relevant performance counters on the SQL machine hosting the BizTalkMsgBoxDb. In the list below, the name of the SQL Server instance hosting the BizTalkMsgBoxDb is MSSQL$BTS:
-
SQL Server performance counters
\\.\MSSQL$BTS:Access Methods\*
\\.\MSSQL$BTS:Buffer Manager\*
\\.\MSSQL$BTS:Buffer Node(*)\*
\\.\MSSQL$BTS:Buffer Partition(*)\*
\\.\MSSQL$BTS:Databases(*)\*
\\.\MSSQL$BTS:General Statistics\*
\\.\MSSQL$BTS:Latches\*
\\.\MSSQL$BTS:Locks(*)\*
\\.\MSSQL$BTS:Memory Manager\*
\\.\MSSQL$BTS:SQL Statistics\*
\\.\MSSQL$BTS:Transactions\*
\\.\MSSQL$BTS:Wait Statistics(*)\*
\\.\MSSQL$BTS:Plan Cache\*
System performance counters
\\.\Objects\*
\\.\Memory\*
\\.\Paging File(*)\*
\\.\PhysicalDisk(*)\*
\\.\Process(*)\*
\\.\Processor(*)\*
\\.\Network Interface(*)\*
\\.\TCPV4(*)\*
\\.\LogicalDisk(*)\*
\\.\System\*
Take into account that the WCF adapters do not provide their own performance counters. However, you can monitor the performance counters of Windows Communication Foundation (WCF) to gauge the performance of the WCF Receive Locations. To use the WCF performance counters for the WCF receive locations, you have to enable the performance counters for the host instances running the receive locations. See WCF Adapters Performance Counters for more information on this topic.
Another interesting feature provided by Visual Studio is the possibility to define one or multiple threshold rules on individual performance counters to monitor system resource usage or the respect of performance-related SLAs during a load test. Counter set definitions contain predefined threshold rules for many key performance counters, but you can create specific rules for any performance counter. See About Threshold Rules for more information on this topic.
Let’s make an example using my use case. During the scope phase of my performance lab I specify the following performance goal:
Latency:
-
- warning: response time < 2 sec for 90% of messages
- critical: response time < 5 sec for 99% of messages
In order to be notified during a test run that a response time exceeded one the threshold above, I can create a custom threshold rule. Nice, but how can I accomplish this task and which performance counter should I use? Let’s start asking to this latter question. The suitable performance counters for measuring the latency of a Request-Response WCF Receive Location are the following:
- \\.\BizTalk:Messaging Latency(<Host running your WCF Receive Location>)\Request-Response Latency (sec)
- \\.\ServiceModelService 3.0.0.0(<the service corresponding to your WCF Receive Location>)\Calls Duration
- \\.\ServiceModelEndpoint 3.0.0.0(<the endpoint used by your WCF Receive Location>)\Calls Duration
- \\.\ServiceModelEOperation 3.0.0.0(<the endpoint used by your WCF Receive Location>)\Calls Duration
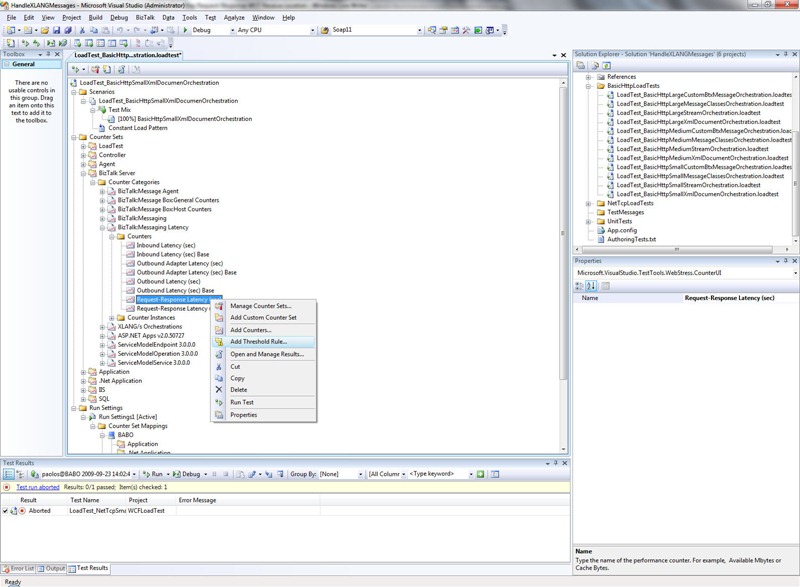
In order to create a threshold on the Request-Response Latency (sec) performance counter, you can expand the BizTalk Server Counter Set and browse to the counter. Now right click the corresponding node and select the Add Threshold Rule from the drop menu:
-
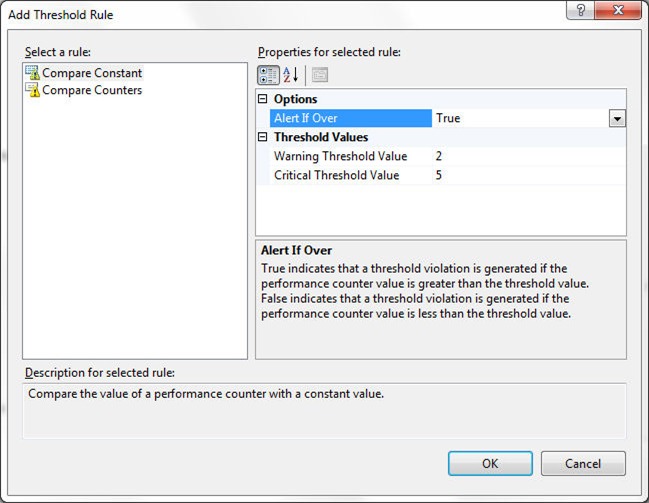
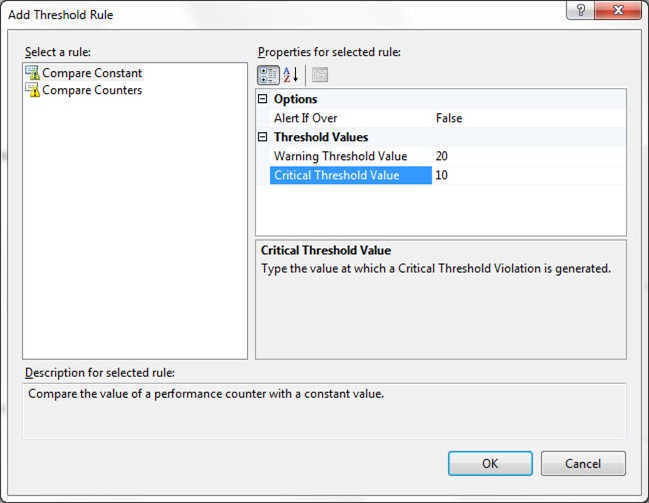
In the Add Threshold Rule dialog, select Compare Constant in the left panel and assign:
  -
    True to the Alert If Over property to indicate that a threshold violation occurs when the performance counter value is greater then the threshold value.

  -
    2 to the Warning Threshold Value property.

  -
    5 to the Critical Threshold Value property.
Click the OK button to confirm. See How to: Add a Threshold Rule for more information on this topic
-
You can repeat the same process and set a Threshold Rule to be alerted when the throughput of your application goes below a certain threshold. A good candidate to measure the throughput of a BizTalk application composed by one or multiple orchestration is the \\.\XLANG/s Orchestrations(<Host>)\Orchestration completed/sec performance counter. However, in this case I will set the value of the Alert If Over property to False to indicate that a threshold violation occurs when the performance counter value is less then the threshold value (in the sample below 20 and 10 are respectively the Warning and Critical Threshold Values).
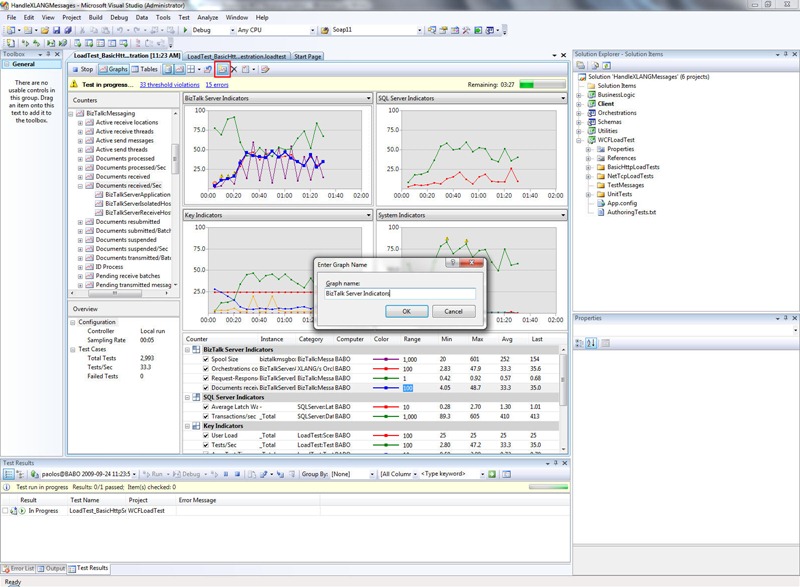
At runtime, threshold violations can be reviewed clicking the threshold violation link under the Load Test toolbar. If the counter in question is exposed by a Graph, each threshold violations is signaled with a yellow triangle.
At this point I’m ready to launch a load test, so I can just press the start button. In order to create a custom Graph to monitor most relevant counters I proceed as follows:
-
I click the Add New Graph button on the Load Test toolbar (highlighted in the picture below), I specify a name for my new Graph in the Enter Graph Name dialog and then I press the OK button to confirm.
-
Now, it’s sufficient to select, drag & drop counters from the Counter panel to the newly created Graph. For the sake of I completeness, during my demo I created a graph called BizTalk Server and I dragged and dropped the following performance counters:
  -
    \\\\.\\BizTalk:Messaging Latency(BizTalkServerIsolatedHost)\\Request-Response Latency (sec)

  -
    \\\\.\\BizTalk:Messaging (BizTalkServerIsolatedHost)\\Documents received/sec

  -
    \\.\\XLANG/s Orchestrations(BizTalkServerApplication)\\Orchestration completed/sec

  -
    \\.\\BizTalk:Message Box:General Counters(biztalkmsgboxdb:babo)\\Spool Size
I strongly suggest to repeat the process and create a custom Graph to monitor the most relevant performance counters exposed by the SQL Server instance or instances that host the most solicited BizTalk Server databases:
BizTalkMsgBoxDb and any additional MessageBox.
BizTalkDTADb if global tracking is turned on.
BAMPrimaryImport if the application makes use of BAM.
and any custom databases used by the application.
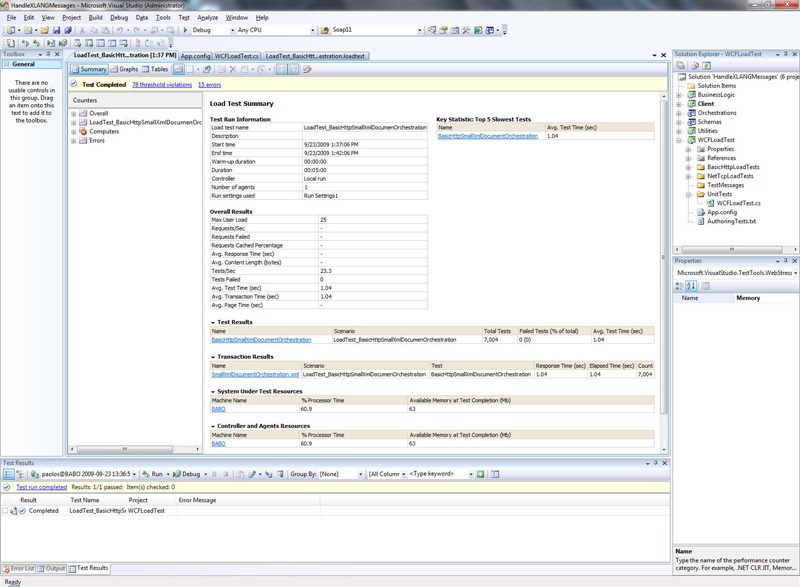
When the load test is over, you can review the results on the Summary Page:
You can also click the links in the Test Results and Transaction Results tables to navigate to a page where you can review more in detail test results, errors and threshold violations.
Summary
Visual Studio Test Edition is a powerful suite to rapidly build Unit and Load Tests to conduct performance and stress tests against your BizTalk application. We assumed that the application in question was exposed via a WCF Two-Way Receive Location, but the approach exposed in the present post can be customized and extended to other scenarios where the application makes use of other Adapter to expose its services. Here you can download the Test Project I used to conduct tests against the HandleXLANGMessages application. See Part1 and Part2 for more information.
Comments
Anonymous
September 25, 2009
Wow!! This is excellent. I am going to use this right now. I have been using Loadgen up until now.Anonymous
May 29, 2014
Excellent post paulo thanks for sharing it with us
