Nota
El acceso a esta página requiere autorización. Puede intentar iniciar sesión o cambiar directorios.
El acceso a esta página requiere autorización. Puede intentar cambiar los directorios.
This guide provides the steps required for getting up and running with Connected Customer Service (CCS) for IoT Hub. If you're looking for information about CCS for IoT Central, be sure to visit our tutorial on getting set up.
Prerequisites
Before you install Connected Customer Service, make sure you have the following required items:
Dynamics 365 system administrator credentials. For users with Microsoft 365 system administrator access, they must have the System Administrator role as a minimum security role within the Dynamics 365 organization.
An IoT – Administrator role in the IoT solution (to access IoT entities and IoT functionality), plus another role, like Customer Service – Dispatcher (to access Dynamics 365).
An active Azure subscription with appropriate privileges. Learn more in article on Azure prerequisites.
Microsoft Power BI PRO and the sample report template. Learn more in Download the Power BI template for Connected Customer Service.
Install Connected Customer Service
Connected Customer Service is included with Dynamics 365 Customer Service. Creating a new Customer Service environment or upgrading an existing one to v9.0.20034.20XX+ automatically includes the following Connected Customer Service entities and related processes:
- Devices
- IoT alerts
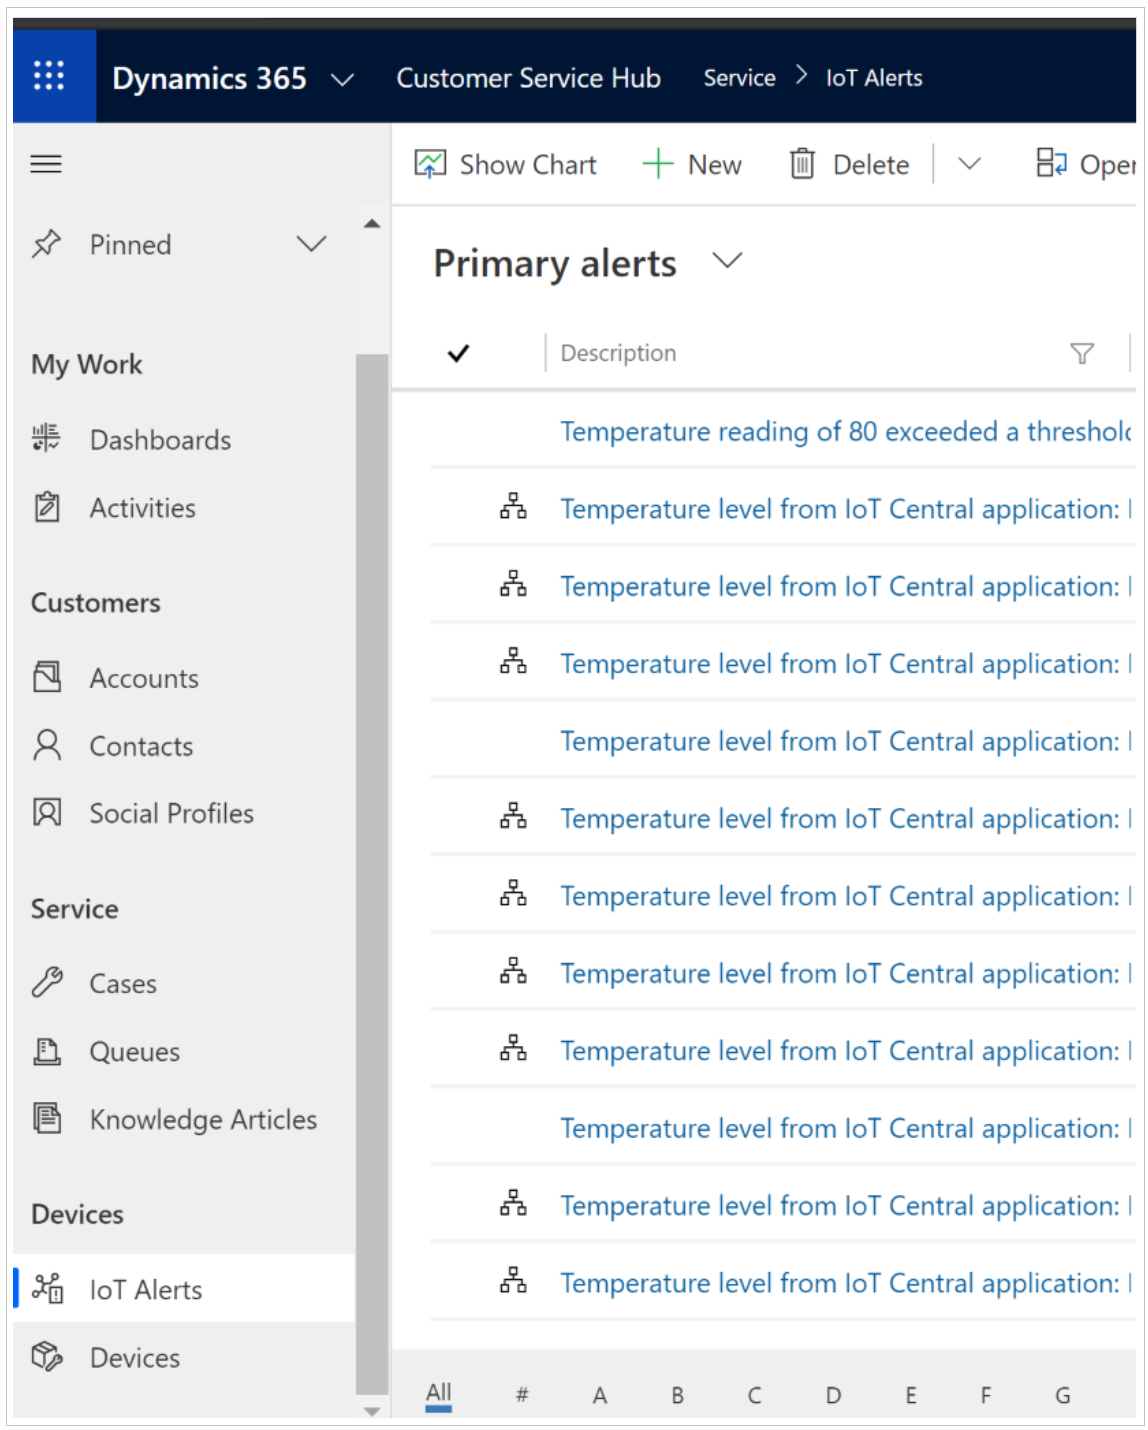
Verify that you have the Connected Customer Service entities in your environment.
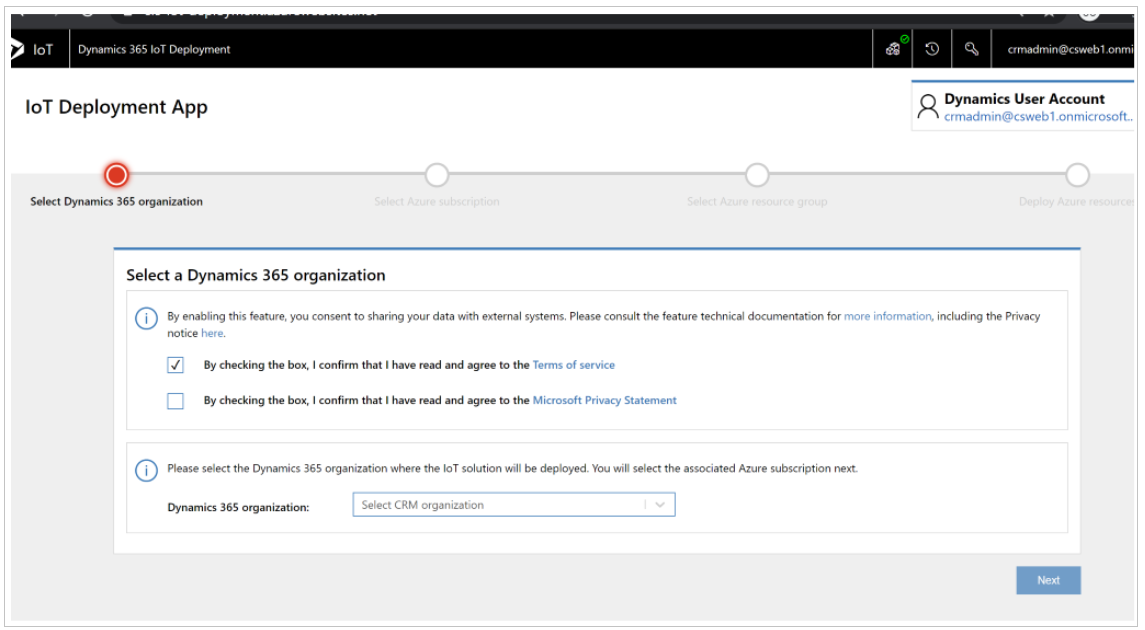
Deploy and connect Azure IoTHub to your Customer Service environment: Go to https://iotdeployment.dynamics.com/ and complete the steps.
Set up the sample simulator (optional)
To find the simulator URL, sign in to your Azure subscription, and then select the App Service resource type under the newly created resource group.
Copy the URL in the top-right corner, and then paste it into your browser's address bar to load the page.
When the simulator page opens, select Configuration.
Enter the IoT hub host name and key. The host is the name of the IoT Hub resource in the Azure portal.
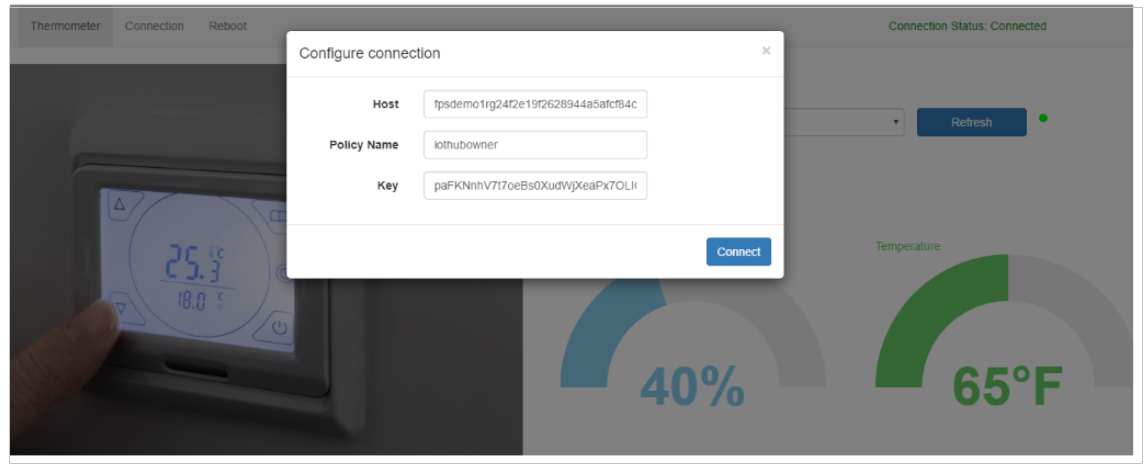
You can access the key by selecting the IoT Hub resource and going to the shared access policies, then copying the primary key for iothubowner as displayed in the following screenshot.
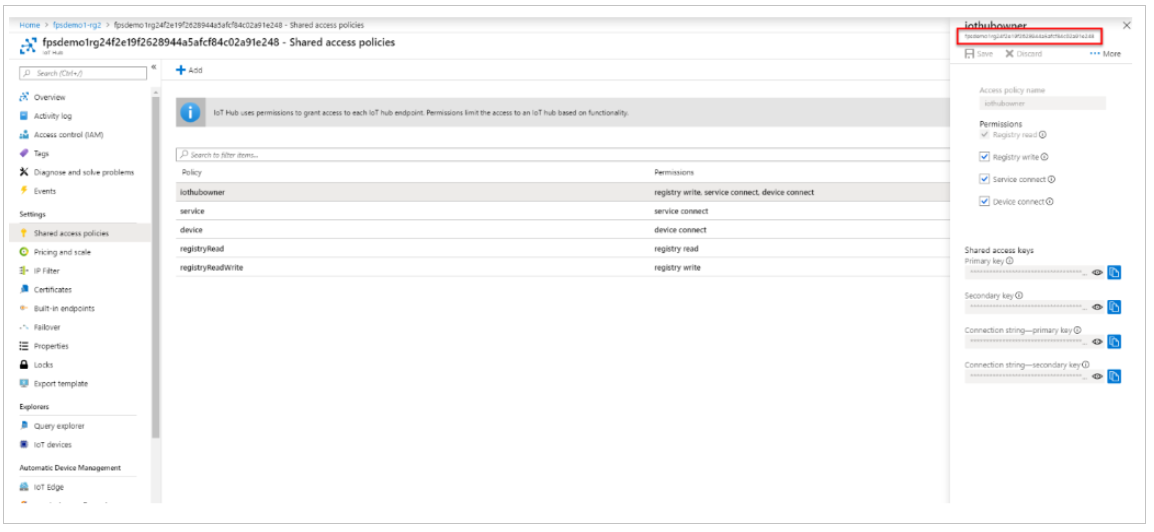
In the Resource Group, select the IoT hub, and then in General, select Shared access policies to get the host name and primary key.
Make sure Connection status is marked as Connected and then close the dialog.
Now you can send a test command by using the sample simulator. For example, select the temperature, and then increase it to above 70 degrees.
Set up a Power BI chart (optional)
Set up Power BI accounts and open the sample .pbix report.
Go to https://powerbi.microsoft.com and create a free Power BI account.
Sign in to Power BI Desktop with the Power BI user credentials (we recommend that this user is the same as the Dynamics 365 user).
Download and open the sample Power BI template.
The Power BI report opens with errors because it was created with a sample SQL database and user. Update the query with your SQL database and user, and then publish the report to Power BI.
Update the query to point to your SQL database
Select Edit Queries > Advanced Editor.
Replace the source SQL database with the database provisioned in your Azure resource group.
Select Close and Apply.
You can find your SQL server name in the SQL database in the Azure portal.
Add your IP address to the SQL server firewall to allow Power BI Desktop to connect to the SQL server.
Copy the IP address from the Refresh message that displays.
Go to the Azure portal, open the SQL server, and add your IP address to the firewall.
Publish to your Power BI account
Save your changes and publish.
Once you publish, Power BI Desktop provides a link and message that instructs you to open the report and provide credentials.
Once the report is open, a notification to edit your credentials appears.
To allow Power BI to access your database, enter the SQL server admin user name and password.
In the Power BI sidebar, open the report and pin these tiles to a dashboard. You can create a dashboard or pin to an existing one.
Save the dashboard, and then share it with any user who has permissions to access the dashboard and tiles: In the top-right corner of the dashboard, select Share, enter the user's email address, and then select Share.
Pin the tile in Dynamics 365
Open the device, alert, or asset form.
Important
The device that's related to any of the open forms must have a device ID and be registered. Otherwise, the Power BI section is hidden.
For the first instance, you must specify the tile you want pinned. After that, the tile loads when you go to the page.
Select the Add button.
A configuration window appears. Sign in if prompted.
Pick your dashboard and tile.
A preview of the tile loads. However, if you haven't run the simulator for that device, no data displays.
Save the tile.
The configuration window closes, and the Power BI section reloads with the pinned tile. The tile is filtered to the device ID of the current entity. The next time you load any of the device, alert, or asset forms, the Power BI section automatically loads the tile, filtered to the current entity device ID if there's a device ID and the device is registered.
Categorize devices
You can also manage devices by categorizing them. For example, you can categorize devices by the commands they support, the type of device, or by devices that break down more often.
Create a new IoT device category
In the site map of Copilot Service admin center, go to Operations, and then select Miscellaneous.
In the Device Categories section, select Manage. The Active IoT Device Categories view displays. You can switch between various system views using the dropdown list.
On the command bar, select New.
Enter a Name for the device category. Use the tooltips if you need help with filling in the requested information.
When you're done, select Save.
Open the IoT device category record that you created.
In the Devices section, select Add IoT Device record, and then add a device to the category.
Add devices to an existing category
On the main menu, select Internet of Things > Registered Devices.
Open an IoT device record by selecting it.
In the Category field, use the search button to find and add the device to a category.
View device readings
After a device is registered, you can open the record to view the readings sent by the device. For example, if you’re monitoring a thermostat, your reading shows the thermostat temperature.
By default, you can view the last 20 readings. You can change the default setting in the Power BI report by using Power BI Desktop.
To view a device reading, on the main menu, select Customer Service > Devices.
Select a device from the list and open the record. Refer to the Connect Device Readings section to view the device readings.
Remotely send commands to a registered device
When a device isn’t working properly, the system receives an alert. To troubleshoot the issue remotely, you can send a command by choosing a registered device or by using an existing IoT alert.
Note
When you receive multiple alerts from the same device, the alerts are listed in hierarchical order. You can change the grouping by changing the IoT - Parent IoT Alerts workflow.
Send commands from a registered device
On the main menu, select Customer Service > Devices.
Select a registered device from the list of devices.
On the command bar, select Send Command.
Enter a Name for the command.
In the MESSAGE TO SEND field, copy and paste one of these supported commands.
{"CommandName":"Reset Thermostat","Parameters":{}}{"CommandName":"Notification","Parameters":{"Message":"Technician has been dispatched"}}{"CommandName":"Set Values","Parameters":{"Reading":{"Temperature":"30","Humidity":"30"}}}Note
Before sending a command, make sure there aren't any spaces or extra characters in the command.
On the command bar, select Send & Close to send the command.
Respond to an alert
Navigate to Customer Service > IoT Alerts, and then select an existing IoT alert record.
On the command bar, select Send Command.
Enter a Name for the command.
In the MESSAGE TO SEND field, copy and paste one of the supported commands listed in the previous section.
On the command bar, select Send & Close to send the command.
View history of commands sent to a device
From the main menu, select Customer Service > Devices.
From the list, choose a device.
Scroll down to the Command section to view the history.
Create business process flows to automatically handle incoming IoT alerts
When you receive an alert from a device, your service team can manually monitor the alerts and troubleshoot the issue remotely. If the issue isn't resolved by sending a remote command, the service rep can create a case or work order and dispatch a field tech. The provided business process flow guides you through the process of manually responding to IoT alerts. Learn more in Create a business process flow
View the IoT dashboard
The default IoT dashboard provides data on registered devices and alerts. Learn more in Create or customize dashboards.
From the main menu, select Customer Service or Internet of Things.
Select Dashboard.
The first chart shows alerts that you can sort by selecting the IoT Alerts by menu.
The second chart shows alerts by time.
The third chart shows alerts, along with the action taken to resolve the issue.
Privacy notice
By installing Connected Customer Service for Dynamics 365, when you provide your Azure subscription information, the required Azure resources, listed in this section, deploy. Your Dynamics 365 Customer Engagement instance sends data, such as commands and registrations, to Azure to enable IoT–enabled scenarios that register devices and then sends and receives commands to the registered devices. An administrator can uninstall Connected Customer Service to remove the functionality, and then navigate to the Azure portal to manage any related Azure services that you don't need.
Azure components and services that are involved with Connected Customer Service functionality are detailed in the following sections.
For more information about Azure service offerings, go to Microsoft Azure Trust Center.
This offering provides a queue for both inbound and outbound messages (commands) flowing between Dynamics 365 Customer Engagement and Azure. When an IoT alert is sent to Dynamics 365 Customer Engagement, or a command is sent from Dynamics 365 Customer Engagement to the IoT hub, it's queued here.
This offering provides an orchestration service that uses a Dynamics 365 Customer Engagement connector and a Queue connector. Dynamics 365 Customer Engagement connectors are used to construct entities that are specific to Dynamics 365 Customer Engagement and Queue connectors are used for polling the queue.
This offering provides a fully managed, real-time event processing engine that helps to unlock deep insights from data. Stream Analytics makes it easy to set up real-time analytic computations on data streaming from devices, sensors, web sites, social media, applications, infrastructure systems, and more. It's functioning as a funnel to send selective IoT alerts to Dynamics 365 Customer Engagement.
Connected Customer Services uses the IoT Hub to manage the state of registered devices and assets. In addition, the IoT Hub sends commands and notifications to connected devices—and tracks message delivery with acknowledgment receipts. Device messages are sent in a durable way to accommodate intermittently connected devices.
Simulator
This offering is a test web app to emulate the device that is sending commands or receiving commands from the IoT hub.
Connected Customer Service uses SQL Azure to store device heartbeat messages for later use by Power BI to show the status of devices in Dynamics 365 Customer Engagement.
Queries that Stream Analytics uses are stored in Azure Blob storage.