Nota:
El acceso a esta página requiere autorización. Puede intentar iniciar sesión o cambiar directorios.
El acceso a esta página requiere autorización. Puede intentar cambiar los directorios.
El análisis de uso de aplicaciones proporciona a los administradores de TI información útil sobre el uso de la aplicación de su organización mediante el análisis de patrones de tráfico, el uso de datos y los usuarios que acceden a la aplicación. Los administradores pueden usar estos análisis para identificar shadow IT, aplicaciones de IA generativas y posibles riesgos de seguridad o cumplimiento. El análisis de uso ayuda a las organizaciones a aumentar la visibilidad, mejorar su posición de seguridad y optimizar el uso de la aplicación en su entorno.
Panel de conclusiones y análisis
Para acceder al panel información y análisis :
- Inicie sesión en el Centro de administración de Microsoft Entra como lector de registro de acceso seguro global.
- Vaya a Global Secure Access>Aplicaciones>Informes y Análisis.
El panel Información y análisis tiene tres widgets:
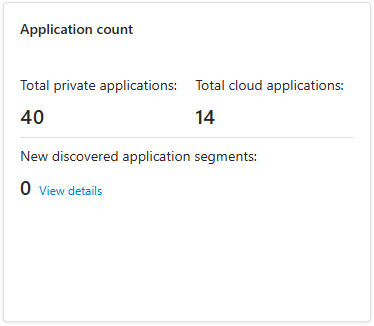
Recuento de aplicaciones
Este widget muestra las aplicaciones en la nube Totales, Total de aplicaciones privadas y el número de segmentos detectados nuevos usados en el tiempo seleccionado. Para obtener más información sobre los segmentos detectados, seleccione el botón Ver detalles para abrir la página Detección de aplicaciones.
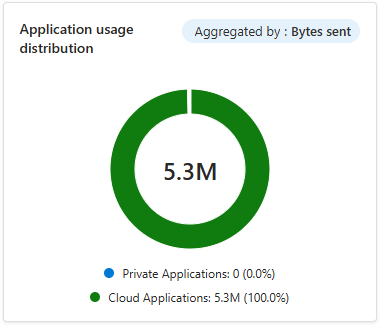
Distribución de uso de aplicaciones
Este widget muestra el uso de la aplicación por tipo, con un color para la nube y otro para las aplicaciones privadas en el intervalo de tiempo seleccionado. Puede agregar la vista por transacciones, bytes enviados o bytes recibidos.
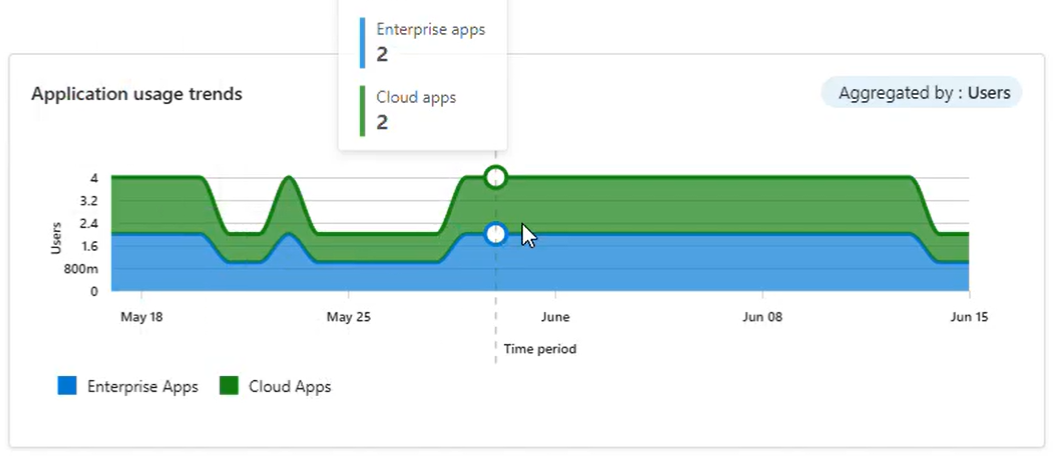
Tendencia de uso de aplicaciones
Este widget muestra el uso de la aplicación a lo largo del tiempo, con una tendencia para la nube y otra para las aplicaciones privadas. Puede agregar la vista por transacciones, usuarios, dispositivos, bytes enviados o bytes recibidos.
Análisis de aplicaciones privadas
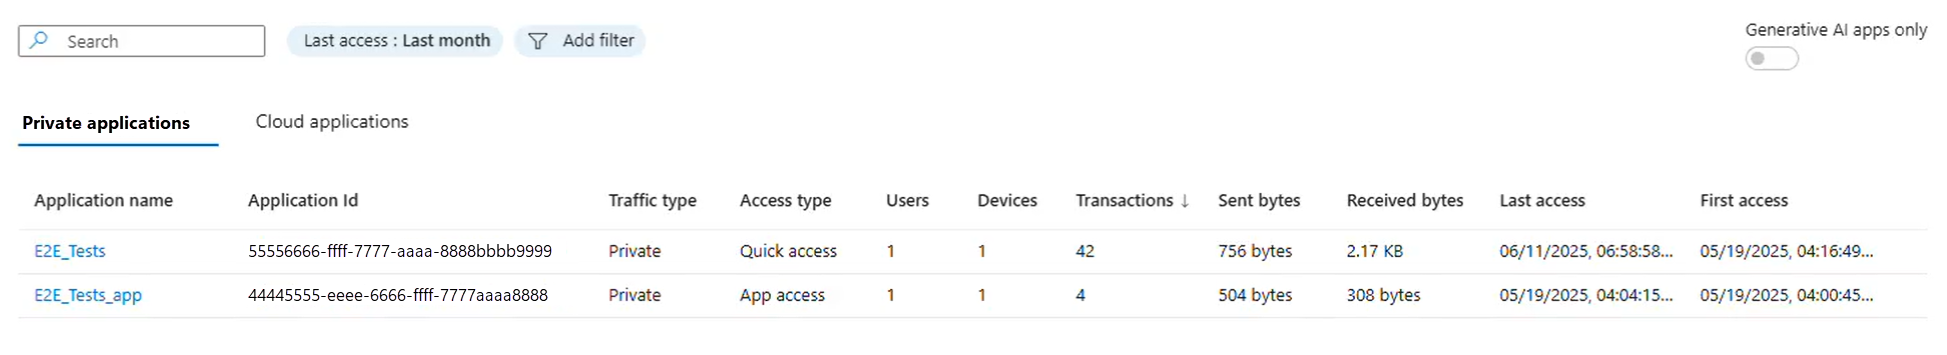
El análisis de aplicaciones privadas proporciona a los administradores de TI visibilidad e información sobre las aplicaciones empresariales privadas de su organización incorporadas a Microsoft Entra by Global Secure Access. Estas conclusiones incluyen el nombre de la aplicación, el identificador de la aplicación, los usuarios que acceden a la aplicación, los dispositivos usados, el tipo de acceso, el número de transacciones, el tráfico (bytes enviados y recibidos) y las horas de acceso primera y última. El análisis de aplicaciones privadas también realiza un seguimiento del acceso rápido para los clientes que lo han configurado.
Funcionalidades clave
Mediante el análisis de aplicaciones privado, puede hacer lo siguiente:
- Identifique las aplicaciones privadas a las que acceden los usuarios. Los detalles incluyen El nombre de la aplicación, el identificador de aplicación, el tipo de tráfico, el tipo de acceso, el número de usuarios, dispositivos y transacciones, bytes enviados, bytes recibidos, fecha de último acceso y Primera fecha de acceso .
Seleccione cada fila de aplicación privada para abrir un panel de información por aplicación con dos pestañas:
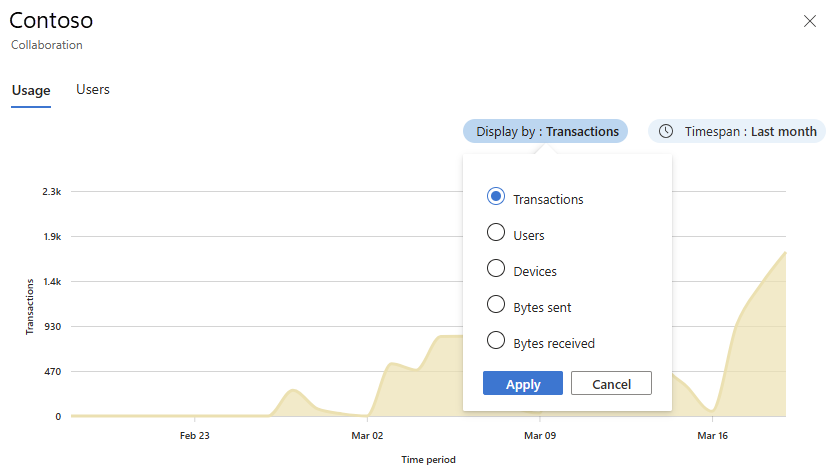
La pestaña Uso muestra un gráfico con información de uso, incluida la información sobre el número de transacciones, la cantidad de tráfico y el número de usuarios que acceden a las aplicaciones.
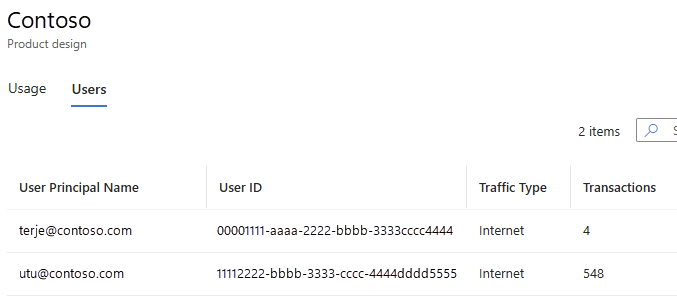
En la pestaña Usuarios se muestran estadísticas sobre el uso de un segmento de aplicación y qué usuarios acceden a él.
Análisis de aplicaciones en la nube
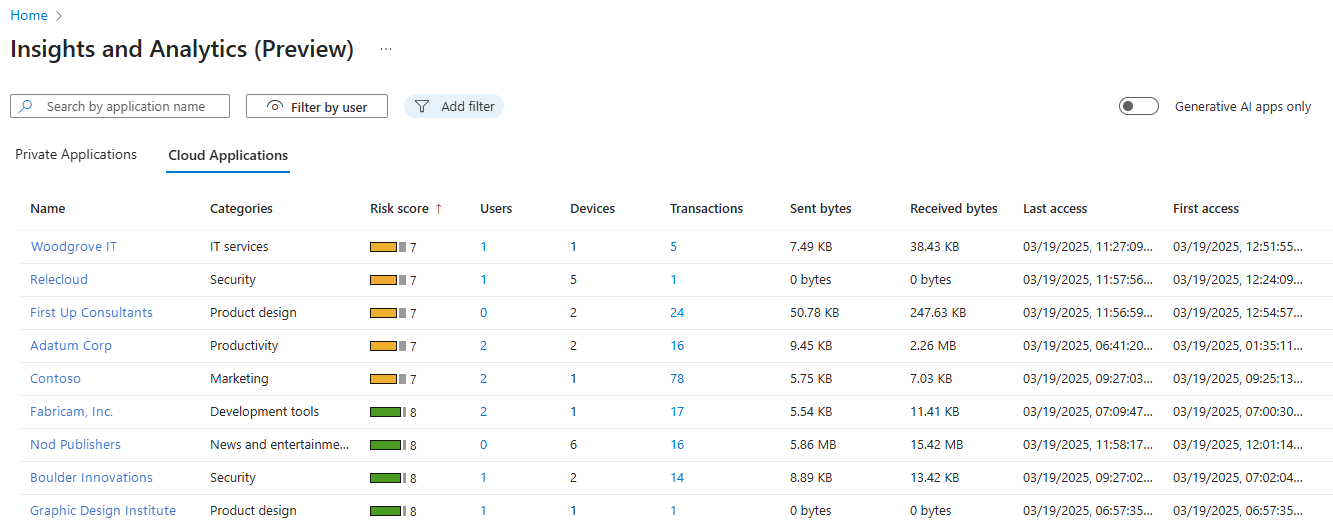
El análisis de aplicaciones en la nube proporciona a los administradores visibilidad e información sobre las aplicaciones en la nube que usa su organización, incluidas las aplicaciones de IA generativas. Estas conclusiones incluyen la categoría de aplicación, la puntuación de riesgo, el número de transacciones, el tráfico (bytes enviados y recibidos) y los usuarios que acceden a las aplicaciones.
Esta información ayuda a los administradores a identificar aplicaciones de IA generativas, aplicaciones de inteligencia artificial sombreada y shadow IT. La información de los análisis ayuda a los administradores a tomar decisiones basadas en el estado de seguridad y cumplimiento.
Funcionalidades clave
Mediante el análisis de aplicaciones en la nube, puede hacer lo siguiente:
Identifique las aplicaciones en la nube a las que acceden los usuarios (mediante el catálogo de aplicaciones en la nube de Microsoft Defender for Cloud Apps), tanto para internet como para el tráfico de Microsoft 365. Los detalles incluyen Nombre, Categorías, Puntuación de riesgo, número de Usuarios, Bytes enviados, Bytes recibidos, Fecha de último acceso y Primera fecha de acceso .
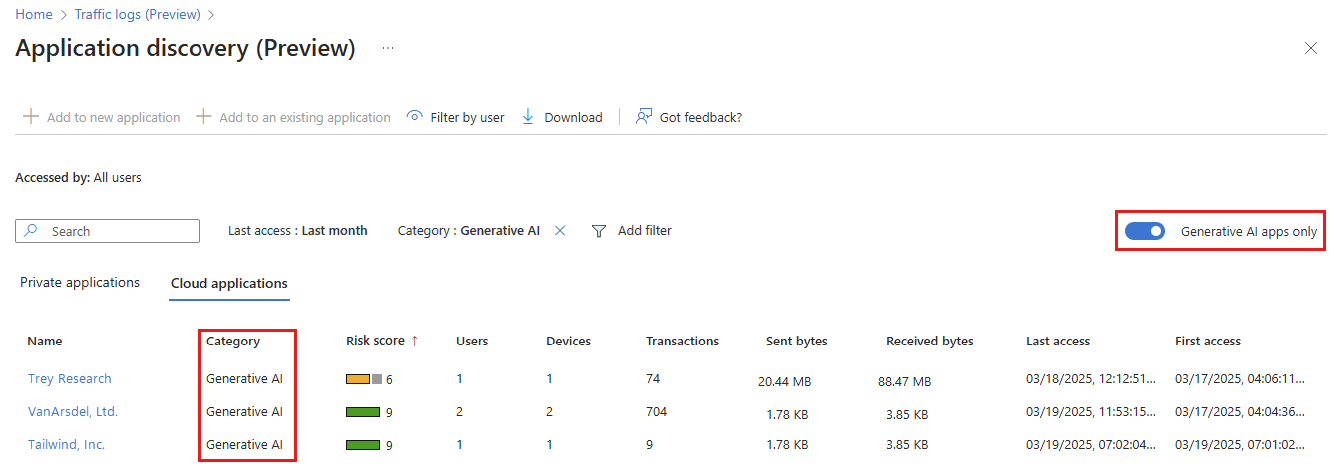
Usa el interruptor Sólo aplicaciones de IA generativa para identificar las aplicaciones de IA generativa a las que acceden los usuarios, tanto para el tráfico de Internet como para el tráfico de Microsoft 365.

Los vínculos de cada fila de aplicación en la nube se abren para mostrar detalles específicos sobre esa aplicación.
Detalles de la aplicación y factores de riesgo
Para ver los detalles de la aplicación y los factores de riesgo, seleccione el vínculo Nombre de la aplicación.

Se abre la Galería de aplicaciones de Microsoft Entra , en la que se muestran los detalles de la aplicación seleccionada. En la lista de detalles de la aplicación se muestra la puntuación de riesgo general. Puede ver más detalles del factor de riesgo seleccionando cada una de las pestañas General, Seguridad, Cumplimiento o Legal .

Datos de usuario de la aplicación
Para ver los datos de usuario, seleccione el vínculo Usuarios de la aplicación.

En la pestaña Usuarios se muestran estadísticas sobre el uso de un segmento de aplicación y qué usuarios acceden a él.
Datos de uso de aplicaciones
Para ver los datos de uso, seleccione el vínculo Transacciones de la aplicación.

Se abre la pestaña Uso , que muestra un gráfico con información de uso, incluido el número de transacciones, la cantidad de tráfico y el número de usuarios que acceden a las aplicaciones.