Nota
El acceso a esta página requiere autorización. Puede intentar iniciar sesión o cambiar directorios.
El acceso a esta página requiere autorización. Puede intentar cambiar los directorios.
En este artículo se muestra cómo crear cada tipo de gráfico de Excel compatible con scripts de Office. Cada ejemplo incluye datos y muestra las API específicas de ese tipo de gráfico. Use estos ejemplos como puntos de partida para sus propias soluciones de gráficos.
Nota:
Ejecute estos ejemplos directamente desde el Editor de código de Scripts de Office. Para abrir el Editor de código, vaya a Automatizar>nueva creación de script>en el Editor de código. Reemplace el código predeterminado por el código de ejemplo que desea ejecutar y, a continuación, seleccione Ejecutar.
Sugerencia
Para obtener los mejores resultados, ejecute cada ejemplo en una hoja de cálculo vacía.
Gráficos de columnas
Los gráficos de columnas muestran los datos como barras verticales, lo que los hace ideales para comparar valores entre categorías.
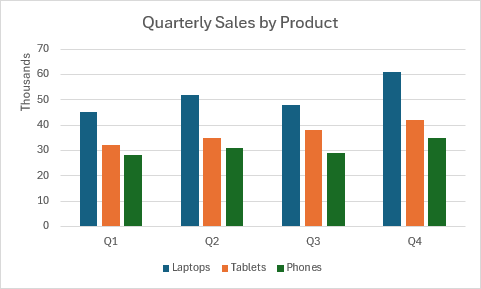
Gráfico agrupado de columnas
En este ejemplo se crea un gráfico de columnas agrupadas que compara las ventas trimestrales entre diferentes productos.
function main(workbook: ExcelScript.Workbook) {
  const sheet = workbook.getActiveWorksheet();

  // Add sample data.
  const data = [
    ["Product", "Q1", "Q2", "Q3", "Q4"],
    ["Laptops", 45000, 52000, 48000, 61000],
    ["Tablets", 32000, 35000, 38000, 42000],
    ["Phones", 28000, 31000, 29000, 35000]
  ];
  const dataRange = sheet.getRange("A1:E4");
  dataRange.setValues(data);

  // Create column clustered chart.
  const chart = sheet.addChart(
    ExcelScript.ChartType.columnClustered,
    dataRange
  );
  chart.setPosition("A6");
  chart.getTitle().setText("Quarterly Sales by Product");

  // Customize the chart.
  chart.getLegend().setPosition(ExcelScript.ChartLegendPosition.bottom);
  chart.getAxes().getValueAxis().setDisplayUnit(ExcelScript.ChartAxisDisplayUnit.thousands);
}
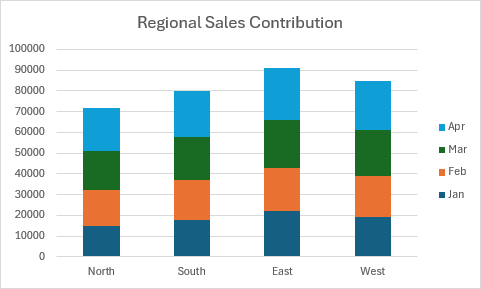
Gráfico apilado de columnas
En este ejemplo se crea un gráfico de columnas apiladas que muestra la composición de las ventas por región.
function main(workbook: ExcelScript.Workbook) {
  const sheet = workbook.getActiveWorksheet();

  // Add sample data.
  const data = [
    ["Month", "North", "South", "East", "West"],
    ["Jan", 15000, 18000, 22000, 19000],
    ["Feb", 17000, 19000, 21000, 20000],
    ["Mar", 19000, 21000, 23000, 22000],
    ["Apr", 21000, 22000, 25000, 24000]
  ];
  const dataRange = sheet.getRange("A1:E5");
  dataRange.setValues(data);

  // Create stacked column chart.
  const chart = sheet.addChart(
    ExcelScript.ChartType.columnStacked,
    dataRange
  );
  chart.setPosition("A7");
  chart.getTitle().setText("Regional Sales Contribution");

  // Customize chart.
  chart.getLegend().setPosition(ExcelScript.ChartLegendPosition.right);
  chart.getAxes().getCategoryAxis().setReversePlotOrder(false);
}
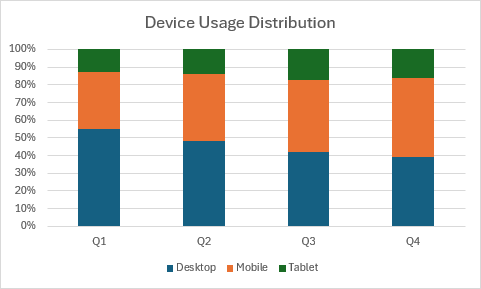
Gráfico de columnas apiladas al 100 %
En este ejemplo se crea un gráfico de columnas apiladas al 100 % que muestra la distribución porcentual.
function main(workbook: ExcelScript.Workbook) {
  const sheet = workbook.getActiveWorksheet();

  // Add sample data.
  const data = [
    ["Category", "Desktop", "Mobile", "Tablet"],
    ["Q1", 5500, 3200, 1300],
    ["Q2", 4800, 3800, 1400],
    ["Q3", 4200, 4100, 1700],
    ["Q4", 3900, 4500, 1600]
  ];
  const dataRange = sheet.getRange("A1:D5");
  dataRange.setValues(data);

  // Create 100% stacked column chart.
  const chart = sheet.addChart(
    ExcelScript.ChartType.columnStacked100,
    dataRange
  );
  chart.setPosition("A7");
  chart.getTitle().setText("Device Usage Distribution");
}
Gráficos de barras
Los gráficos de barras muestran los datos como barras horizontales. Son útiles cuando los nombres de categoría son largos o tiene muchas categorías.
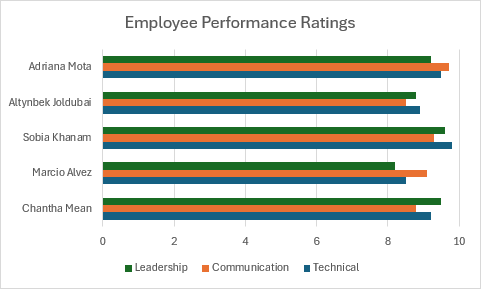
Gráfico agrupado de barras
En este ejemplo se crea un gráfico de barras en clúster que compara las clasificaciones de rendimiento de los empleados.
function main(workbook: ExcelScript.Workbook) {
  const sheet = workbook.getActiveWorksheet();

  // Add sample data.
  const data = [
    ["Employee", "Technical", "Communication", "Leadership"],
    ["Chantha Mean", 9.2, 8.8, 9.5],
    ["Marcio Alvez", 8.5, 9.1, 8.2],
    ["Sobia Khanam", 9.8, 9.3, 9.6],
    ["Altynbek Joldubai", 8.9, 8.5, 8.8],
    ["Adriana Mota", 9.5, 9.7, 9.2]
  ];
  const dataRange = sheet.getRange("A1:D6");
  dataRange.setValues(data);

  // Create bar clustered chart.
  const chart = sheet.addChart(
    ExcelScript.ChartType.barClustered,
    dataRange
  );
  chart.setPosition("A8");
  chart.getTitle().setText("Employee Performance Ratings");

  // Customize.
  chart.getLegend().setPosition(ExcelScript.ChartLegendPosition.bottom);
  chart.getAxes().getValueAxis().setMinimum(0);
  chart.getAxes().getValueAxis().setMaximum(10);
}
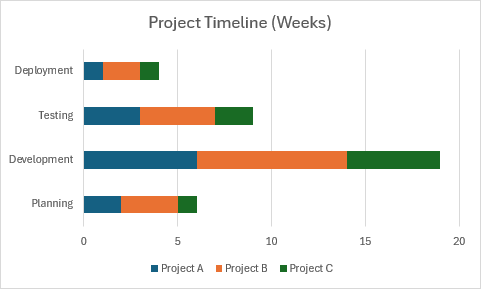
Gráfico apilado de barras
function main(workbook: ExcelScript.Workbook) {
  const sheet = workbook.getActiveWorksheet();

  // Add sample data.
  const data = [
    ["Project Phase", "Planning", "Development", "Testing", "Deployment"],
    ["Project A", 2, 6, 3, 1],
    ["Project B", 3, 8, 4, 2],
    ["Project C", 1, 5, 2, 1]
  ];
  const dataRange = sheet.getRange("A1:E4");
  dataRange.setValues(data);

  // Create bar stacked chart.
  const chart = sheet.addChart(
    ExcelScript.ChartType.barStacked,
    dataRange
  );
  chart.setPosition("A6");
  chart.getTitle().setText("Project Timeline (Weeks)");

  chart.getLegend().setPosition(ExcelScript.ChartLegendPosition.bottom);
}
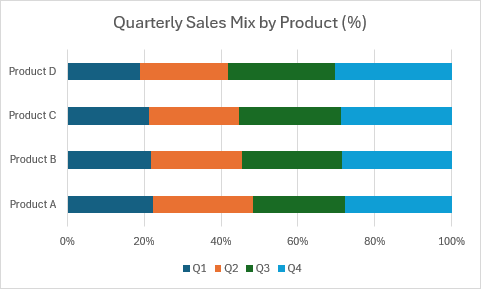
Gráfico de barras 100% apiladas
En este ejemplo se crea un gráfico de barras apiladas al 100 % que muestra la distribución porcentual entre categorías.
function main(workbook: ExcelScript.Workbook) {
  const sheet = workbook.getActiveWorksheet();

  // Add sample data.
  const data = [
    ["Quarter", "Product A", "Product B", "Product C", "Product D"],
    ["Q1", 45000, 32000, 28000, 15000],
    ["Q2", 52000, 35000, 31000, 18000],
    ["Q3", 48000, 38000, 35000, 22000],
    ["Q4", 56000, 42000, 38000, 24000]
  ];
  const dataRange = sheet.getRange("A1:E5");
  dataRange.setValues(data);

  // Create 100% stacked bar chart.
  const chart = sheet.addChart(
    ExcelScript.ChartType.barStacked100,
    dataRange
  );
  chart.setPosition("A7");
  chart.getTitle().setText("Quarterly Sales Mix by Product (%)");

  chart.getLegend().setPosition(ExcelScript.ChartLegendPosition.bottom);
}
Gráficos de líneas
Los gráficos de líneas muestran tendencias a lo largo del tiempo. Son perfectos para mostrar datos continuos.
Gráfico de líneas
En este ejemplo se crea un gráfico de líneas básico que muestra las tendencias de temperatura.

function main(workbook: ExcelScript.Workbook) {
  const sheet = workbook.getActiveWorksheet();

  // Add sample data.
  const data = [
    ["Month", "Avg Temp (°F)"],
    ["Jan", 42],
    ["Feb", 45],
    ["Mar", 52],
    ["Apr", 61],
    ["May", 70],
    ["Jun", 78],
    ["Jul", 84],
    ["Aug", 82],
    ["Sep", 75],
    ["Oct", 64],
    ["Nov", 53],
    ["Dec", 45]
  ];
  const dataRange = sheet.getRange("A1:B13");
  dataRange.setValues(data);

  // Create line chart.
  const chart = sheet.addChart(
    ExcelScript.ChartType.line,
    dataRange
  );
  chart.setPosition("D1");
  chart.getTitle().setText("Average Monthly Temperature");

  // Customize line chart.
  chart.getAxes().getCategoryAxis().setTickLabelPosition(
    ExcelScript.ChartAxisTickLabelPosition.low
  );
  chart.getAxes().getValueAxis().getMajorGridlines().getFormat().getLine().setColor("gray");
}
Gráfico de líneas con marcadores
En este ejemplo se crea un gráfico de líneas con marcadores para enfatizar puntos de datos individuales.

function main(workbook: ExcelScript.Workbook) {
  const sheet = workbook.getActiveWorksheet();

  // Add sample data.
  const data = [
    ["Week", "Website A", "Website B", "Website C"],
    ["Week 1", 1250, 980, 1100],
    ["Week 2", 1380, 1050, 1150],
    ["Week 3", 1520, 1180, 1320],
    ["Week 4", 1690, 1280, 1450],
    ["Week 5", 1850, 1420, 1580],
    ["Week 6", 2020, 1590, 1720]
  ];
  const dataRange = sheet.getRange("A1:D7");
  dataRange.setValues(data);

  // Create line chart with markers.
  const chart = sheet.addChart(
    ExcelScript.ChartType.lineMarkers,
    dataRange
  );
  chart.setPosition("A9");
  chart.getTitle().setText("Weekly Visitor Growth");

  // Customize markers.
  const series = chart.getSeries();
  series.forEach((s) => {
    s.setMarkerSize(8);
    s.setMarkerStyle(ExcelScript.ChartMarkerStyle.circle);
  });
}
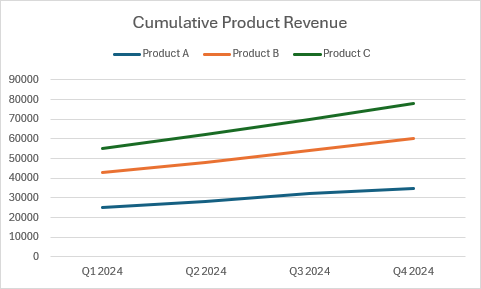
Gráfico apilado de líneas
function main(workbook: ExcelScript.Workbook) {
  const sheet = workbook.getActiveWorksheet();

  // Add sample data.
  const data = [
    ["Quarter", "Product A", "Product B", "Product C"],
    ["Q1 2024", 25000, 18000, 12000],
    ["Q2 2024", 28000, 20000, 14000],
    ["Q3 2024", 32000, 22000, 16000],
    ["Q4 2024", 35000, 25000, 18000]
  ];
  const dataRange = sheet.getRange("A1:D5");
  dataRange.setValues(data);

  // Create stacked line chart.
  const chart = sheet.addChart(
    ExcelScript.ChartType.lineStacked,
    dataRange
  );
  chart.setPosition("A7");
  chart.getTitle().setText("Cumulative Product Revenue");

  chart.getLegend().setPosition(ExcelScript.ChartLegendPosition.top);
}
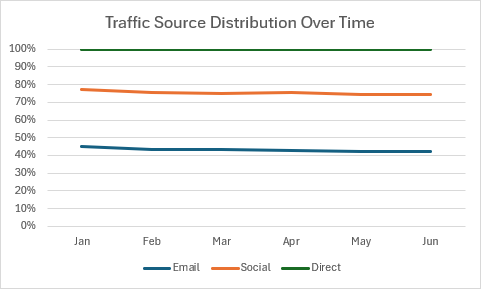
Gráfico de líneas apiladas al 100 %
En este ejemplo se crea un gráfico de líneas apilado al 100 % que muestra la distribución porcentual a lo largo del tiempo.
function main(workbook: ExcelScript.Workbook) {
  const sheet = workbook.getActiveWorksheet();

  // Add sample data.
  const data = [
    ["Month", "Email", "Social", "Direct"],
    ["Jan", 450, 320, 230],
    ["Feb", 480, 350, 270],
    ["Mar", 520, 380, 300],
    ["Apr", 560, 420, 320],
    ["May", 590, 450, 360],
    ["Jun", 630, 490, 380]
  ];
  const dataRange = sheet.getRange("A1:D7");
  dataRange.setValues(data);

  // Create 100% stacked line chart.
  const chart = sheet.addChart(
    ExcelScript.ChartType.lineStacked100,
    dataRange
  );
  chart.setPosition("A9");
  chart.getTitle().setText("Traffic Source Distribution Over Time");

  chart.getLegend().setPosition(ExcelScript.ChartLegendPosition.bottom);
}
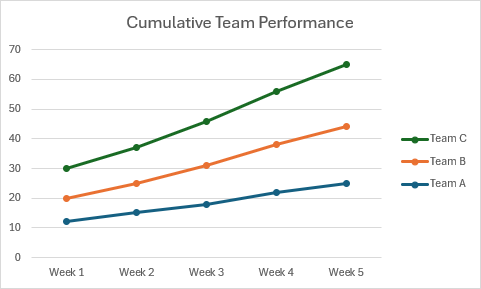
Línea con gráfico apilado de marcadores
En este ejemplo se crea un gráfico de líneas apiladas con marcadores.
function main(workbook: ExcelScript.Workbook) {
  const sheet = workbook.getActiveWorksheet();

  // Add sample data.
  const data = [
    ["Week", "Team A", "Team B", "Team C"],
    ["Week 1", 12, 8, 10],
    ["Week 2", 15, 10, 12],
    ["Week 3", 18, 13, 15],
    ["Week 4", 22, 16, 18],
    ["Week 5", 25, 19, 21]
  ];
  const dataRange = sheet.getRange("A1:D6");
  dataRange.setValues(data);

  // Create stacked line chart with markers.
  const chart = sheet.addChart(
    ExcelScript.ChartType.lineMarkersStacked,
    dataRange
  );
  chart.setPosition("A8");
  chart.getTitle().setText("Cumulative Team Performance");

  chart.getLegend().setPosition(ExcelScript.ChartLegendPosition.right);
}
Línea con marcadores apilados 100% gráfico
En este ejemplo se crea un gráfico de líneas 100 % apilado con marcadores.

function main(workbook: ExcelScript.Workbook) {
  const sheet = workbook.getActiveWorksheet();

  // Add sample data.
  const data = [
    ["Quarter", "Product Line A", "Product Line B", "Product Line C"],
    ["Q1", 35, 40, 25],
    ["Q2", 38, 37, 25],
    ["Q3", 40, 35, 25],
    ["Q4", 42, 33, 25]
  ];
  const dataRange = sheet.getRange("A1:D5");
  dataRange.setValues(data);

  // Create 100% stacked line chart with markers.
  const chart = sheet.addChart(
    ExcelScript.ChartType.lineMarkersStacked100,
    dataRange
  );
  chart.setPosition("A7");
  chart.getTitle().setText("Product Line Market Share Trends");

  chart.getLegend().setPosition(ExcelScript.ChartLegendPosition.bottom);
}
Gráficos circulares
Los gráficos circulares muestran relaciones proporcionales en un conjunto de datos. Cada valor aparece como un segmento del todo.
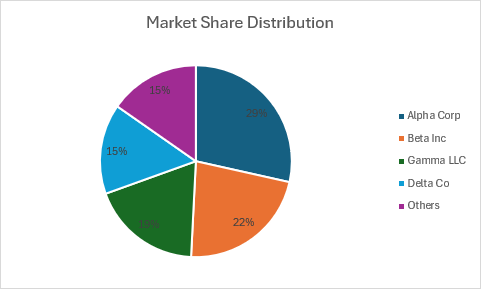
Gráfico circular
En este ejemplo se crea un gráfico circular que muestra la distribución de la cuota de mercado.
function main(workbook: ExcelScript.Workbook) {
  const sheet = workbook.getActiveWorksheet();

  // Add sample data with multiple slices.
  const data = [
    ["Company", "Market Share"],
    ["Alpha Corp", 28.5],
    ["Beta Inc", 22.3],
    ["Gamma LLC", 18.7],
    ["Delta Co", 15.2],
    ["Others", 15.3]
  ];
  const dataRange = sheet.getRange("A1:B6");
  dataRange.setValues(data);

  // Create pie chart.
  const chart = sheet.addChart(
    ExcelScript.ChartType.pie,
    dataRange
  );
  chart.setPosition("D1");
  chart.getTitle().setText("Market Share Distribution");

  // Customize pie chart.
  chart.getLegend().setPosition(ExcelScript.ChartLegendPosition.right);

  // Add data labels showing percentages.
  const series = chart.getSeries()[0];
  series.setHasDataLabels(true);
  series.getDataLabels().setShowPercentage(true);
  series.getDataLabels().setShowSeriesName(false);
  series.getDataLabels().setShowCategoryName(false);
  series.getDataLabels().setShowValue(false);
}
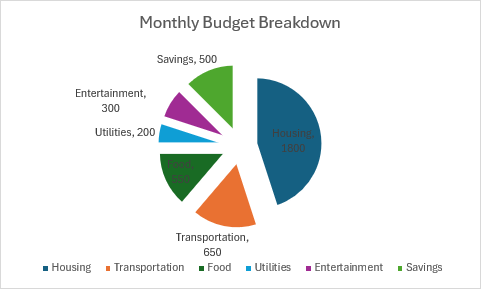
Gráfico circular explosionado
En este ejemplo se crea un gráfico circular desglosado con segmentos separados para énfasis.
function main(workbook: ExcelScript.Workbook) {
  const sheet = workbook.getActiveWorksheet();

  // Add sample data.
  const data = [
    ["Expense Category", "Amount"],
    ["Housing", 1800],
    ["Transportation", 650],
    ["Food", 550],
    ["Utilities", 200],
    ["Entertainment", 300],
    ["Savings", 500]
  ];
  const dataRange = sheet.getRange("A1:B7");
  dataRange.setValues(data);

  // Create exploded pie chart.
  const chart = sheet.addChart(
    ExcelScript.ChartType.pieExploded,
    dataRange
  );
  chart.setPosition("D1");
  chart.getTitle().setText("Monthly Budget Breakdown");

  // Customize.
  const series = chart.getSeries()[0];
  series.setHasDataLabels(true);
  series.getDataLabels().setShowCategoryName(true);
  series.getDataLabels().setShowValue(true);
  series.getDataLabels().setPosition(ExcelScript.ChartDataLabelPosition.bestFit);
}
Gráficos de anillos
Los gráficos de anillos son similares a los gráficos circulares, pero pueden mostrar varias series de datos y tener un agujero en el centro.
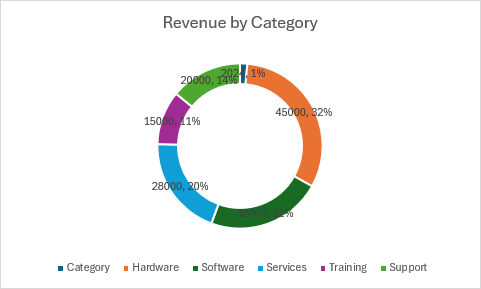
Gráfico de anillos
function main(workbook: ExcelScript.Workbook) {
  const sheet = workbook.getActiveWorksheet();

  // Add sample data.
  const data = [
    ["Category", "2024"],
    ["Hardware", 45000],
    ["Software", 32000],
    ["Services", 28000],
    ["Training", 15000],
    ["Support", 20000]
  ];
  const dataRange = sheet.getRange("A1:B6");
  dataRange.setValues(data);

  // Create doughnut chart.
  const chart = sheet.addChart(
    ExcelScript.ChartType.doughnut,
    dataRange
  );
  chart.setPosition("D1");
  chart.getTitle().setText("Revenue by Category");

  // Customize doughnut chart.
  const series = chart.getSeries()[0];
  series.setHasDataLabels(true);
  series.getDataLabels().setShowPercentage(true);
  series.getDataLabels().setShowLeaderLines(true);

  chart.getLegend().setPosition(ExcelScript.ChartLegendPosition.bottom);
}
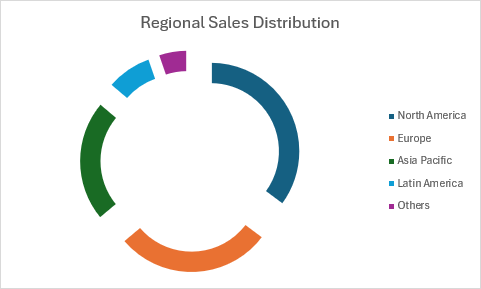
Gráfico de anillos explotados
function main(workbook: ExcelScript.Workbook) {
  const sheet = workbook.getActiveWorksheet();

  // Add sample data.
  const data = [
    ["Region", "Sales %"],
    ["North America", 35.2],
    ["Europe", 28.7],
    ["Asia Pacific", 22.3],
    ["Latin America", 8.5],
    ["Others", 5.3]
  ];
  const dataRange = sheet.getRange("A1:B6");
  dataRange.setValues(data);

  // Create exploded doughnut chart.
  const chart = sheet.addChart(
    ExcelScript.ChartType.doughnutExploded,
    dataRange
  );
  chart.setPosition("D1");
  chart.getTitle().setText("Regional Sales Distribution");

  chart.getLegend().setPosition(ExcelScript.ChartLegendPosition.right);
}
Gráficos de áreas
Los gráficos de áreas enfatizan la magnitud del cambio con el tiempo y muestran el total acumulado.
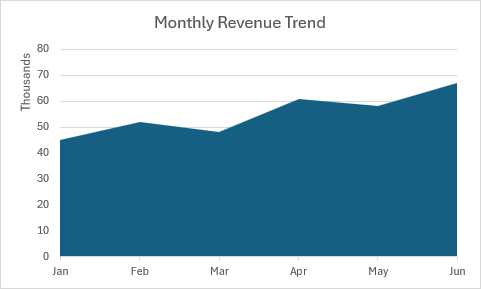
Gráfico de áreas
function main(workbook: ExcelScript.Workbook) {
  const sheet = workbook.getActiveWorksheet();

  // Add sample data.
  const data = [
    ["Month", "Revenue"],
    ["Jan", 45000],
    ["Feb", 52000],
    ["Mar", 48000],
    ["Apr", 61000],
    ["May", 58000],
    ["Jun", 67000]
  ];
  const dataRange = sheet.getRange("A1:B7");
  dataRange.setValues(data);

  // Create area chart.
  const chart = sheet.addChart(
    ExcelScript.ChartType.area,
    dataRange
  );
  chart.setPosition("D1");
  chart.getTitle().setText("Monthly Revenue Trend");

  // Customize area chart.
  chart.getAxes().getValueAxis().setDisplayUnit(
    ExcelScript.ChartAxisDisplayUnit.thousands
  );
}
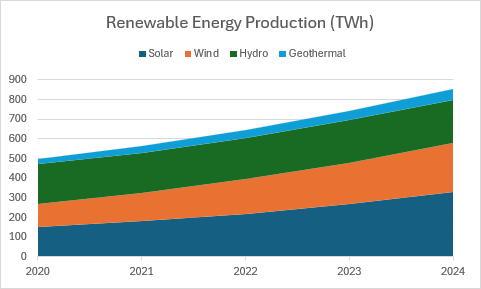
Gráfico de áreas apiladas
function main(workbook: ExcelScript.Workbook) {
  const sheet = workbook.getActiveWorksheet();

  // Add sample data.
  const data = [
    ["", "Solar", "Wind", "Hydro", "Geothermal"],
    ["2020", 150, 120, 200, 30],
    ["2021", 180, 145, 205, 35],
    ["2022", 220, 175, 210, 40],
    ["2023", 270, 210, 215, 48],
    ["2024", 330, 250, 220, 55]
  ];
  const dataRange = sheet.getRange("A1:E6");
  dataRange.setValues(data);

  // Create stacked area chart.
  const chart = sheet.addChart(
    ExcelScript.ChartType.areaStacked,
    dataRange
  );
  chart.setPosition("A8");
  chart.getTitle().setText("Renewable Energy Production (TWh)");

  chart.getLegend().setPosition(ExcelScript.ChartLegendPosition.top);
}
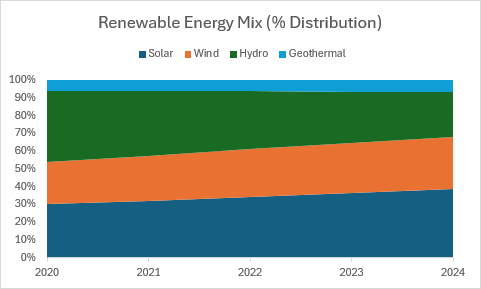
Gráfico de áreas 100% apiladas
En este ejemplo se crea un gráfico de áreas apiladas al 100 % que muestra la distribución porcentual a lo largo del tiempo.
function main(workbook: ExcelScript.Workbook) {
  const sheet = workbook.getActiveWorksheet();

  // Add sample data.
    const data = [
    ["", "Solar", "Wind", "Hydro", "Geothermal"],
    ["2020", 150, 120, 200, 30],
    ["2021", 180, 145, 205, 35],
    ["2022", 220, 175, 210, 40],
    ["2023", 270, 210, 215, 48],
    ["2024", 330, 250, 220, 55]
  ];
  const dataRange = sheet.getRange("A1:E6");
  dataRange.setValues(data);

  // Create 100% stacked area chart.
  const chart = sheet.addChart(
    ExcelScript.ChartType.areaStacked100,
    dataRange
  );
  chart.setPosition("A8");
  chart.getTitle().setText("Renewable Energy Mix (% Distribution)");

  // Label the series with energy source names.
  const seriesCollection = chart.getSeries();
  seriesCollection[0].setName("Solar");
  seriesCollection[1].setName("Wind");
  seriesCollection[2].setName("Hydro");
  seriesCollection[3].setName("Geothermal");

  chart.getLegend().setPosition(ExcelScript.ChartLegendPosition.top);
}
Gráficos de dispersión (XY)
Los gráficos de dispersión muestran relaciones entre dos variables numéricas. Úselas para el análisis de correlación.
Gráfico de dispersión

function main(workbook: ExcelScript.Workbook) {
  const sheet = workbook.getActiveWorksheet();

  // Add sample data.
  const data = [
    ["Study Hours", "Test Score"],
    [2, 65],
    [3, 68],
    [4, 72],
    [5, 75],
    [5.5, 78],
    [6, 82],
    [7, 85],
    [7.5, 88],
    [8, 90],
    [9, 92],
    [10, 95]
  ];
  const dataRange = sheet.getRange("A1:B12");
  dataRange.setValues(data);

  // Create scatter chart.
  const chart = sheet.addChart(
    ExcelScript.ChartType.xyscatter,
    dataRange
  );
  chart.setPosition("D1");
  chart.getTitle().setText("Study Hours vs Test Scores");

  // Customize scatter chart.
  chart.getAxes().getCategoryAxis().setDisplayUnit(ExcelScript.ChartAxisDisplayUnit.none);
  chart.getAxes().getValueAxis().setMinimum(0);
  chart.getAxes().getValueAxis().setMaximum(100);

  // Remove legend as there's only one series.
  chart.getLegend().setVisible(false);
}
Dispersión con gráfico de líneas

function main(workbook: ExcelScript.Workbook) {
  const sheet = workbook.getActiveWorksheet();

  // Add sample data.
  const data = [
    ["Temperature (°C)", "Sales ($)"],
    [15, 2500],
    [18, 2800],
    [22, 3200],
    [25, 3800],
    [28, 4500],
    [32, 5200],
    [35, 5800],
    [38, 6100]
  ];
  const dataRange = sheet.getRange("A1:B9");
  dataRange.setValues(data);

  // Create scatter chart with lines.
  const chart = sheet.addChart(
    ExcelScript.ChartType.xyscatterLines,
    dataRange
  );
  chart.setPosition("D1");
  chart.getTitle().setText("Ice Cream Sales vs Temperature");

  chart.getLegend().setVisible(false);
}
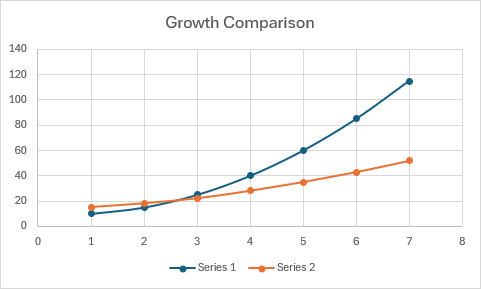
Gráfico de dispersión con líneas lisas
function main(workbook: ExcelScript.Workbook) {
  const sheet = workbook.getActiveWorksheet();

  // Add sample data.
  const data = [
    ["X", "Series 1", "Series 2"],
    [1, 10, 15],
    [2, 15, 18],
    [3, 25, 22],
    [4, 40, 28],
    [5, 60, 35],
    [6, 85, 43],
    [7, 115, 52]
  ];
  const dataRange = sheet.getRange("A1:C8");
  dataRange.setValues(data);

  // Create scatter chart with smooth lines.
  const chart = sheet.addChart(
    ExcelScript.ChartType.xyscatterSmooth,
    dataRange
  );
  chart.setPosition("D1");
  chart.getTitle().setText("Growth Comparison");

  chart.getLegend().setPosition(ExcelScript.ChartLegendPosition.bottom);
}
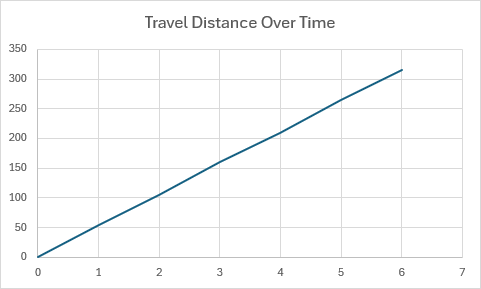
Gráfico de dispersión con líneas (sin marcadores)
En este ejemplo se crea un gráfico de dispersión con líneas de conexión, pero sin marcadores de punto de datos.
function main(workbook: ExcelScript.Workbook) {
  const sheet = workbook.getActiveWorksheet();

  // Add sample data.
  const data = [
    ["Time (hours)", "Distance (miles)"],
    [0, 0],
    [1, 55],
    [2, 105],
    [3, 160],
    [4, 210],
    [5, 265],
    [6, 315]
  ];
  const dataRange = sheet.getRange("A1:B8");
  dataRange.setValues(data);

  // Create scatter chart with lines but no markers.
  const chart = sheet.addChart(
    ExcelScript.ChartType.xyscatterLinesNoMarkers,
    dataRange
  );
  chart.setPosition("D1");
  chart.getTitle().setText("Travel Distance Over Time");

  chart.getLegend().setVisible(false);
}
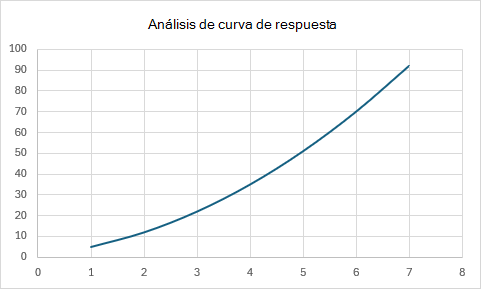
Gráfico de dispersión con líneas lisas (sin marcadores)
En este ejemplo se crea un gráfico de dispersión con líneas de conexión suaves, pero sin marcadores de punto de datos.
function main(workbook: ExcelScript.Workbook) {
  const sheet = workbook.getActiveWorksheet();

  // Add sample data.
  const data = [
    ["Input", "Output"],
    [1, 5],
    [2, 12],
    [3, 22],
    [4, 35],
    [5, 51],
    [6, 70],
    [7, 92]
  ];
  const dataRange = sheet.getRange("A1:B8");
  dataRange.setValues(data);

  // Create scatter chart with smooth lines but no markers.
  const chart = sheet.addChart(
    ExcelScript.ChartType.xyscatterSmoothNoMarkers,
    dataRange
  );
  chart.setPosition("D1");
  chart.getTitle().setText("Response Curve Analysis");

  chart.getLegend().setVisible(false);
}
Gráficos de burbujas
Los gráficos de burbujas muestran tres dimensiones de datos: posición X e Y más tamaño de burbuja.
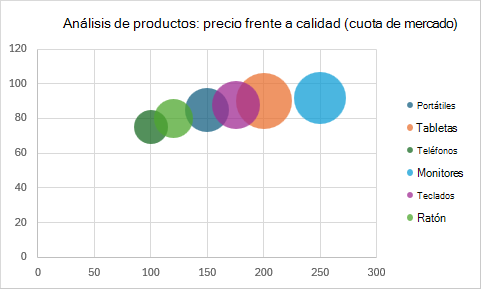
Gráfico de burbujas
function main(workbook: ExcelScript.Workbook) {
  const sheet = workbook.getActiveWorksheet();

  // Add sample data for bubble chart.
  // Each product is a separate data series with X, Y, and Size values.
  const data = [
    ["Product", "Price ($)", "Quality Score", "Market Share"],
    ["Laptops", 150, 85, 25],
    ["Tablets", 200, 90, 40],
    ["Phones", 100, 75, 15],
    ["Monitors", 250, 92, 35],
    ["Keyboards", 175, 88, 30],
    ["Mice", 120, 80, 20]
  ];
  const dataRange = sheet.getRange("A1:D7");
  dataRange.setValues(data);

  // Create bubble chart - manually add each series.
  const chart = sheet.addChart(
    ExcelScript.ChartType.bubble,
    sheet.getRange("B1:D1") // Start with just headers to create empty chart.
  );
  chart.setPosition("A9");
  chart.getTitle().setText("Product Analysis: Price vs Quality (Market Share)");

  // Remove any default series that were created.
  while (chart.getSeries().length > 0) {
    chart.getSeries()[0].delete();
  }

  // Add each product as its own series.
  for (let i = 2; i <= 7; i++) {
    const productName = sheet.getRange(`A${ i } `).getValue() as string;
    const newSeries = chart.addChartSeries();

    newSeries.setName(productName);
    newSeries.setXAxisValues(sheet.getRange(`B${ i }:B${ i } `));
    newSeries.setValues(sheet.getRange(`C${ i }:C${ i } `));
    newSeries.setBubbleSizes(sheet.getRange(`D${ i }:D${ i } `));
  }

  chart.getLegend().setPosition(ExcelScript.ChartLegendPosition.right);
}
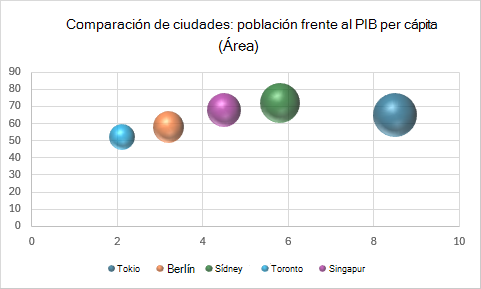
Gráfico de burbujas 3D
function main(workbook: ExcelScript.Workbook) {
  const sheet = workbook.getActiveWorksheet();

  // Add sample data for 3D bubble chart.
  // Each city is a separate data series with X, Y, and Size values.
  const data = [
    ["City", "Population (millions)", "GDP per Capita ($k)", "Area (km²)"],
    ["Tokyo", 8.5, 65, 300],
    ["Berlin", 3.2, 58, 150],
    ["Sydney", 5.8, 72, 250],
    ["Toronto", 2.1, 52, 100],
    ["Singapore", 4.5, 68, 180]
  ];
  const dataRange = sheet.getRange("A1:D6");
  dataRange.setValues(data);

  // Create 3D bubble chart - manually add each series.
  const chart = sheet.addChart(
    ExcelScript.ChartType.bubble3DEffect,
    sheet.getRange("B1:D1") // Start with just headers to create empty chart.
  );
  chart.setPosition("A8");
  chart.getTitle().setText("City Comparison: Population vs GDP per Capita (Area)");

  // Remove any default series that were created.
  while (chart.getSeries().length > 0) {
    chart.getSeries()[0].delete();
  }

  // Add each city as its own series.
  for (let i = 2; i <= 6; i++) {
    const cityName = sheet.getRange(`A${ i } `).getValue() as string;
    const newSeries = chart.addChartSeries();

    newSeries.setName(cityName);
    newSeries.setXAxisValues(sheet.getRange(`B${ i }:B${ i } `));
    newSeries.setValues(sheet.getRange(`C${ i }:C${ i } `));
    newSeries.setBubbleSizes(sheet.getRange(`D${ i }:D${ i } `));
  }

  chart.getLegend().setPosition(ExcelScript.ChartLegendPosition.bottom);
}
Gráfico de cotizaciones
Los gráficos bursátiles muestran datos financieros con valores altos, bajos y cerrados. También pueden incluir valores abiertos y de volumen.
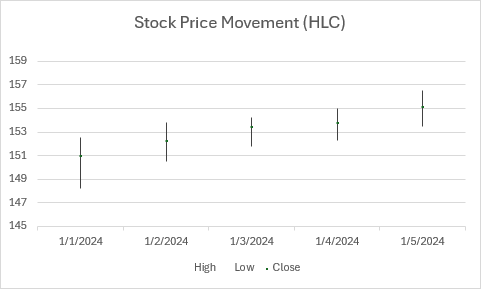
Gráfico de HLC stock
En este ejemplo se crea un gráfico de cotizaciones High-Low-Close.
function main(workbook: ExcelScript.Workbook) {
  const sheet = workbook.getActiveWorksheet();

  // Add sample data (Date, High, Low, Close).
  const data = [
    ["Date", "High", "Low", "Close"],
    ["1/1/2024", 152.50, 148.20, 151.00],
    ["1/2/2024", 153.80, 150.50, 152.30],
    ["1/3/2024", 154.20, 151.80, 153.50],
    ["1/4/2024", 155.00, 152.30, 153.80],
    ["1/5/2024", 156.50, 153.50, 155.20]
  ];
  const dataRange = sheet.getRange("A1:D6");
  dataRange.setValues(data);

  // Create HLC stock chart.
  const chart = sheet.addChart(
    ExcelScript.ChartType.stockHLC,
    dataRange
  );
  chart.setPosition("A8");
  chart.getTitle().setText("Stock Price Movement (HLC)");

  // Customize stock chart.
  chart.getAxes().getValueAxis().setMinimum(145);
  chart.getAxes().getValueAxis().setMaximum(160);
}
Gráfico de acciones de OHLC
En este ejemplo se crea un gráfico de acciones Open-High-Low-Close.

function main(workbook: ExcelScript.Workbook) {
  const sheet = workbook.getActiveWorksheet();

  // Add sample data (Date, Open, High, Low, Close).
  const data = [
    ["Date", "Open", "High", "Low", "Close"],
    ["1/1/2024", 150.00, 152.50, 148.20, 151.00],
    ["1/2/2024", 151.00, 153.80, 150.50, 152.30],
    ["1/3/2024", 152.30, 154.20, 151.80, 153.50],
    ["1/4/2024", 153.50, 155.00, 152.30, 153.80],
    ["1/5/2024", 153.80, 156.50, 153.50, 155.20]
  ];
  const dataRange = sheet.getRange("A1:E6");
  dataRange.setValues(data);

  // Create OHLC stock chart.
  const chart = sheet.addChart(
    ExcelScript.ChartType.stockOHLC,
    dataRange
  );
  chart.setPosition("A8");
  chart.getTitle().setText("Stock Price Movement (OHLC)");

  chart.getAxes().getValueAxis().setMinimum(145);
  chart.getAxes().getValueAxis().setMaximum(160);
}
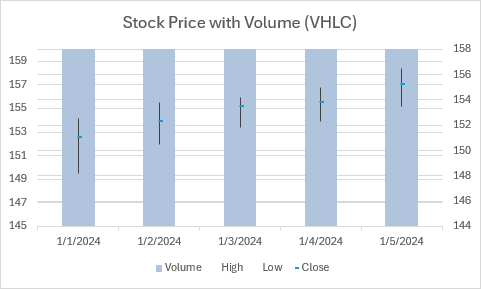
Gráfico de VHLC stock
En este ejemplo se crea un gráfico de cotizaciones Volumen-Alto-Bajo-Cierre.
function main(workbook: ExcelScript.Workbook) {
  const sheet = workbook.getActiveWorksheet();

  // Add sample data (Date, Volume, High, Low, Close).
  const data = [
    ["Date", "Volume", "High", "Low", "Close"],
    ["1/1/2024", 2500000, 152.50, 148.20, 151.00],
    ["1/2/2024", 3200000, 153.80, 150.50, 152.30],
    ["1/3/2024", 2800000, 154.20, 151.80, 153.50],
    ["1/4/2024", 3500000, 155.00, 152.30, 153.80],
    ["1/5/2024", 4100000, 156.50, 153.50, 155.20]
  ];
  const dataRange = sheet.getRange("A1:E6");
  dataRange.setValues(data);

  // Create VHLC stock chart.
  const chart = sheet.addChart(
    ExcelScript.ChartType.stockVHLC,
    dataRange
  );
  chart.setPosition("A8");
  chart.getTitle().setText("Stock Price with Volume (VHLC)");

  // Customize to improve visibility of stock lines against volume bars.
  chart.getAxes().getValueAxis().setMinimum(145);
  chart.getAxes().getValueAxis().setMaximum(160);

  // Make the volume bars more transparent or lighter colored.
  const volumeSeries = chart.getSeries()[0];
  volumeSeries.getFormat().getFill().setSolidColor("#B0C4DE"); // Light steel blue.
}
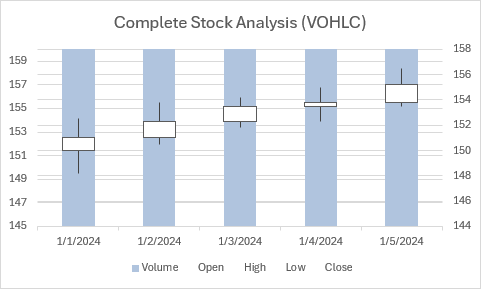
Gráfico de VOHLC stock
En este ejemplo se crea un gráfico de acciones Volume-Open-High-Low-Close.
function main(workbook: ExcelScript.Workbook) {
  const sheet = workbook.getActiveWorksheet();

  // Add sample data (Date, Volume, Open, High, Low, Close).
  const data = [
    ["Date", "Volume", "Open", "High", "Low", "Close"],
    ["1/1/2024", 2500000, 150.00, 152.50, 148.20, 151.00],
    ["1/2/2024", 3200000, 151.00, 153.80, 150.50, 152.30],
    ["1/3/2024", 2800000, 152.30, 154.20, 151.80, 153.50],
    ["1/4/2024", 3500000, 153.50, 155.00, 152.30, 153.80],
    ["1/5/2024", 4100000, 153.80, 156.50, 153.50, 155.20]
  ];
  const dataRange = sheet.getRange("A1:F6");
  dataRange.setValues(data);

  // Create VOHLC stock chart.
  const chart = sheet.addChart(
    ExcelScript.ChartType.stockVOHLC,
    dataRange
  );
  chart.setPosition("A8");
  chart.getTitle().setText("Complete Stock Analysis (VOHLC)");

  // Customize to improve visibility of stock lines against volume bars.
  chart.getAxes().getValueAxis().setMinimum(145);
  chart.getAxes().getValueAxis().setMaximum(160);

  // Make the volume bars more transparent or lighter colored.
  const volumeSeries = chart.getSeries()[0];
  volumeSeries.getFormat().getFill().setSolidColor("#B0C4DE"); // Light steel blue.
}
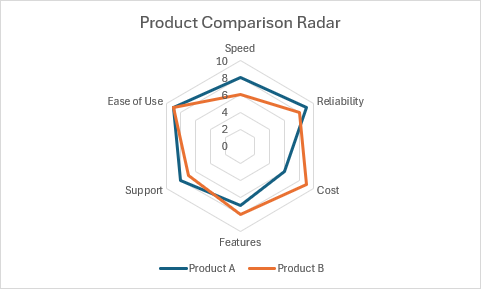
Gráficos de radar
Los gráficos de radar muestran datos multivariante en ejes que comienzan desde el mismo punto. Son útiles para comparar varias variables.
Gráfico de radar
function main(workbook: ExcelScript.Workbook) {
  const sheet = workbook.getActiveWorksheet();

  // Add sample data.
  const data = [
    ["Attribute", "Product A", "Product B"],
    ["Speed", 8, 6],
    ["Reliability", 9, 8],
    ["Cost", 6, 9],
    ["Features", 7, 8],
    ["Support", 8, 7],
    ["Ease of Use", 9, 9]
  ];
  const dataRange = sheet.getRange("A1:C7");
  dataRange.setValues(data);

  // Create radar chart.
  const chart = sheet.addChart(
    ExcelScript.ChartType.radar,
    dataRange
  );
  chart.setPosition("D1");
  chart.getTitle().setText("Product Comparison Radar");

  chart.getLegend().setPosition(ExcelScript.ChartLegendPosition.bottom);
}
Radar con gráfico de marcadores

function main(workbook: ExcelScript.Workbook) {
  const sheet = workbook.getActiveWorksheet();

  // Add sample data.
  const data = [
    ["Skill", "Danaite Alemseged", "Fazekas Peter", "Jeffry Goh"],
    ["JavaScript", 9, 7, 8],
    ["Python", 7, 9, 6],
    ["SQL", 8, 8, 9],
    ["Cloud", 8, 6, 7],
    ["DevOps", 6, 8, 9]
  ];
  const dataRange = sheet.getRange("A1:D6");
  dataRange.setValues(data);

  // Create radar chart with markers.
  const chart = sheet.addChart(
    ExcelScript.ChartType.radarMarkers,
    dataRange
  );
  chart.setPosition("A8");
  chart.getTitle().setText("Developer Skill Assessment");

  chart.getLegend().setPosition(ExcelScript.ChartLegendPosition.right);
}
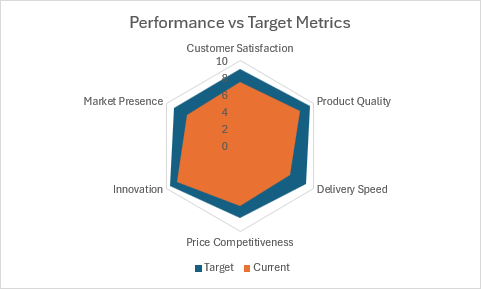
Gráfico de radar rellenado
function main(workbook: ExcelScript.Workbook) {
  const sheet = workbook.getActiveWorksheet();

  // Add sample data - Target first, then Current so Current is drawn on top.
  const data = [
    ["Category", "Target", "Current"],
    ["Customer Satisfaction", 9.0, 7.5],
    ["Product Quality", 9.5, 8.2],
    ["Delivery Speed", 9.0, 6.8],
    ["Price Competitiveness", 8.5, 7.0],
    ["Innovation", 9.5, 8.5],
    ["Market Presence", 9.0, 7.2]
  ];
  const dataRange = sheet.getRange("A1:C7");
  dataRange.setValues(data);

  // Create filled radar chart.
  const chart = sheet.addChart(
    ExcelScript.ChartType.radarFilled,
    dataRange
  );
  chart.setPosition("D1");
  chart.getTitle().setText("Performance vs Target Metrics");

  chart.getLegend().setPosition(ExcelScript.ChartLegendPosition.bottom);
}
Gráficos de gráficos de rectángulos
Los gráficos de gráficos de rectángulos muestran datos jerárquicos como rectángulos anidados, con un tamaño que representa valores.

function main(workbook: ExcelScript.Workbook) {
  const sheet = workbook.getActiveWorksheet();

  // Add sample data.
  const data = [
    ["Category", "Subcategory", "Value"],
    ["Electronics", "Phones", 45000],
    ["Electronics", "Laptops", 38000],
    ["Electronics", "Tablets", 22000],
    ["Furniture", "Desks", 18000],
    ["Furniture", "Chairs", 25000],
    ["Furniture", "Storage", 12000],
    ["Clothing", "Shirts", 15000],
    ["Clothing", "Pants", 18000],
    ["Clothing", "Accessories", 8000]
  ];
  const dataRange = sheet.getRange("A1:C10");
  dataRange.setValues(data);

  // Create treemap chart.
  const chart = sheet.addChart(
    ExcelScript.ChartType.treemap,
    dataRange
  );
  chart.setPosition("D1");
  chart.getTitle().setText("Sales by Category (Treemap)");

  // Treemap-specific customization.
  chart.getLegend().setVisible(false);
}
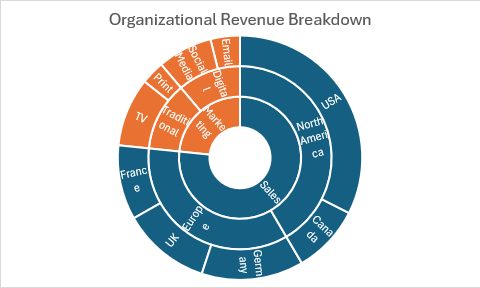
Gráficos de ráfaga solar
Los gráficos de ráfaga solar muestran datos jerárquicos en círculos concéntricos, con cada nivel representado por un anillo.
function main(workbook: ExcelScript.Workbook) {
  const sheet = workbook.getActiveWorksheet();

  // Add sample data.
  const data = [
    ["Level 1", "Level 2", "Level 3", "Value"],
    ["Sales", "North America", "USA", 125000],
    ["Sales", "North America", "Canada", 35000],
    ["Sales", "Europe", "UK", 45000],
    ["Sales", "Europe", "Germany", 52000],
    ["Sales", "Europe", "France", 38000],
    ["Marketing", "Digital", "Social Media", 28000],
    ["Marketing", "Digital", "Email", 15000],
    ["Marketing", "Traditional", "Print", 12000],
    ["Marketing", "Traditional", "TV", 35000]
  ];
  const dataRange = sheet.getRange("A1:D10");
  dataRange.setValues(data);

  // Create sunburst chart.
  const chart = sheet.addChart(
    ExcelScript.ChartType.sunburst,
    dataRange
  );
  chart.setPosition("E1");
  chart.getTitle().setText("Organizational Revenue Breakdown");

  chart.getLegend().setVisible(false);
}
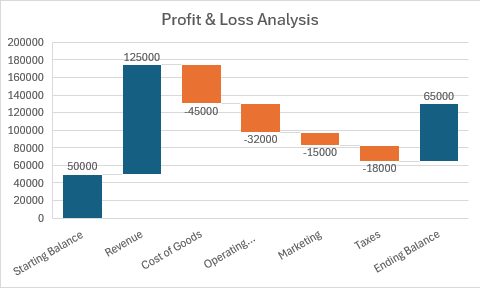
Gráficos en cascada
Los gráficos en cascada muestran cómo un valor inicial se ve afectado por valores positivos y negativos, mostrando el efecto acumulativo.
function main(workbook: ExcelScript.Workbook) {
  const sheet = workbook.getActiveWorksheet();

  // Add sample data.
  const data = [
    ["Category", "Amount"],
    ["Starting Balance", 50000],
    ["Revenue", 125000],
    ["Cost of Goods", -45000],
    ["Operating Expenses", -32000],
    ["Marketing", -15000],
    ["Taxes", -18000],
    ["Ending Balance", 65000]
  ];
  const dataRange = sheet.getRange("A1:B8");
  dataRange.setValues(data);

  // Create waterfall chart.
  const chart = sheet.addChart(
    ExcelScript.ChartType.waterfall,
    dataRange
  );
  chart.setPosition("D1");
  chart.getTitle().setText("Profit & Loss Analysis");

  // Waterfall charts automatically handle the flow visualization.
  chart.getLegend().setVisible(false);
}
Gráficos de embudo
Los gráficos de embudo muestran una reducción progresiva de los datos a través de fases. Úselas para el análisis de ventas y conversión.
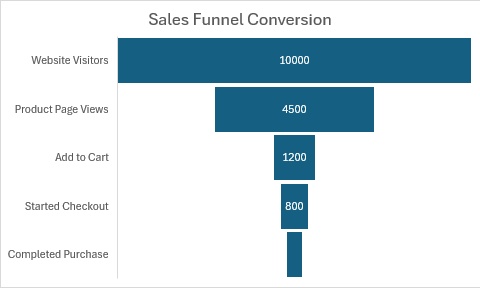
function main(workbook: ExcelScript.Workbook) {
  const sheet = workbook.getActiveWorksheet();

  // Add sample data.
  const data = [
    ["Stage", "Count"],
    ["Website Visitors", 10000],
    ["Product Page Views", 4500],
    ["Add to Cart", 1200],
    ["Started Checkout", 800],
    ["Completed Purchase", 450]
  ];
  const dataRange = sheet.getRange("A1:B6");
  dataRange.setValues(data);

  // Create funnel chart.
  const chart = sheet.addChart(
    ExcelScript.ChartType.funnel,
    dataRange
  );
  chart.setPosition("D1");
  chart.getTitle().setText("Sales Funnel Conversion");
}
Gráficos de cuadros y whisker
Los gráficos box y whisker muestran la distribución de datos a través de cuartiles. Resaltan la mediana y los valores atípicos.
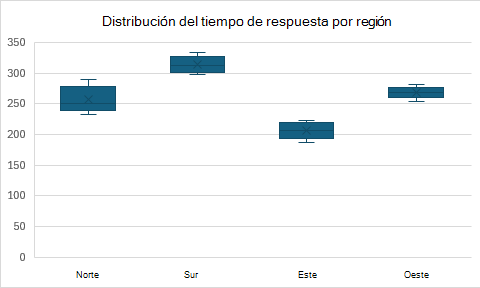
function main(workbook: ExcelScript.Workbook) {
  const sheet = workbook.getActiveWorksheet();

  // Add sample data (multiple observations per category).
  const data = [
    ["Region", "Response Time (ms)"],
    ["North", 245],
    ["North", 268],
    ["North", 232],
    ["North", 289],
    ["North", 251],
    ["South", 312],
    ["South", 298],
    ["South", 334],
    ["South", 305],
    ["South", 321],
    ["East", 198],
    ["East", 215],
    ["East", 187],
    ["East", 223],
    ["East", 206],
    ["West", 267],
    ["West", 281],
    ["West", 254],
    ["West", 273],
    ["West", 269]
  ];
  const dataRange = sheet.getRange("A1:B21");
  dataRange.setValues(data);

  // Create box and whisker chart.
  const chart = sheet.addChart(
    ExcelScript.ChartType.boxwhisker,
    dataRange
  );
  chart.setPosition("D1");
  chart.getTitle().setText("Response Time Distribution by Region");

  chart.getLegend().setVisible(false);
}
Gráficos de histogramas
Los gráficos de histogramas muestran la distribución de datos numéricos agrupando valores en contenedores.
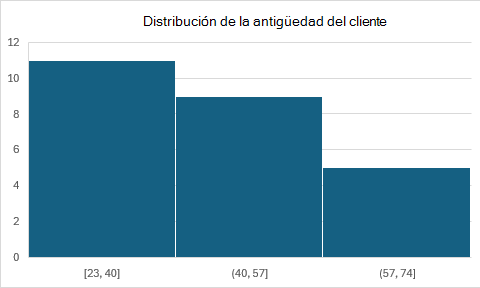
function main(workbook: ExcelScript.Workbook) {
  const sheet = workbook.getActiveWorksheet();

  // Add sample data (customer ages).
  const data = [
    ["Customer", "Age"],
    ["Customer 1", 23],
    ["Customer 2", 45],
    ["Customer 3", 31],
    ["Customer 4", 52],
    ["Customer 5", 28],
    ["Customer 6", 67],
    ["Customer 7", 38],
    ["Customer 8", 41],
    ["Customer 9", 29],
    ["Customer 10", 55],
    ["Customer 11", 33],
    ["Customer 12", 48],
    ["Customer 13", 26],
    ["Customer 14", 62],
    ["Customer 15", 35],
    ["Customer 16", 44],
    ["Customer 17", 58],
    ["Customer 18", 37],
    ["Customer 19", 49],
    ["Customer 20", 71],
    ["Customer 21", 24],
    ["Customer 22", 39],
    ["Customer 23", 56],
    ["Customer 24", 42],
    ["Customer 25", 64]
  ];
  const dataRange = sheet.getRange("A1:B26");
  dataRange.setValues(data);

  // Create histogram chart.
  const chart = sheet.addChart(
    ExcelScript.ChartType.histogram,
    dataRange
  );
  chart.setPosition("D1");
  chart.getTitle().setText("Customer Age Distribution");
  chart.getLegend().setVisible(false);
}
Gráficos de Pareto
Los gráficos de Pareto combinan gráficos de columnas y líneas para mostrar valores individuales y totales acumulados. Siguen el principio 80/20.

function main(workbook: ExcelScript.Workbook) {
  const sheet = workbook.getActiveWorksheet();

  // Add sample data.
  const data = [
    ["Defect Type", "Frequency"],
    ["Packaging", 45],
    ["Assembly", 32],
    ["Quality Control", 28],
    ["Material", 18],
    ["Design", 12],
    ["Shipping", 8],
    ["Documentation", 5],
    ["Other", 3]
  ];
  const dataRange = sheet.getRange("A1:B9");
  dataRange.setValues(data);

  // Create pareto chart.
  const chart = sheet.addChart(
    ExcelScript.ChartType.pareto,
    dataRange
  );
  chart.setPosition("D1");
  chart.getTitle().setText("Defect Analysis (Pareto)");

  chart.getLegend().setPosition(ExcelScript.ChartLegendPosition.bottom);
}
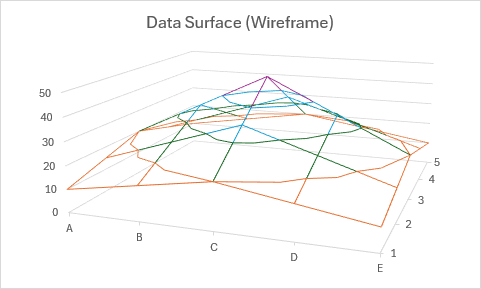
Gráficos de superficie
Los gráficos de superficies muestran tendencias en valores en dos dimensiones en una curva continua. Son útiles para encontrar combinaciones óptimas.
Gráfico de superficie

function main(workbook: ExcelScript.Workbook) {
  const sheet = workbook.getActiveWorksheet();

  // Add sample data (temperature at different coordinates).
  const data = [
    ["", "0", "5", "10", "15", "20"],
    ["0", 20, 22, 25, 28, 30],
    ["5", 22, 24, 27, 30, 32],
    ["10", 25, 27, 30, 33, 35],
    ["15", 28, 30, 33, 36, 38],
    ["20", 30, 32, 35, 38, 40]
  ];
  const dataRange = sheet.getRange("A1:F6");
  dataRange.setValues(data);

  // Create surface chart.
  const chart = sheet.addChart(
    ExcelScript.ChartType.surface,
    dataRange
  );
  chart.setPosition("A8");
  chart.getTitle().setText("Temperature Distribution (3D Surface)");

  chart.getLegend().setPosition(ExcelScript.ChartLegendPosition.right);
}
Gráfico de trama alámbrica de superficie
function main(workbook: ExcelScript.Workbook) {
  const sheet = workbook.getActiveWorksheet();

  // Add sample data.
  const data = [
    ["", "A", "B", "C", "D", "E"],
    ["1", 10, 15, 20, 15, 10],
    ["2", 15, 25, 35, 25, 15],
    ["3", 20, 35, 50, 35, 20],
    ["4", 15, 25, 35, 25, 15],
    ["5", 10, 15, 20, 15, 10]
  ];
  const dataRange = sheet.getRange("A1:F6");
  dataRange.setValues(data);

  // Create surface wireframe chart.
  const chart = sheet.addChart(
    ExcelScript.ChartType.surfaceWireframe,
    dataRange
  );
  chart.setPosition("A8");
  chart.getTitle().setText("Data Surface (Wireframe)");

  chart.getLegend().setVisible(false);
}
Gráfico de contorno (vista superior de la superficie)
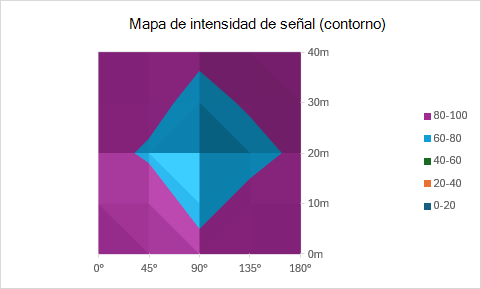
function main(workbook: ExcelScript.Workbook) {
  const sheet = workbook.getActiveWorksheet();

  // Add sample data.
  const data = [
    ["", "0°", "45°", "90°", "135°", "180°"],
    ["0m", 100, 95, 85, 92, 98],
    ["10m", 95, 88, 75, 85, 93],
    ["20m", 85, 78, 62, 75, 83],
    ["30m", 92, 85, 75, 82, 90],
    ["40m", 98, 93, 83, 90, 96]
  ];
  const dataRange = sheet.getRange("A1:F6");
  dataRange.setValues(data);

  // Create contour (top view) chart.
  const chart = sheet.addChart(
    ExcelScript.ChartType.surfaceTopView,
    dataRange
  );
  chart.setPosition("A8");
  chart.getTitle().setText("Signal Strength Map (Contour)");

  chart.getLegend().setPosition(ExcelScript.ChartLegendPosition.right);
}
Trama alámbrica del gráfico de contornos (trama alámbrica de la vista superior de la superficie)
En este ejemplo se crea una versión de estructura alámbrica de un gráfico de contorno.
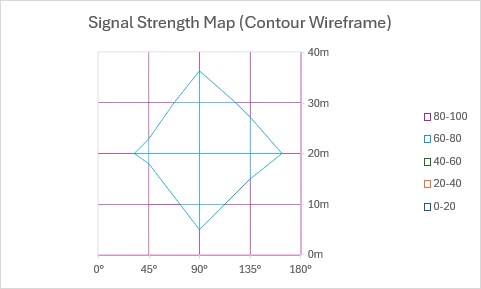
function main(workbook: ExcelScript.Workbook) {
  const sheet = workbook.getActiveWorksheet();

  // Add sample data.
  const data = [
    ["", "0°", "45°", "90°", "135°", "180°"],
    ["0m", 100, 95, 85, 92, 98],
    ["10m", 95, 88, 75, 85, 93],
    ["20m", 85, 78, 62, 75, 83],
    ["30m", 92, 85, 75, 82, 90],
    ["40m", 98, 93, 83, 90, 96]
  ];
  const dataRange = sheet.getRange("A1:F6");
  dataRange.setValues(data);

  // Create contour wireframe chart.
  const chart = sheet.addChart(
    ExcelScript.ChartType.surfaceTopViewWireframe,
    dataRange
  );
  chart.setPosition("A8");
  chart.getTitle().setText("Signal Strength Map (Contour Wireframe)");

  chart.getLegend().setPosition(ExcelScript.ChartLegendPosition.right);
}
Gráficos de mapa de regiones
Los gráficos de mapa de regiones, también denominados gráficos de mapas rellenos, muestran valores entre regiones geográficas.

function main(workbook: ExcelScript.Workbook) {
  const sheet = workbook.getActiveWorksheet();

  // Add sample data (state names and values).
  const data = [
    ["State", "Sales"],
    ["California", 450000],
    ["Texas", 380000],
    ["Florida", 320000],
    ["New York", 410000],
    ["Illinois", 280000],
    ["Pennsylvania", 240000],
    ["Ohio", 220000],
    ["Georgia", 195000],
    ["North Carolina", 185000],
    ["Michigan", 175000]
  ];
  const dataRange = sheet.getRange("A1:B11");
  dataRange.setValues(data);

  // Create region map chart.
  const chart = sheet.addChart(
    ExcelScript.ChartType.regionMap,
    dataRange
  );
  chart.setPosition("D1");
  chart.getTitle().setText("Sales by State");

  chart.getLegend().setPosition(ExcelScript.ChartLegendPosition.right);
}
Gráficos combinados (combinación de barras y circulares)
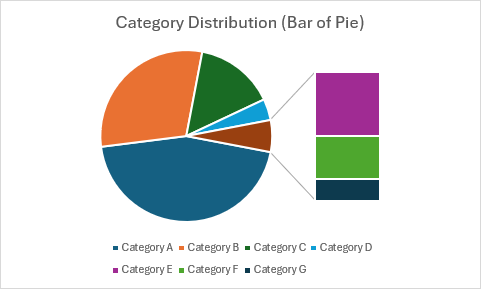
Barra de gráfico circular
La barra de gráficos circulares divide los segmentos más pequeños de un gráfico circular en una barra independiente para mejorar la visibilidad.
function main(workbook: ExcelScript.Workbook) {
  const sheet = workbook.getActiveWorksheet();

  // Add sample data.
  const data = [
    ["Category", "Amount"],
    ["Category A", 45],
    ["Category B", 30],
    ["Category C", 15],
    ["Category D", 4],
    ["Category E", 3],
    ["Category F", 2],
    ["Category G", 1]
  ];
  const dataRange = sheet.getRange("A1:B8");
  dataRange.setValues(data);

  // Create bar of pie chart.
  const chart = sheet.addChart(
    ExcelScript.ChartType.barOfPie,
    dataRange
  );
  chart.setPosition("D1");
  chart.getTitle().setText("Category Distribution (Bar of Pie)");

  chart.getLegend().setPosition(ExcelScript.ChartLegendPosition.bottom);
}
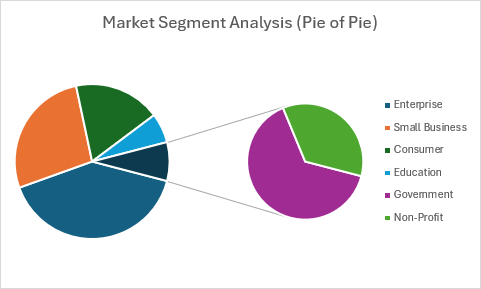
Gráfico circular de gráfico circular
Los gráficos circulares circulares muestran un gráfico circular secundario que muestra detalles de segmentos más pequeños.
function main(workbook: ExcelScript.Workbook) {
  const sheet = workbook.getActiveWorksheet();

  // Add sample data.
  const data = [
    ["Segment", "Value"],
    ["Enterprise", 425000],
    ["Small Business", 285000],
    ["Consumer", 190000],
    ["Education", 65000],
    ["Government", 55000],
    ["Non-Profit", 30000]
  ];
  const dataRange = sheet.getRange("A1:B7");
  dataRange.setValues(data);

  // Create pie of pie chart.
  const chart = sheet.addChart(
    ExcelScript.ChartType.pieOfPie,
    dataRange
  );
  chart.setPosition("D1");
  chart.getTitle().setText("Market Segment Analysis (Pie of Pie)");

  chart.getLegend().setPosition(ExcelScript.ChartLegendPosition.right);
}
Variaciones del gráfico 3D
Estos tipos de gráfico muestran datos con efectos visuales tridimensionales mediante formas de cono, cilindro y pirámide.
Gráficos de columnas de cono
Gráfico de columnas de cono
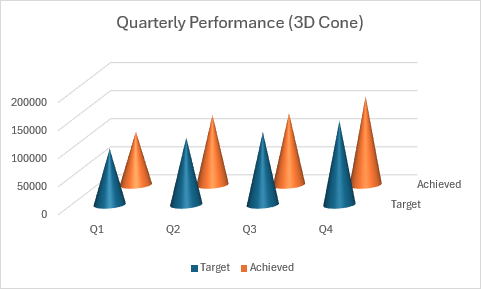
function main(workbook: ExcelScript.Workbook) {
  const sheet = workbook.getActiveWorksheet();

  // Add sample data.
  const data = [
    ["Quarter", "Target", "Achieved"],
    ["Q1", 100000, 95000],
    ["Q2", 120000, 125000],
    ["Q3", 130000, 128000],
    ["Q4", 150000, 158000]
  ];
  const dataRange = sheet.getRange("A1:C5");
  dataRange.setValues(data);

  // Create cone column chart.
  const chart = sheet.addChart(
    ExcelScript.ChartType.coneCol,
    dataRange
  );
  chart.setPosition("D1");
  chart.getTitle().setText("Quarterly Performance (3D Cone)");

  chart.getLegend().setPosition(ExcelScript.ChartLegendPosition.bottom);
}
Gráfico de columnas de cono clúster
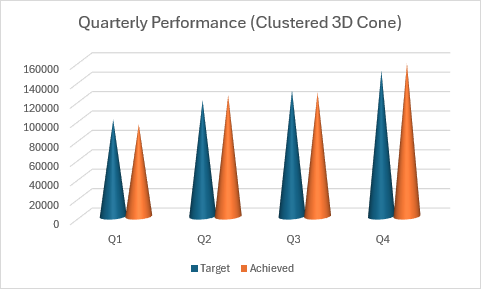
function main(workbook: ExcelScript.Workbook) {
  const sheet = workbook.getActiveWorksheet();

  // Add sample data.
  const data = [
    ["Quarter", "Target", "Achieved"],
    ["Q1", 100000, 95000],
    ["Q2", 120000, 125000],
    ["Q3", 130000, 128000],
    ["Q4", 150000, 158000]
  ];
  const dataRange = sheet.getRange("A1:C5");
  dataRange.setValues(data);

  // Create clustered cone column chart.
  const chart = sheet.addChart(
    ExcelScript.ChartType.coneColClustered,
    dataRange
  );
  chart.setPosition("D1");
  chart.getTitle().setText("Quarterly Performance (Clustered 3D Cone)");

  chart.getLegend().setPosition(ExcelScript.ChartLegendPosition.bottom);
}
Gráfico de columnas de cono apilado
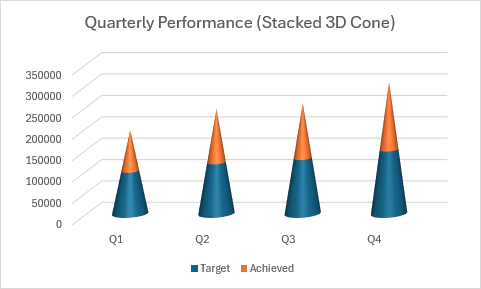
function main(workbook: ExcelScript.Workbook) {
  const sheet = workbook.getActiveWorksheet();

  // Add sample data.
  const data = [
    ["Quarter", "Target", "Achieved"],
    ["Q1", 100000, 95000],
    ["Q2", 120000, 125000],
    ["Q3", 130000, 128000],
    ["Q4", 150000, 158000]
  ];
  const dataRange = sheet.getRange("A1:C5");
  dataRange.setValues(data);

  // Create stacked cone column chart.
  const chart = sheet.addChart(
    ExcelScript.ChartType.coneColStacked,
    dataRange
  );
  chart.setPosition("D1");
  chart.getTitle().setText("Quarterly Performance (Stacked 3D Cone)");

  chart.getLegend().setPosition(ExcelScript.ChartLegendPosition.bottom);
}
Gráfico de columnas de cono 100% apiladas
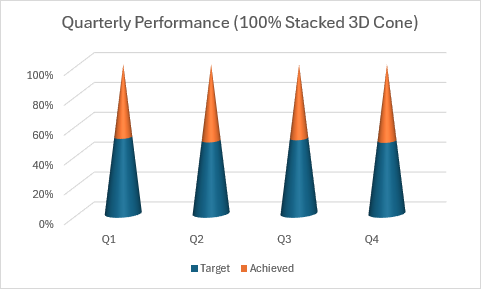
function main(workbook: ExcelScript.Workbook) {
  const sheet = workbook.getActiveWorksheet();

  // Add sample data.
  const data = [
    ["Quarter", "Target", "Achieved"],
    ["Q1", 100000, 95000],
    ["Q2", 120000, 125000],
    ["Q3", 130000, 128000],
    ["Q4", 150000, 158000]
  ];
  const dataRange = sheet.getRange("A1:C5");
  dataRange.setValues(data);

  // Create 100% stacked cone column chart.
  const chart = sheet.addChart(
    ExcelScript.ChartType.coneColStacked100,
    dataRange
  );
  chart.setPosition("D1");
  chart.getTitle().setText("Quarterly Performance (100% Stacked 3D Cone)");

  chart.getLegend().setPosition(ExcelScript.ChartLegendPosition.bottom);
}
Gráficos de columnas de cilindro
Gráfico de columnas de cilindro
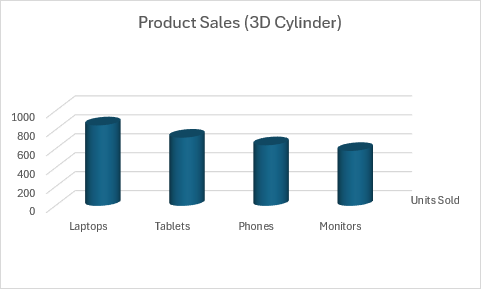
function main(workbook: ExcelScript.Workbook) {
  const sheet = workbook.getActiveWorksheet();

  // Add sample data.
  const data = [
    ["Product", "Units Sold"],
    ["Laptops", 850],
    ["Tablets", 720],
    ["Phones", 640],
    ["Monitors", 580]
  ];
  const dataRange = sheet.getRange("A1:B5");
  dataRange.setValues(data);

  // Create cylinder column chart.
  const chart = sheet.addChart(
    ExcelScript.ChartType.cylinderCol,
    dataRange
  );
  chart.setPosition("D1");
  chart.getTitle().setText("Product Sales (3D Cylinder)");

  chart.getLegend().setVisible(false);
}
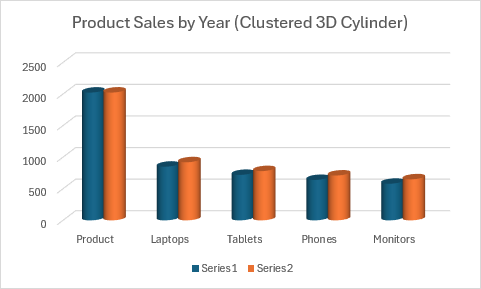
Gráfico de columnas de cilindro agrupado
function main(workbook: ExcelScript.Workbook) {
  const sheet = workbook.getActiveWorksheet();

  // Add sample data.
  const data = [
    ["Product", "2023", "2024"],
    ["Laptops", 850, 920],
    ["Tablets", 720, 780],
    ["Phones", 640, 710],
    ["Monitors", 580, 650]
  ];
  const dataRange = sheet.getRange("A1:C5");
  dataRange.setValues(data);

  // Create clustered cylinder column chart.
  const chart = sheet.addChart(
    ExcelScript.ChartType.cylinderColClustered,
    dataRange
  );
  chart.setPosition("D1");
  chart.getTitle().setText("Product Sales by Year (Clustered 3D Cylinder)");

  chart.getLegend().setPosition(ExcelScript.ChartLegendPosition.bottom);
}
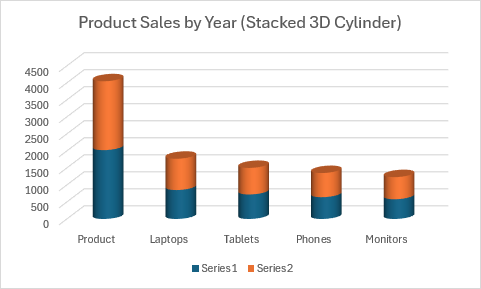
Gráfico de columnas de cilindro apilado
function main(workbook: ExcelScript.Workbook) {
  const sheet = workbook.getActiveWorksheet();

  // Add sample data.
  const data = [
    ["Product", "2023", "2024"],
    ["Laptops", 850, 920],
    ["Tablets", 720, 780],
    ["Phones", 640, 710],
    ["Monitors", 580, 650]
  ];
  const dataRange = sheet.getRange("A1:C5");
  dataRange.setValues(data);

  // Create stacked cylinder column chart.
  const chart = sheet.addChart(
    ExcelScript.ChartType.cylinderColStacked,
    dataRange
  );
  chart.setPosition("D1");
  chart.getTitle().setText("Product Sales by Year (Stacked 3D Cylinder)");

  chart.getLegend().setPosition(ExcelScript.ChartLegendPosition.bottom);
}
Gráfico de columnas de cilindro 100% apiladas

function main(workbook: ExcelScript.Workbook) {
  const sheet = workbook.getActiveWorksheet();

  // Add sample data.
  const data = [
    ["Product", "2023", "2024"],
    ["Laptops", 850, 920],
    ["Tablets", 720, 780],
    ["Phones", 640, 710],
    ["Monitors", 580, 650]
  ];
  const dataRange = sheet.getRange("A1:C5");
  dataRange.setValues(data);

  // Create 100% stacked cylinder column chart.
  const chart = sheet.addChart(
    ExcelScript.ChartType.cylinderColStacked100,
    dataRange
  );
  chart.setPosition("D1");
  chart.getTitle().setText("Product Sales by Year (100% Stacked 3D Cylinder)");

  chart.getLegend().setPosition(ExcelScript.ChartLegendPosition.bottom);
}
Gráficos de columnas de pirámide
Gráfico de columnas de pirámide
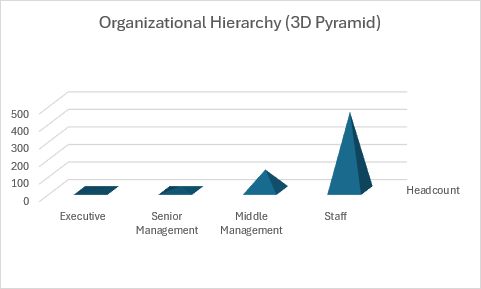
function main(workbook: ExcelScript.Workbook) {
  const sheet = workbook.getActiveWorksheet();

  // Add sample data.
  const data = [
    ["Level", "Headcount"],
    ["Executive", 5],
    ["Senior Management", 25],
    ["Middle Management", 120],
    ["Staff", 450]
  ];
  const dataRange = sheet.getRange("A1:B5");
  dataRange.setValues(data);

  // Create pyramid column chart.
  const chart = sheet.addChart(
    ExcelScript.ChartType.pyramidCol,
    dataRange
  );
  chart.setPosition("D1");
  chart.getTitle().setText("Organizational Hierarchy (3D Pyramid)");

  chart.getLegend().setVisible(false);
}
Gráfico de columnas de pirámide agrupadas
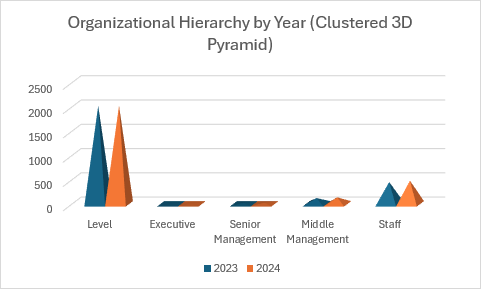
function main(workbook: ExcelScript.Workbook) {
  const sheet = workbook.getActiveWorksheet();

  // Add sample data.
  const data = [
    ["Level", "2023", "2024"],
    ["Executive", 5, 6],
    ["Senior Management", 25, 28],
    ["Middle Management", 120, 135],
    ["Staff", 450, 480]
  ];
  const dataRange = sheet.getRange("A1:C5");
  dataRange.setValues(data);

  // Create clustered pyramid column chart.
  const chart = sheet.addChart(
    ExcelScript.ChartType.pyramidColClustered,
    dataRange
  );
  chart.setPosition("D1");
  chart.getTitle().setText("Organizational Hierarchy by Year (Clustered 3D Pyramid)");

  // Label the series with year names.
  const seriesCollection = chart.getSeries();
  seriesCollection[0].setName("2023");
  seriesCollection[1].setName("2024");

  chart.getLegend().setPosition(ExcelScript.ChartLegendPosition.bottom);
}
Gráfico de columnas de pirámide apilada
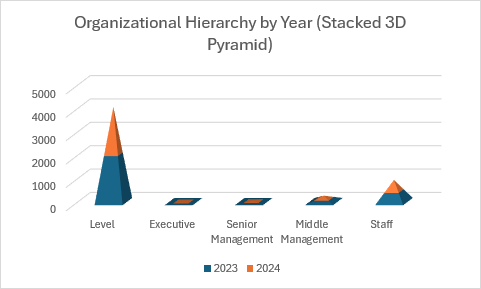
function main(workbook: ExcelScript.Workbook) {
  const sheet = workbook.getActiveWorksheet();

  // Add sample data.
  const data = [
    ["Level", "2023", "2024"],
    ["Executive", 5, 6],
    ["Senior Management", 25, 28],
    ["Middle Management", 120, 135],
    ["Staff", 450, 480]
  ];
  const dataRange = sheet.getRange("A1:C5");
  dataRange.setValues(data);

  // Create stacked pyramid column chart.
  const chart = sheet.addChart(
    ExcelScript.ChartType.pyramidColStacked,
    dataRange
  );
  chart.setPosition("D1");
  chart.getTitle().setText("Organizational Hierarchy by Year (Stacked 3D Pyramid)");

  // Label the series with year names.
  const seriesCollection = chart.getSeries();
  seriesCollection[0].setName("2023");
  seriesCollection[1].setName("2024");

  chart.getLegend().setPosition(ExcelScript.ChartLegendPosition.bottom);
}
Gráfico de columnas piramidales 100% apiladas
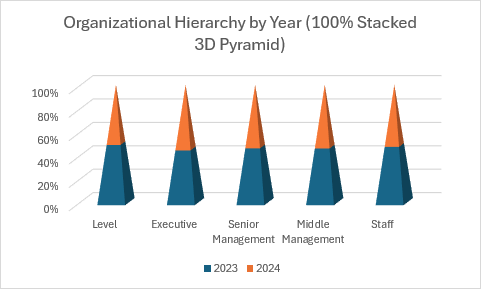
function main(workbook: ExcelScript.Workbook) {
  const sheet = workbook.getActiveWorksheet();

  // Add sample data.
  const data = [
    ["Level", "2023", "2024"],
    ["Executive", 5, 6],
    ["Senior Management", 25, 28],
    ["Middle Management", 120, 135],
    ["Staff", 450, 480]
  ];
  const dataRange = sheet.getRange("A1:C5");
  dataRange.setValues(data);

  // Create 100% stacked pyramid column chart.
  const chart = sheet.addChart(
    ExcelScript.ChartType.pyramidColStacked100,
    dataRange
  );
  chart.setPosition("D1");
  chart.getTitle().setText("Organizational Hierarchy by Year (100% Stacked 3D Pyramid)");

  // Label the series with year names.
  const seriesCollection = chart.getSeries();
  seriesCollection[0].setName("2023");
  seriesCollection[1].setName("2024");

  chart.getLegend().setPosition(ExcelScript.ChartLegendPosition.bottom);
}
Gráficos de barras de cono
Gráfico de barras de cono agrupado
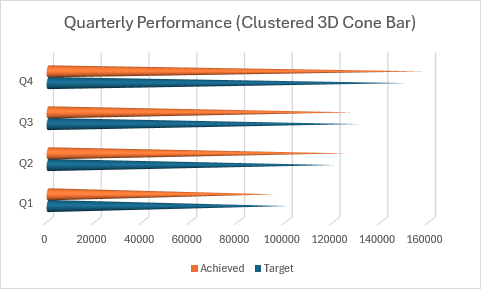
function main(workbook: ExcelScript.Workbook) {
  const sheet = workbook.getActiveWorksheet();

  // Add sample data.
  const data = [
    ["Quarter", "Target", "Achieved"],
    ["Q1", 100000, 95000],
    ["Q2", 120000, 125000],
    ["Q3", 130000, 128000],
    ["Q4", 150000, 158000]
  ];
  const dataRange = sheet.getRange("A1:C5");
  dataRange.setValues(data);

  // Create clustered cone bar chart.
  const chart = sheet.addChart(
    ExcelScript.ChartType.coneBarClustered,
    dataRange
  );
  chart.setPosition("D1");
  chart.getTitle().setText("Quarterly Performance (Clustered 3D Cone Bar)");

  chart.getLegend().setPosition(ExcelScript.ChartLegendPosition.bottom);
}
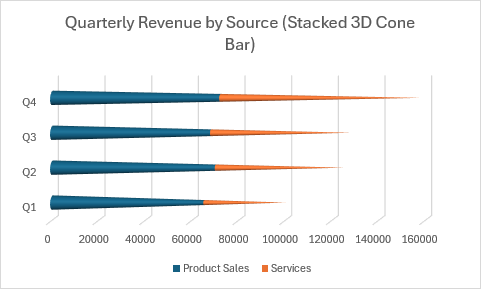
Gráfico de barras de cono apiladas
function main(workbook: ExcelScript.Workbook) {
  const sheet = workbook.getActiveWorksheet();

  // Add sample data.
  const data = [
    ["Quarter", "Product Sales", "Services"],
    ["Q1", 65000, 35000],
    ["Q2", 70000, 55000],
    ["Q3", 68000, 60000],
    ["Q4", 72000, 86000]
  ];
  const dataRange = sheet.getRange("A1:C5");
  dataRange.setValues(data);

  // Create stacked cone bar chart.
  const chart = sheet.addChart(
    ExcelScript.ChartType.coneBarStacked,
    dataRange
  );
  chart.setPosition("D1");
  chart.getTitle().setText("Quarterly Revenue by Source (Stacked 3D Cone Bar)");

  chart.getLegend().setPosition(ExcelScript.ChartLegendPosition.bottom);
}
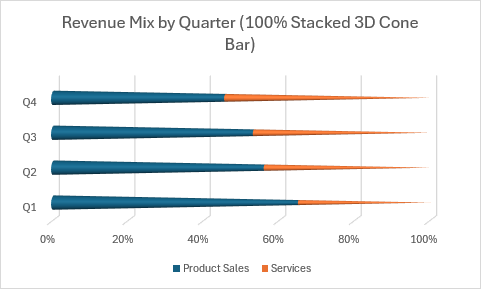
Gráfico de barras de cono 100% apiladas
function main(workbook: ExcelScript.Workbook) {
  const sheet = workbook.getActiveWorksheet();

  // Add sample data.
  const data = [
    ["Quarter", "Product Sales", "Services"],
    ["Q1", 65000, 35000],
    ["Q2", 70000, 55000],
    ["Q3", 68000, 60000],
    ["Q4", 72000, 86000]
  ];
  const dataRange = sheet.getRange("A1:C5");
  dataRange.setValues(data);

  // Create 100% stacked cone bar chart.
  const chart = sheet.addChart(
    ExcelScript.ChartType.coneBarStacked100,
    dataRange
  );
  chart.setPosition("D1");
  chart.getTitle().setText("Revenue Mix by Quarter (100% Stacked 3D Cone Bar)");

  chart.getLegend().setPosition(ExcelScript.ChartLegendPosition.bottom);
}
Gráficos de barras de cilindros
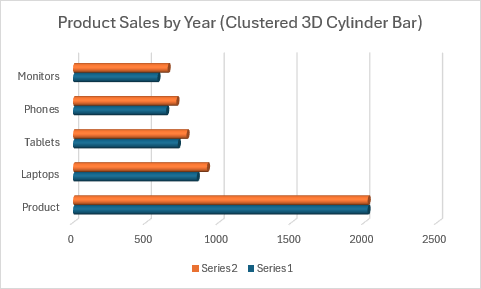
Gráfico de barras de cilindros agrupados
function main(workbook: ExcelScript.Workbook) {
  const sheet = workbook.getActiveWorksheet();

  // Add sample data.
  const data = [
    ["Product", "2023", "2024"],
    ["Laptops", 850, 920],
    ["Tablets", 720, 780],
    ["Phones", 640, 710],
    ["Monitors", 580, 650]
  ];
  const dataRange = sheet.getRange("A1:C5");
  dataRange.setValues(data);

  // Create clustered cylinder bar chart.
  const chart = sheet.addChart(
    ExcelScript.ChartType.cylinderBarClustered,
    dataRange
  );
  chart.setPosition("D1");
  chart.getTitle().setText("Product Sales by Year (Clustered 3D Cylinder Bar)");

  chart.getLegend().setPosition(ExcelScript.ChartLegendPosition.bottom);
}
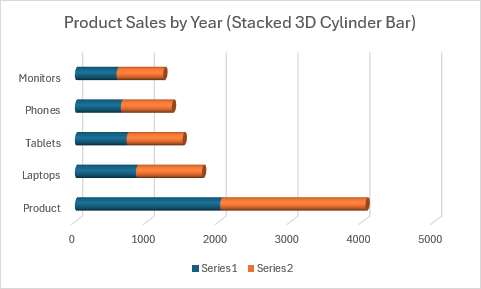
Gráfico de barras de cilindros apiladas
function main(workbook: ExcelScript.Workbook) {
  const sheet = workbook.getActiveWorksheet();

  // Add sample data.
  const data = [
    ["Product", "2023", "2024"],
    ["Laptops", 850, 920],
    ["Tablets", 720, 780],
    ["Phones", 640, 710],
    ["Monitors", 580, 650]
  ];
  const dataRange = sheet.getRange("A1:C5");
  dataRange.setValues(data);

  // Create stacked cylinder bar chart.
  const chart = sheet.addChart(
    ExcelScript.ChartType.cylinderBarStacked,
    dataRange
  );
  chart.setPosition("D1");
  chart.getTitle().setText("Product Sales by Year (Stacked 3D Cylinder Bar)");

  // Label the series with year names.
  const seriesCollection = chart.getSeries();
  seriesCollection[0].setName("2023");
  seriesCollection[1].setName("2024");

  chart.getLegend().setPosition(ExcelScript.ChartLegendPosition.bottom);
}
Gráfico de barras de cilindros 100% apiladas
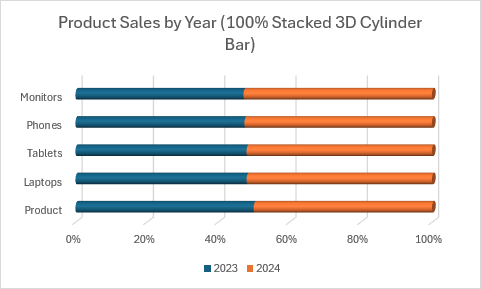
function main(workbook: ExcelScript.Workbook) {
  const sheet = workbook.getActiveWorksheet();

  // Add sample data.
  const data = [
    ["Product", "2023", "2024"],
    ["Laptops", 850, 920],
    ["Tablets", 720, 780],
    ["Phones", 640, 710],
    ["Monitors", 580, 650]
  ];
  const dataRange = sheet.getRange("A1:C5");
  dataRange.setValues(data);

  // Create 100% stacked cylinder bar chart.
  const chart = sheet.addChart(
    ExcelScript.ChartType.cylinderBarStacked100,
    dataRange
  );
  chart.setPosition("D1");
  chart.getTitle().setText("Product Sales by Year (100% Stacked 3D Cylinder Bar)");

  // Label the series with year names.
  const seriesCollection = chart.getSeries();
  seriesCollection[0].setName("2023");
  seriesCollection[1].setName("2024");

  chart.getLegend().setPosition(ExcelScript.ChartLegendPosition.bottom);
}
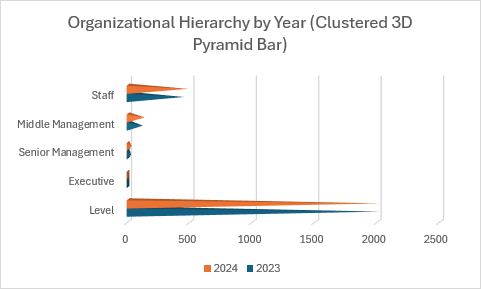
Gráficos de barras de pirámide
Gráfico de barras de pirámide agrupadas
function main(workbook: ExcelScript.Workbook) {
  const sheet = workbook.getActiveWorksheet();

  // Add sample data.
  const data = [
    ["Level", "2023", "2024"],
    ["Executive", 5, 6],
    ["Senior Management", 25, 28],
    ["Middle Management", 120, 135],
    ["Staff", 450, 480]
  ];
  const dataRange = sheet.getRange("A1:C5");
  dataRange.setValues(data);

  // Create clustered pyramid bar chart.
  const chart = sheet.addChart(
    ExcelScript.ChartType.pyramidBarClustered,
    dataRange
  );
  chart.setPosition("D1");
  chart.getTitle().setText("Organizational Hierarchy by Year (Clustered 3D Pyramid Bar)");

  // Label the series with year names.
  const seriesCollection = chart.getSeries();
  seriesCollection[0].setName("2023");
  seriesCollection[1].setName("2024");

  chart.getLegend().setPosition(ExcelScript.ChartLegendPosition.bottom);
}
Gráfico de barras piramidales apiladas
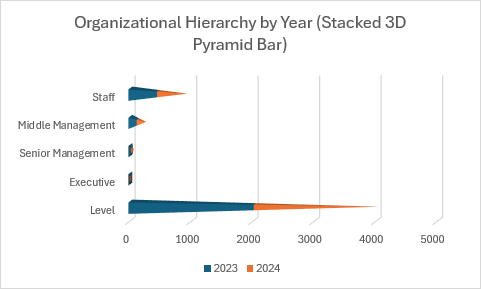
function main(workbook: ExcelScript.Workbook) {
  const sheet = workbook.getActiveWorksheet();

  // Add sample data.
  const data = [
    ["Level", "2023", "2024"],
    ["Executive", 5, 6],
    ["Senior Management", 25, 28],
    ["Middle Management", 120, 135],
    ["Staff", 450, 480]
  ];
  const dataRange = sheet.getRange("A1:C5");
  dataRange.setValues(data);

  // Create stacked pyramid bar chart.
  const chart = sheet.addChart(
    ExcelScript.ChartType.pyramidBarStacked,
    dataRange
  );
  chart.setPosition("D1");
  chart.getTitle().setText("Organizational Hierarchy by Year (Stacked 3D Pyramid Bar)");

  // Label the series with year names.
  const seriesCollection = chart.getSeries();
  seriesCollection[0].setName("2023");
  seriesCollection[1].setName("2024");

  chart.getLegend().setPosition(ExcelScript.ChartLegendPosition.bottom);
}
Gráfico de barras piramidales 100% apiladas
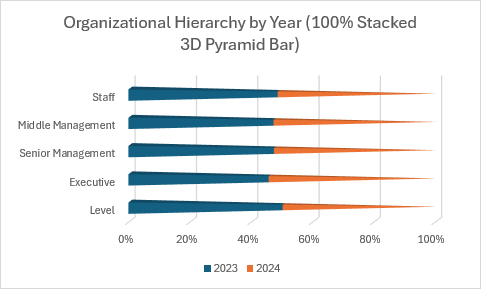
function main(workbook: ExcelScript.Workbook) {
  const sheet = workbook.getActiveWorksheet();

  // Add sample data.
  const data = [
    ["Level", "2023", "2024"],
    ["Executive", 5, 6],
    ["Senior Management", 25, 28],
    ["Middle Management", 120, 135],
    ["Staff", 450, 480]
  ];
  const dataRange = sheet.getRange("A1:C5");
  dataRange.setValues(data);

  // Create 100% stacked pyramid bar chart.
  const chart = sheet.addChart(
    ExcelScript.ChartType.pyramidBarStacked100,
    dataRange
  );
  chart.setPosition("D1");
  chart.getTitle().setText("Organizational Hierarchy by Year (100% Stacked 3D Pyramid Bar)");

  // Label the series with year names.
  const seriesCollection = chart.getSeries();
  seriesCollection[0].setName("2023");
  seriesCollection[1].setName("2024");

  chart.getLegend().setPosition(ExcelScript.ChartLegendPosition.bottom);
}
Trabajar con elementos de gráfico
En este ejemplo se muestra cómo personalizar varios elementos de gráfico que se aplican a todos los tipos de gráfico.
function main(workbook: ExcelScript.Workbook) {
  const sheet = workbook.getActiveWorksheet();

  // Add sample data.
  const data = [
    ["Month", "Revenue", "Expenses"],
    ["Jan", 45000, 32000],
    ["Feb", 52000, 35000],
    ["Mar", 48000, 33000],
    ["Apr", 61000, 38000]
  ];
  const dataRange = sheet.getRange("A1:C5");
  dataRange.setValues(data);

  // Create chart.
  const chart = sheet.addChart(
    ExcelScript.ChartType.columnClustered,
    dataRange
  );
  chart.setPosition("E1");

  // Customize chart title.
  chart.getTitle().setText("Monthly Financial Overview");
  const chartTitle = chart.getTitle();
  chartTitle.getFormat().getFont().setSize(16);
  chartTitle.getFormat().getFont().setBold(true);
  chartTitle.getFormat().getFont().setColor("#2C3E50");

  // Customize legend.
  const legend = chart.getLegend();
  legend.setPosition(ExcelScript.ChartLegendPosition.bottom);
  legend.getFormat().getFont().setSize(10);
  legend.setVisible(true);

  // Customize axes.
  const valueAxis = chart.getAxes().getValueAxis();
  valueAxis.setDisplayUnit(ExcelScript.ChartAxisDisplayUnit.thousands);
  valueAxis.getMajorGridlines().getFormat().getLine().setColor("#D3D3D3");
  valueAxis.getTitle().setText("Amount (in thousands)");

  const categoryAxis = chart.getAxes().getCategoryAxis();
  categoryAxis.getTitle().setText("Month");

  // Customize series.
  const series = chart.getSeries();
  series[0].getFormat().getFill().setSolidColor("#3498DB"); // Revenue - Blue.
  series[1].getFormat().getFill().setSolidColor("#E74C3C"); // Expenses - Red.

  // Set chart size.
  chart.setHeight(300);
  chart.setWidth(500);
}
Vea también
Colaborar con nosotros en GitHub
El origen de este contenido se puede encontrar en GitHub, donde también puede crear y revisar problemas y solicitudes de incorporación de cambios. Para más información, consulte nuestra guía para colaboradores.