Analyze network usage in UWP apps
Applies to: ![]() Visual Studio
Visual Studio ![]() Visual Studio for Mac
Visual Studio for Mac
Note
This article applies to Visual Studio 2017. If you're looking for the latest Visual Studio documentation, see Visual Studio documentation. We recommend upgrading to the latest version of Visual Studio. Download it here
The Visual Studio Network diagnostics tool collects data about network operations performed using the Windows.Web.Http API. Analyzing the data can help you resolve issues like access and authentication problems, incorrect cache-use, and poor display and download performance.
The Network tool supports only UWP apps. Other platforms are not supported at this time.
Note
For a more complete description of the Network tool, see Introducing Visual Studio's network tool.
Collect network tool data
You should run the Network tool with an open Visual Studio project on the Visual Studio computer.
Open the project in Visual Studio.
On the menu, click Debug / Performance Profiler. Choose Network, and then choose Start.
The network tool begins collecting your app's HTTP traffic.
As you run your app, the summary view in the left pane automatically displays a list of captured HTTP operations. Select an item on the summary view to see more information in the details panel in the right pane.
Choose Stop to close the app.
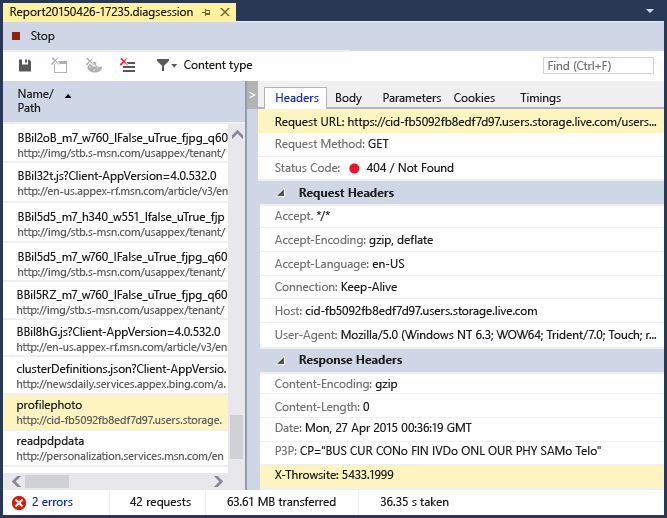
The report window should appear something like this:

Analyze data
You can analyze captured HTTP traffic while your app is running, or even after the app has been closed, by selecting any of the network operations displayed on the summary view.
The Network summary view shows data for each network operation in the run of your app. Choose a column header to sort the list, or choose the content types to display in the Content Type filter view.
Choose the Save as HAR to create a JSON file that can be consumed by third-party tools like Fiddler.
The Network details views displays more information about a network operation in the summary view.

| Name | Description |
|---|---|
| Headers | Information about the request headers of the event. |
| Body | The request and response payload data. |
| Parameters | The query string parameter names and values. |
| Cookies | Response and request cookie data. |
| Timings | A graph of stages in acquiring the selected resources. |
The Network summary bar shows the number of network operations that are displayed at any given point, how much data was transferred, how much time it took to download them, and how many errors (requests with 4xx or 5xx responses) are visible.
Analysis tips
This tool highlights certain areas that can be useful when you are running network-related analysis:
Requests that are fully served from the cache are shown as (from cache) in the Received column. This can help you determine whether you are using the cache effectively to save user bandwidth, or whether you are caching responses by mistake and providing the end-user of your application with outdated data.
Error responses (4xx or 5xx) are displayed in the Results column with a red status code and are also highlighted in the summary bar. This makes it easy to spot errors among the many potential requests on your application.
The response pretty printing button (inside the body tab) can help you parse through JSON, XML, HTML, CSS, JavaScript, and TypeScript response payloads by increasing the readability of the content.