Note
Access to this page requires authorization. You can try signing in or changing directories.
Access to this page requires authorization. You can try changing directories.
This module takes about 25 minutes to complete. You create a dataflow, apply transformations, and move the raw data from the bronze data layer table into a gold data layer table.
With the raw data loaded into your bronze Lakehouse table from the last module, you can now enrich it. You'll combine it with another table that contains discounts for each vendor and their trips during a particular day. Then, this final gold Lakehouse table is then loaded and ready for consumption.
The high-level steps in the dataflow are:
- Get raw data from the Lakehouse table created by the copy job in Module 1: Create a pipeline with Data Factory.
- Transform the data imported from the Lakehouse table.
- Connect to a CSV file containing discounts data.
- Transform the discounts data.
- Combine trips and discounts data.
- Load the output query into the Gold Lakehouse table.
Prerequisites
Module 1 of this tutorial series: Create a pipeline with Data Factory
Get data from a Lakehouse table
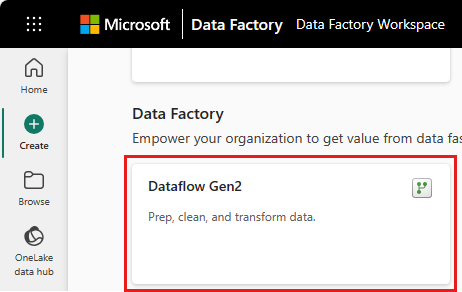
From the sidebar, select your workspace, select New item, and then Dataflow Gen2 to create a new Dataflow Gen2.
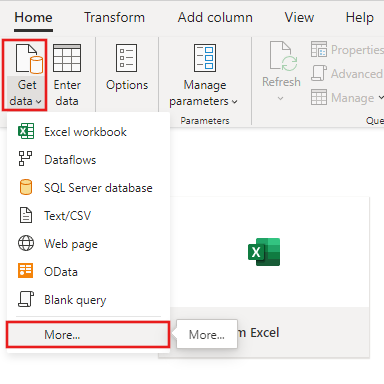
From the new dataflow menu, select Get data, and then More....
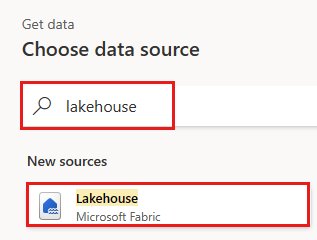
Search for and select the Lakehouse connector.
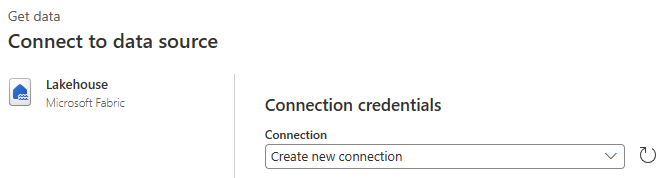
The Connect to data source dialog appears, and a new connection is automatically created for you based on the currently signed in user. Select Next.
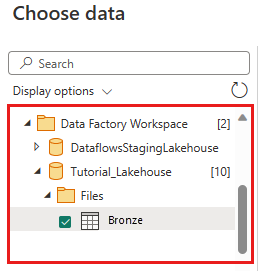
The Choose data dialog is displayed. Use the navigation pane to find the Lakehouse you created for the destination in the prior module. It might be under the My workspace folder. Select the Bronze data table. Then select Create.
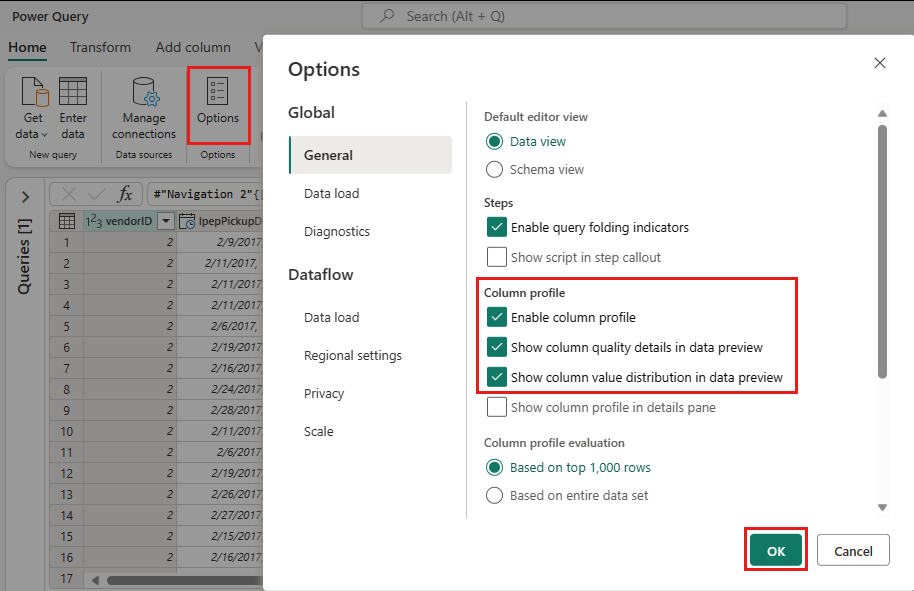
(Optional) Once your canvas is populated with the data, you can set column profile information, as this is useful for data profiling. You can apply the right transformation and target the right data values based on it.
To do this, select Options from the ribbon pane, then select the first three options under Column profile, and then select OK.


Transform the data imported from the Lakehouse
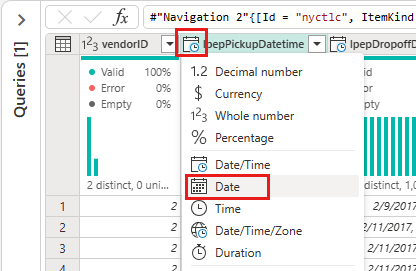
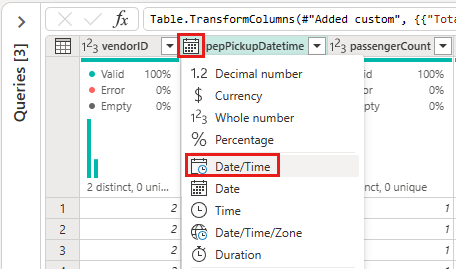
Select the data type icon in the column header of the second column, IpepPickupDatetime, to display a dropdown menu and select the data type from the menu to convert the column from the Date/Time to Date type.
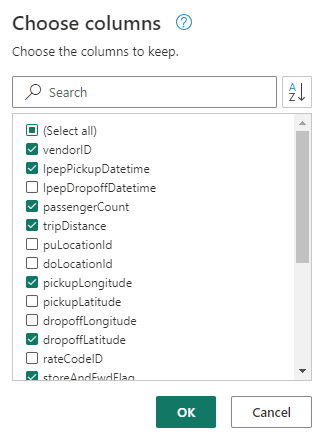
(Optional) On the Home tab of the ribbon, select the Choose columns option from the Manage columns group.
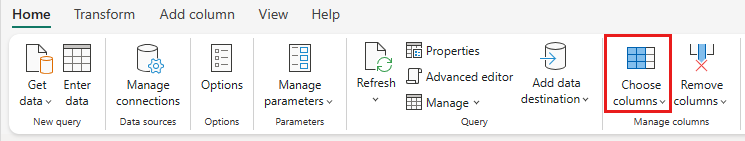
(Optional) On the Choose columns dialog, deselect some columns listed here, then select OK.
- vendorID
- lpepPickupDatetime
- passengerCount
- tripDistance
- picukupLongitude
- dropoffLatitude
- storeAndFwdFlag
- totalAmount
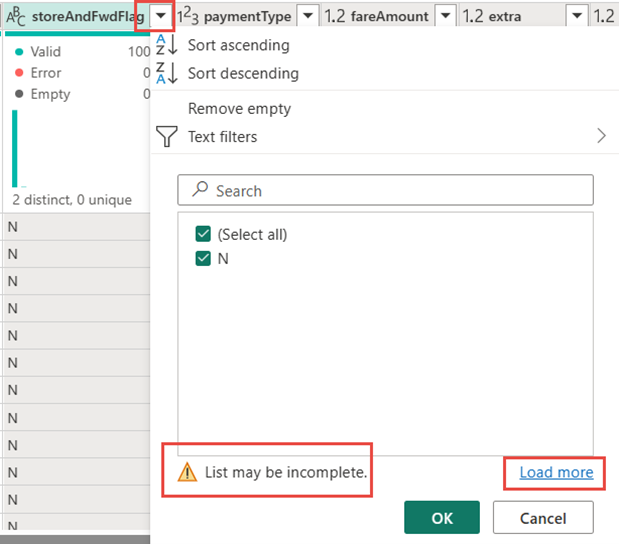
Select the storeAndFwdFlag column's filter and sort dropdown menu. (If you see a warning List may be incomplete, select Load more to see all the data.)
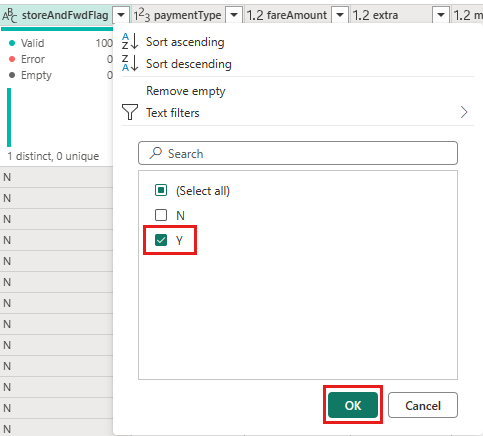
Select 'Y' to show only rows where a discount was applied, and then select OK.
Wait until the data is filtered.
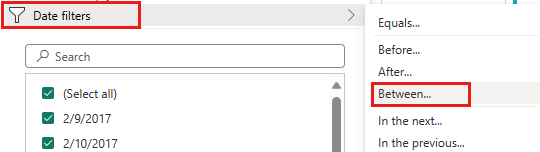
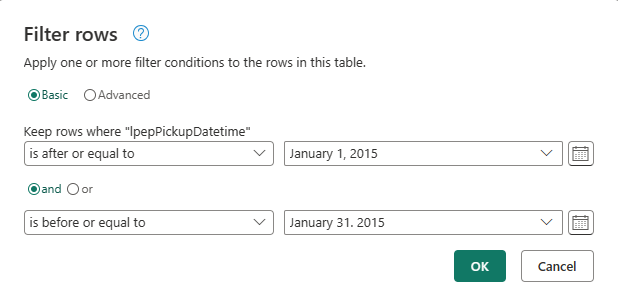
Select the IpepPickupDatetime column sort and filter dropdown menu, then select Date filters, and choose the Between... filter provided for Date and Date/Time types.
In the Filter rows dialog, select dates between January 1, 2015, and January 31, 2015, then select OK.
Wait until the data is filtered.

Connect to a CSV file containing discount data
With the data from the trips in place, we want to load the data that contains the respective discounts for each day and VendorID, and prepare the data before combining it with the trips data.
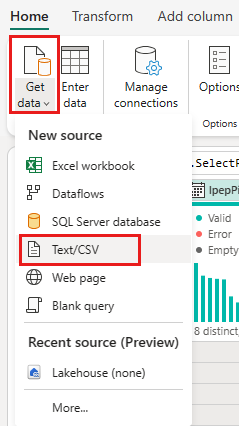
From the Home tab in the dataflow editor menu, select the Get data option, and then choose Text/CSV.
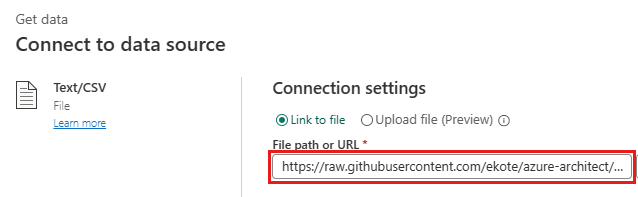
On the Connect to data source dialog, provide the following details:
- File path or URL -
https://raw.githubusercontent.com/ekote/azure-architect/master/Generated-NYC-Taxi-Green-Discounts.csv - Authentication kind - Anonymous
Then select Next.
- File path or URL -
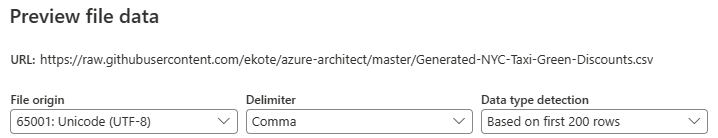
On the Preview file data dialog, select Create.


Transform the discount data
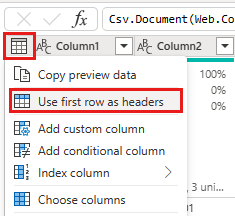
Reviewing the data, we see the headers appear to be in the first row. Promote them to headers by selecting the table's context menu at the top left of the preview grid area to select Use first row as headers.
Note
After promoting the headers, you can see a new step added to the Applied steps pane at the top of the dataflow editor to the data types of your columns.
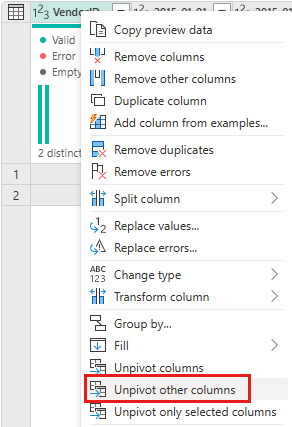
Right-click the VendorID column, and from the context menu displayed, select the option Unpivot other columns. This allows you to transform columns into attribute-value pairs, where columns become rows.
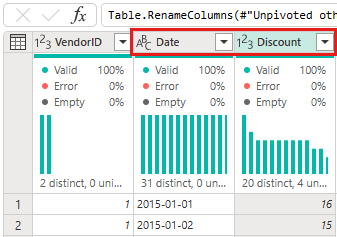
With the table unpivoted, rename the Attribute and Value columns by double-clicking them and changing Attribute to Date and Value to Discount.
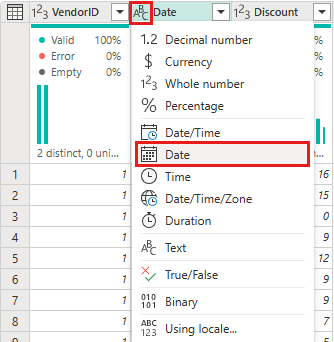
Change the data type of the Date column by selecting the data type menu to the left of the column name and choosing Date.
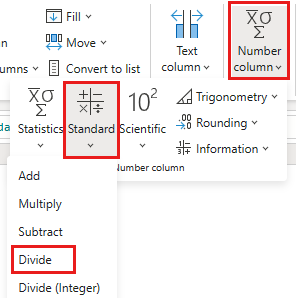
Select the Discount column and then select the Transform tab on the menu. Under the Number column section select Standard numeric transformations from the submenu, and choose Divide.
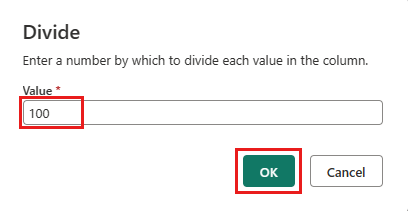
On the Divide dialog, enter the value 100.

Combine trips and discounts data
The next step is to combine both tables into a single table that has the discount that should be applied to the trip, and the adjusted total.
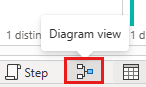
First, toggle the Diagram view button on the bottom right of the window, so you can see both of your queries.
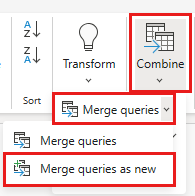
Select your original data query (In our example, its called Bronze), and on the Home tab, in the Combine menu choose Merge queries, then Merge queries as new.
On the Merge dialog, select a Left outer merge, then select Generated-NYC-Taxi-Green-Discounts from the Right table for merge drop-down, and then select the "light bulb" icon on the top right of the dialog to see the suggested mapping of columns between the two tables.
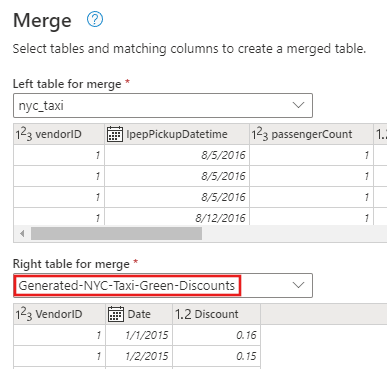
Choose suggested mapping to map the VendorID and date columns from both tables. When both mappings are added, the matched column headers are highlighted in each table.
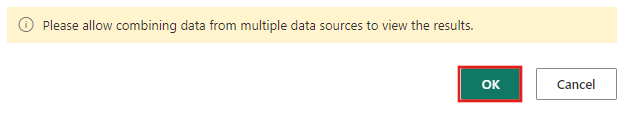
A message is shown asking you to allow combining data from multiple data sources to view the results. Select OK on the Merge dialog.
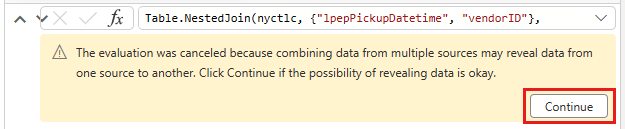
In the table area, you'll initially see a warning that "Information is required about data privacy." Select Continue to address the warning.
For this tutorial, select Ignore Privacy Levels checks for this document, since this is sample data that has no sensitive information. For your own data sources, set appropriate privacy levels to protect your sensitive data.

Select Save.
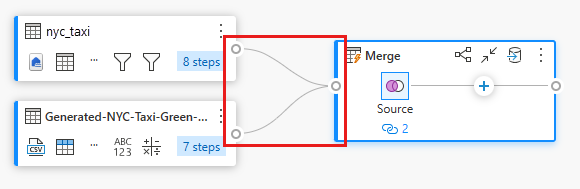
Notice how a new query was created in Diagram view showing the relationship of the new Merge query with the two queries you previously created. Looking at the table pane of the editor, scroll to the right of the Merge query column list to see a new column with table values is present. This is the "Generated NYC Taxi-Green-Discounts" column, and its type is [Table]. In the column header there's an icon with two arrows going in opposite directions, allowing you to select columns from the table. Deselect all of the columns except Discount, and then select OK.
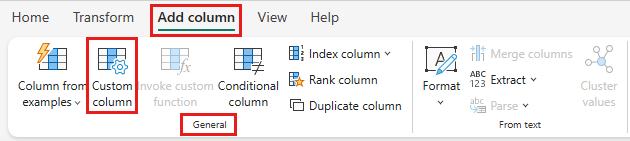
With the discount value now at the row level, we can create a new column to calculate the total amount after discount. To do so, select the Add column tab at the top of the editor, and choose Custom column from the General group.
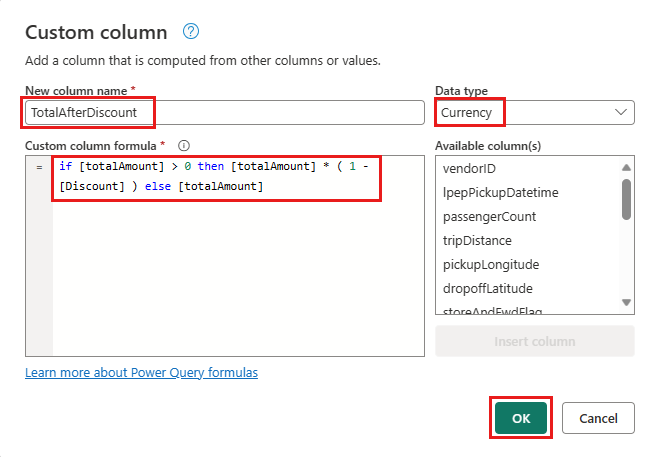
On the Custom column dialog, you can use the Power Query formula language (also known as M) to define how your new column should be calculated. Enter TotalAfterDiscount for the New column name, select Currency for the Data type, and provide the following M expression for the Custom column formula:
if [totalAmount] > 0 then [totalAmount] * ( 1 -[Discount] ) else [totalAmount]
Then select OK.
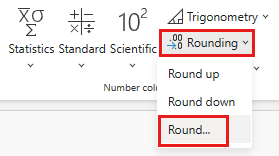
Select the newly created TotalAfterDiscount column and then select the Transform tab at the top of the editor window. On the Number column group, select the Rounding drop down and then choose Round....
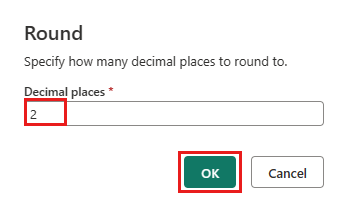
On the Round dialog, enter 2 for the number of decimal places and then select OK.
Change the data type of the IpepPickupDatetime from Date to Date/Time.
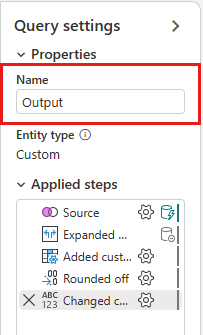
Finally, expand the Query settings pane from the right side of the editor if it isn't already expanded, and rename the query from Merge to Output.


Load the output query to a table in the Lakehouse
With the output query now fully prepared and with data ready to output, we can define the output destination for the query.
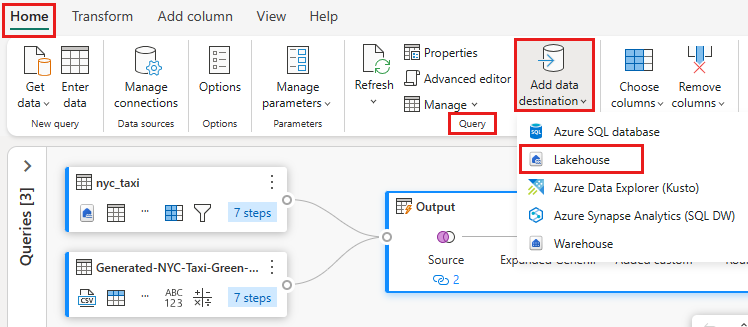
Select the Output merge query created previously. Then select the Home tab in the editor, and Add data destination from the Query grouping, to select a Lakehouse destination.
On the Connect to data destination dialog, your connection should already be selected. Select Next to continue.
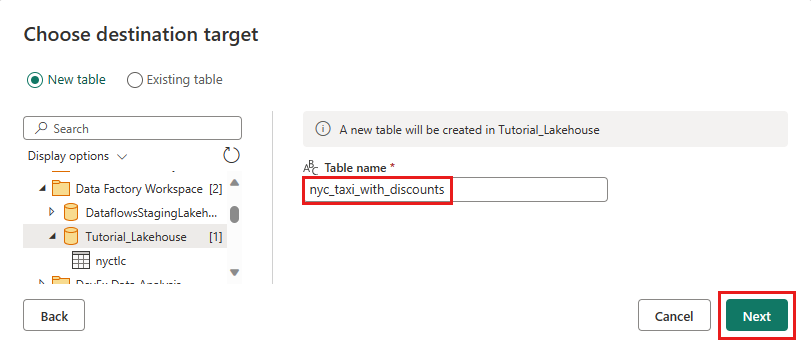
On the Choose destination target dialog, browse to the Lakehouse where you wish to load the data and name the new table nyc_taxi_with_discounts, then select Next again.
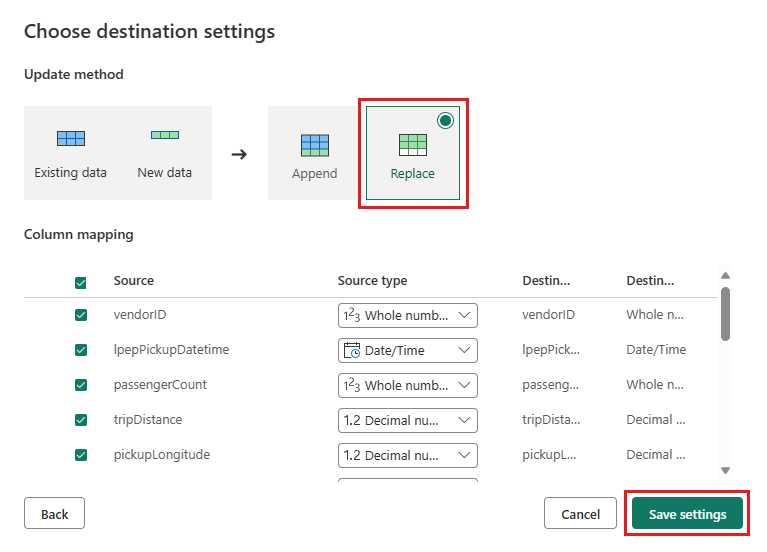
On the Choose destination settings dialog, you can use the automatic settings, or deselect the automatic settings and leave the default Replace update method, double check that your columns are mapped correctly, and select Save settings.
In the main editor window, confirm that you see your output destination on the Query settings pane for the Output table under Data destination, and then select Save & run.
Important
When the first Dataflow Gen2 is created in a workspace, Lakehouse and Warehouse items are provisioned along with their related SQL analytics endpoint and semantic models. These items are shared by all dataflows in the workspace and are required for Dataflow Gen2 to operate, shouldn't be deleted, and aren't intended to be used directly by users. The items are an implementation detail of Dataflow Gen2. The items aren't visible in the workspace, but might be accessible in other experiences such as the Notebook, SQL-endpoint, Lakehouse, and Warehouse experiences. You can recognize the items by their prefix in the name. The prefix of the items is `DataflowsStaging'.
(Optional) On the workspace page, you can rename your dataflow by selecting the ellipsis to the right of the dataflow name that appears after you select the row, and choosing Settings. In this example we rename it to nyc_taxi_with_discounts.
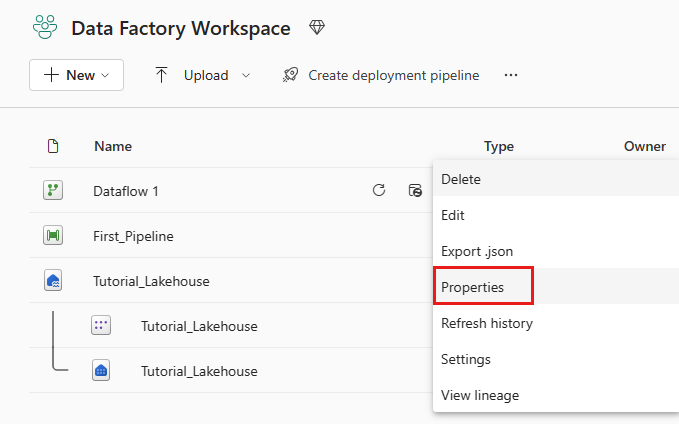
Select the refresh icon for the dataflow under the More options ellipsis, and when complete, you should see your new Lakehouse table created as configured in the Data destination settings.

Check your Lakehouse to view the new table loaded there.

Next step
Continue to the next section to integrate your pipeline.